XRP Chart Analysis 21/8/68XRP is currently moving within a sideways channel, awaiting a clear breakout direction. The key support lies at 89 THB, which coincides with the previous swing low and the 100-day EMA. A breakdown below this level would shift the trend into bearish territory.
Trading Strategy:
Consider accumulating near the support zone at 89 THB.
Place a stop-loss if the price falls below 89 THB to prevent further downside risk.
If XRP holds this support, the first resistance target is 108 THB.
A confirmed breakout above 108 THB would mark a bullish reversal, opening the way for a retest of the previous highs.
Fundamental Outlook:
XRP continues to benefit from speculation around potential ETF approvals and the ongoing SEC case. A favorable resolution could act as a major catalyst, supporting a stronger upside move.
Trade ideas
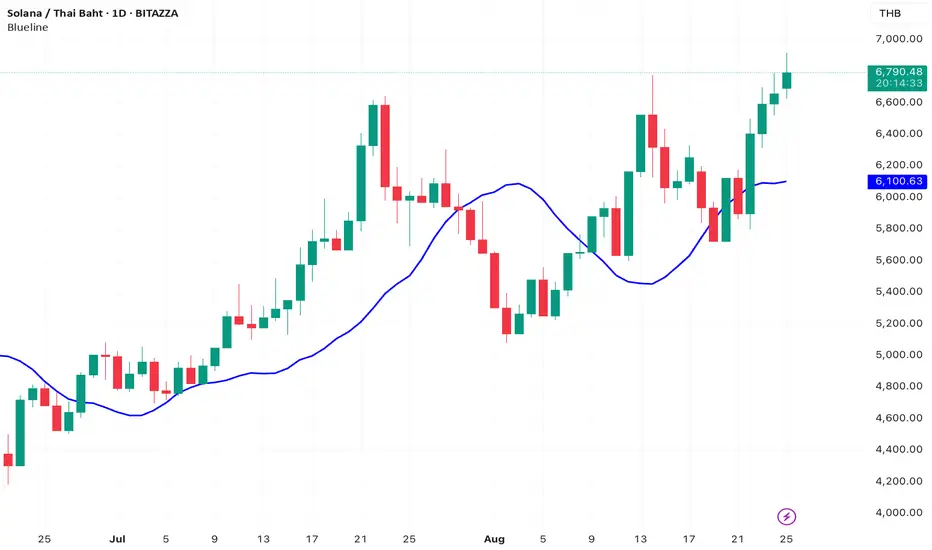
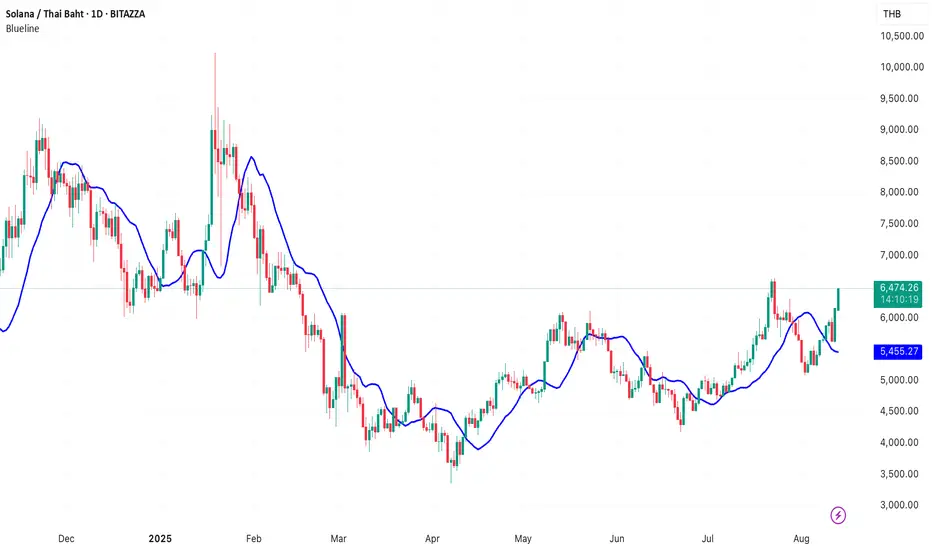
SOL Chart Analysis 13/8/68SOL has broken above its descending trendline, signaling a potential shift in momentum. If the price can clear the key resistance at 6,600 THB, the broader trend will turn bullish, supported by a Golden Cross as the 50-day EMA crosses above the 200-day EMA. The medium-term target is a retest of the previous high at 10,000 THB.
Trading Strategy:
A buy entry can be considered near the support level at 5,437 THB in case of a pullback.
A stop-loss should be placed at 5,075 THB to limit downside risk.
If SOL retests 6,600 THB and breaks through, it would confirm a strong bullish reversal, opening the way toward the 10,000 THB target.
Fundamentally, SOL is benefiting from anticipation of SOL ETF approvals and increased institutional interest, as publicly listed companies add SOL to their investment portfolios.
SOLTHB | Contracting triangle possible breakout Price action and chart pattern trading setup
> Elliott Wave position: Standard Zigzag ABC correction ending with contracting triangle about to breakout
> Entry at stop loss eater dump and pump at SMA50
> 1st Target at SMA20 zone 0.5 and 2nd target at previous 3rd Wave position zone 0.786 - 1.0
> Stoploss 3-5% plus ADR average day range roughly below entry point with risk-reward ratio 2:1 for medium-term trade
Indicator:
> Strong smart money and banker chip volume entry index > 2 at position A and C
> Banker fundflow RSI rebounded from oversold area
> BBD signal bullish divergence for trend reversal at TF4H
> KDJ stochastic on coming uptrend ribbon
Always trade with affordable risk and respect your stoploss
