Why Gen X Struggles with Crypto?Why does Gen X struggle with crypto?
Because they’re used to the stock market system, where ownership is recorded by a central registry and trades that are tied to a specific exchange.
In their world, you typically should buy through Nasdaq in this example and expect to sell through Nasdaq. But with Bitcoin or other cryptocurrencies, the blockchain itself is the registry, which means you can buy on one platform and sell on another freely. That shift—from centralized exchanges to decentralized settlement—is what makes crypto hard to grasp.
Mirco Bitcoin Futures and Options
Ticker: MBT
Minimum fluctuation:
$5.00 per bitcoin = $0.50 per contract
Disclaimer:
• What presented here is not a recommendation, please consult your licensed broker.
• Our mission is to create lateral thinking skills for every investor and trader, knowing when to take a calculated risk with market uncertainty and a bolder risk when opportunity arises.
CME Real-time Market Data help identify trading set-ups in real-time and express my market views. If you have futures in your trading portfolio, you can check out on CME Group data plans available that suit your trading needs www.tradingview.com
Trade ideas

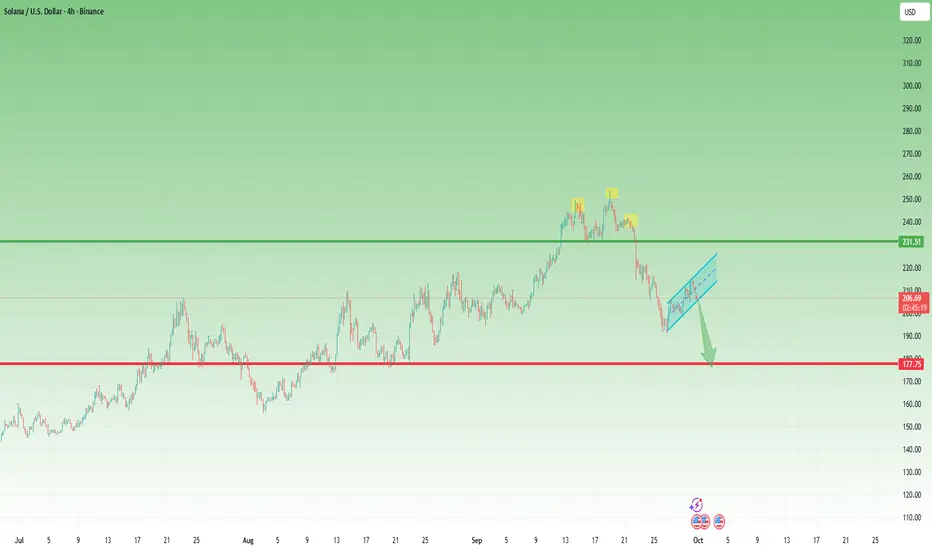
$SOLUSD Potential PlayIf it breaks pass $230
will take entry at $231
Will take profit at $250
have a stop loss at $214
if not take a bearish position back down to $214 and lower
This is just a regular technical analysis.
THIS IS NOT FINANCIAL ADVICE, BE ADVISED THIS IS NOT FINANCIAL ADVICE THIS IS SIMPLY WHAT I AM SEEING. I AM TRADING ON A PAPER TRADING ACCOUNT. MY ACTUAL MONEY ACCOUNT I TRADE OPTIONS AND AM DOING ALRIGHT THE NEWS IS REALLY TEARING ME APART BUT WITH STOCKS I AM LEARNING THAT ITS VOLUME AND TIME THAT MATTER. NO ONE CAN TELL YOU ITS GOING DOWN TOMORROW BUT IF THE CABAL DOESNT WANT IT DOWN FOR A MONTH OR A YEAR OR 5 YEARS IT WON'T GO DOWN AND YOU WILL BE STUCK IN THAT POSITION. SO, PATIENCE IS KEY.

$SOL for Long Monthly ChartThis target will complete in next 1000 Days. Long target for SOL.
Cup & Handle Pattern on Monthly.
Short term
target is 900$
Target 2 is 1200$
Let's go.

Solana's Comeback: Can it Break $222 and Eye $230?Solana's Comeback: Can it Break $222 and Eye $230?
Solana (SOL) is currently in a critical phase of recovery on the 4-hour timeframe after undergoing a significant correction from its peak around the 250 "Key Resistance (Sell Order Block)." Following a breakdown from a previous ascending channel and the 235-240 "flip zone," SOL found significant support near the 190 level.
From that low, we've observed the formation of a new, albeit tighter, ascending trendline, suggesting renewed buying interest and a series of higher lows. SOL is now encountering immediate resistance in the 215-222 range.
A decisive break above this 215-222 key resistance would be a bullish indicator, potentially targeting the 230 level and then the more substantial 235-240 "flip zone." Conversely, maintaining the integrity of the current ascending trendline and holding above the 200 to 205 "Immediate Sup-port" is crucial for this recovery to continue. A breakdown from these levels could see SOL retesting the "Next Support near 190." The overall structure indicates a battle between buyers attempting to regain momentum and sellers looking to defend higher price levels.
Disclaimer:
The information provided in this chart is for educational and informational purposes only and should not be considered as investment advice. Trading and investing involve substantial risk and are not suitable for every investor. You should carefully consider your financial situation and consult with a financial advisor before making any investment decisions. The creator of this chart does not guarantee any specific outcome or profit and is not responsible for any losses incurred as a result of using this information. Past performance is not indicative of future results. Use this information at your own risk. This chart has been created for my own improvement in Trading and Investment Analysis. Please do your own analysis before any investments.

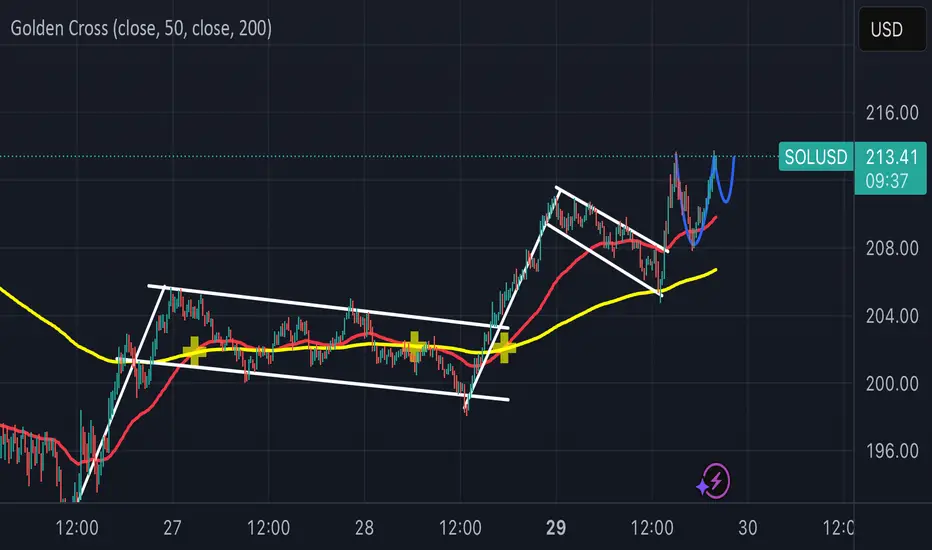
Time to leave the tiny ascending channel!We’re leaving the tiny ascending channel here. Continueing our journey inside the .. much bigger ascending channel. Very very very bullish!

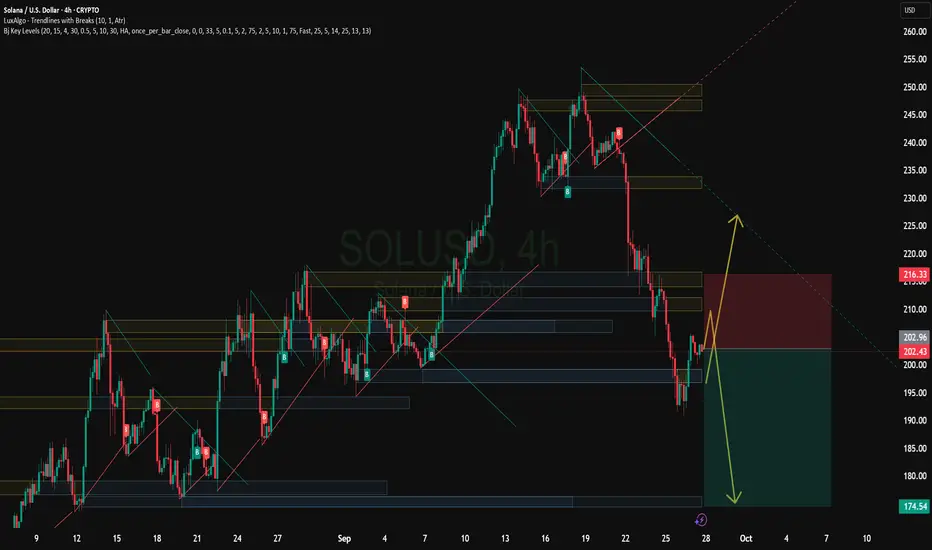
Solana: From 254 Highs Back to the 200 Line – What’s Next?At the end of August, I wrote that as long as 190 remained intact, Solana had room to rise toward 250, and I suggested a buy around the 200 level. That trade worked beautifully, with price reaching as high as 254.
From there, Solana started to roll over. At first, it looked like a normal correction, but the picture changed after a weak bounce attempt. Price broke decisively below 230, and the recent low was set right back at 190.
Currently, Solana is recovering once again. However, the structure of this bounce looks corrective in nature, forming what appears to be a bearish flag.
🔑 Key levels to watch:
• A break below the flag’s support – and more importantly below 200 – would likely trigger another leg down.
• In that case, the market could head toward a 175–180 major support zone, which is the next critical area for buyers to defend.
Until then, the bias remains cautious: Solana must prove it can break free from the corrective structure before bulls can regain control. 🚀
SOLUSD Based on the H4 chart analysis, we could see the price rising towards the sell entry which lines up with the 38.2% Fibonacci retracement and could reverse from this level to the take profit.
Sell entry is at 216.43, which is an overlap resistance that lines up with the 38.2% Fibonacci retracement.
Stop loss is at 230.50, which is a pullback resistance that lines up with the 61.8% Fibonacci retracement.
Take profit is at 194.30, which is a pullback support.
High Risk Investment Warning
Trading Forex/CFDs on margin carries a high level of risk and may not be suitable for all investors. Leverage can work against you.
Stratos Markets Limited (tradu.com ):
CFDs are complex instruments and come with a high risk of losing money rapidly due to leverage. 65% of retail investor accounts lose money when trading CFDs with this provider. You should consider whether you understand how CFDs work and whether you can afford to take the high risk of losing your money.
Stratos Europe Ltd (tradu.com ):
CFDs are complex instruments and come with a high risk of losing money rapidly due to leverage. 66% of retail investor accounts lose money when trading CFDs with this provider. You should consider whether you understand how CFDs work and whether you can afford to take the high risk of losing your money.
Stratos Global LLC (tradu.com ):
Losses can exceed deposits.
Please be advised that the information presented on TradingView is provided to Tradu (‘Company’, ‘we’) by a third-party provider (‘TFA Global Pte Ltd’). Please be reminded that you are solely responsible for the trading decisions on your account. There is a very high degree of risk involved in trading. Any information and/or content is intended entirely for research, educational and informational purposes only and does not constitute investment or consultation advice or investment strategy. The information is not tailored to the investment needs of any specific person and therefore does not involve a consideration of any of the investment objectives, financial situation or needs of any viewer that may receive it. Kindly also note that past performance is not a reliable indicator of future results. Actual results may differ materially from those anticipated in forward-looking or past performance statements. We assume no liability as to the accuracy or completeness of any of the information and/or content provided herein and the Company cannot be held responsible for any omission, mistake nor for any loss or damage including without limitation to any loss of profit which may arise from reliance on any information supplied by TFA Global Pte Ltd.
The speaker(s) is neither an employee, agent nor representative of Tradu and is therefore acting independently. The opinions given are their own, constitute general market commentary, and do not constitute the opinion or advice of Tradu or any form of personal or investment advice. Tradu neither endorses nor guarantees offerings of third-party speakers, nor is Tradu responsible for the content, veracity or opinions of third-party speakers, presenters or participants.

Descending channel followed by cup and handle?After the bull flag we had a descending channel pattern. I’m thinking that we are about to form a cup and handle pattern here. All three patterns are bullish.
SOL call another BUYvery simple set up , waiting at key zones to enter the market, the retracement is abvious and we have to take advantage of the next bullrun


Solana Chart Fibonacci Analysis 092725Trading Idea
1) Find a FIBO slingshot
2) Check FIBO 61.80% level
3) Entry Point > 200/61.80%
Chart time frame:B
A) 15 min(1W-3M)
B) 1 hr(3M-6M)
C) 4 hr(6M-1year)
D) 1 day(1-3years)
Stock progress:A
A) Keep rising over 61.80% resistance
B) 61.80% resistance
C) 61.80% support
D) Hit the bottom
E) Hit the top
Stocks rise as they rise from support and fall from resistance. Our goal is to find a low support point and enter. It can be referred to as buying at the pullback point. The pullback point can be found with a Fibonacci extension of 61.80%. This is a step to find an entry-level position. 1) Find a triangle (Fibonacci Speed Fan Line) that connects the high (resistance) and low (support) points of the stock in progress, where it is continuously expressed as a Slingshot, 2) and create a Fibonacci extension level for the first rising wave from the start point of the slingshot pattern.
When the current price goes over the 61.80% level, that can be a good entry point, especially if the SMA 100 and 200 curves are gathered together at 61.80%, it is a very good entry point.
As a great help, TradingView provides these Fibonacci speed fan lines and extension levels with ease. So if you use the Fibonacci fan line, the extension level, and the SMA 100/200 curve well, you can find an entry point for the stock market. At least you have to enter at this low point to avoid trading failure, and if you are skilled at entering this low point, with the fibonacci6180 technique, your reading skill of to chart will be greatly improved.
If you want to do day trading, please set the time frame to 5 minutes or 15 minutes, and you will see many of the low points of rising stocks.
If you prefer long-term range trading, you can set the time frame to 1 hr or 1 day

Solana $SOL retrace to around $85 then pump to $1400 in 2027Two legged measured move wave pattern suggests that solana CRYPTOCAP:SOL will retrace to around $85 then pump to $1400 in 2027.

Solana Weekly Forecast and ScenariosWeekly Forecast and Scenarios
Bullish scenario: SOL holds support near $200–$210 and breaks through the $245–$250 zone, leading to a directional move toward $270 and beyond (even to $300).
Consolidation: The price may fluctuate within the $200–$245 range, awaiting volume and news, without a clear trend.
Bearish scenario: A breakout from the support range (below ~$188–$200) could lead to a pullback to lower levels of $170–$180.
SOl buy NOW to the moon After a downword trend , solana has swiped up liquidity and is ready for thenext bull run , let's see some new all time high =s

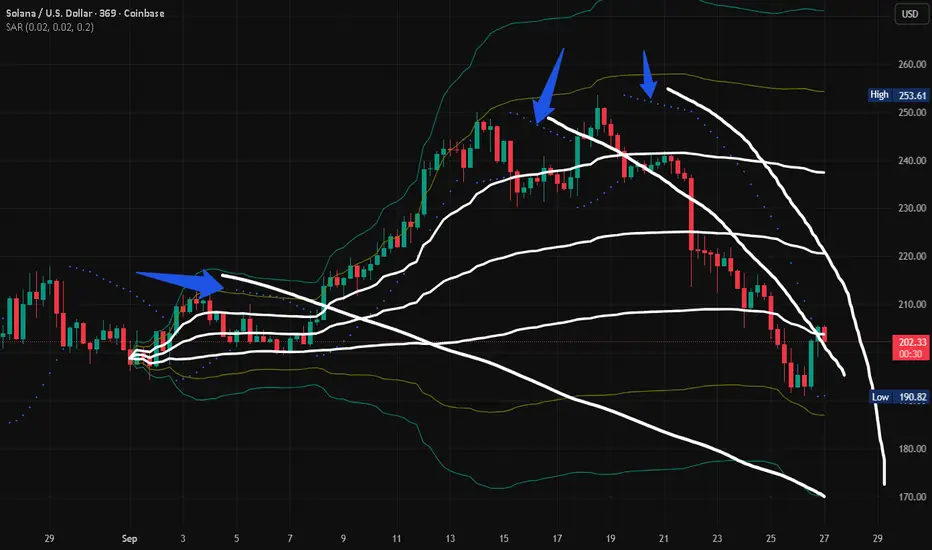
looks like $150 by the end of the monthwill it follow the dots direction straight down? or is it an epic v bottom?
looks like it followed the previous down parabolic sars
Solana macro retracement complete , full on bear marketEyeing 40-70 dollar solana post macro C wave correction. the ending diagonal on the retracement gives me reason to believe we are in full bear , and we have been for a while. Looking for critiques and alternate wave counts are welcome to test my thesis. I would love higher prices ,but I have to protect my positions if i'm seeing bearish counts.

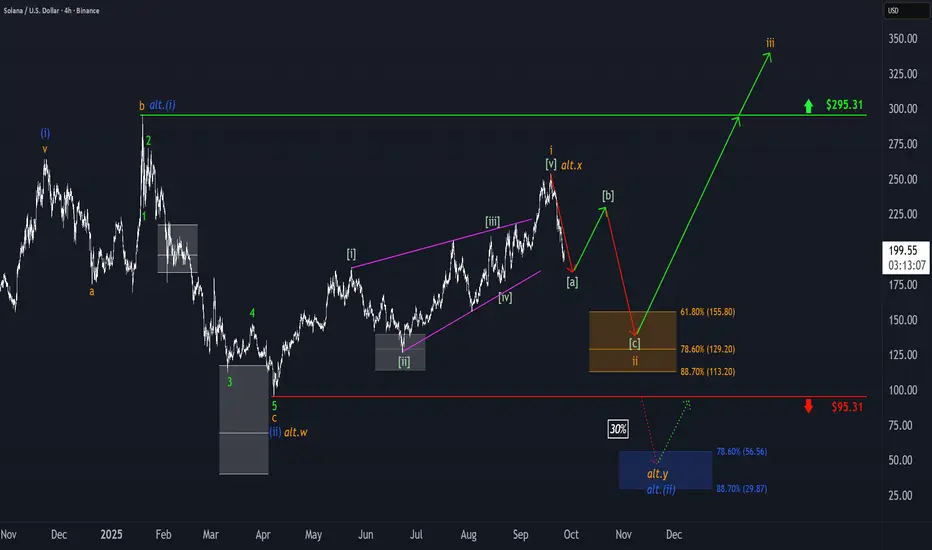
Solana: Target Zone in FocusSOL has dropped more than 20% from last Thursday’s high. In light of this, we now believe that last week’s high—reached on Thursday—marked the top of wave i in orange, and that price is currently undergoing a wave ii corrective phase. This correction should play out as a downward, three-part move labeled - - in green, ultimately targeting our orange zone between $155.80 and $113.20. We expect the low of this wave ii to occur within that Target Zone, which should set the stage for a bullish reversal. The following wave iii in orange is projected to push SOL to new all-time highs, breaking through resistance at $295.31.
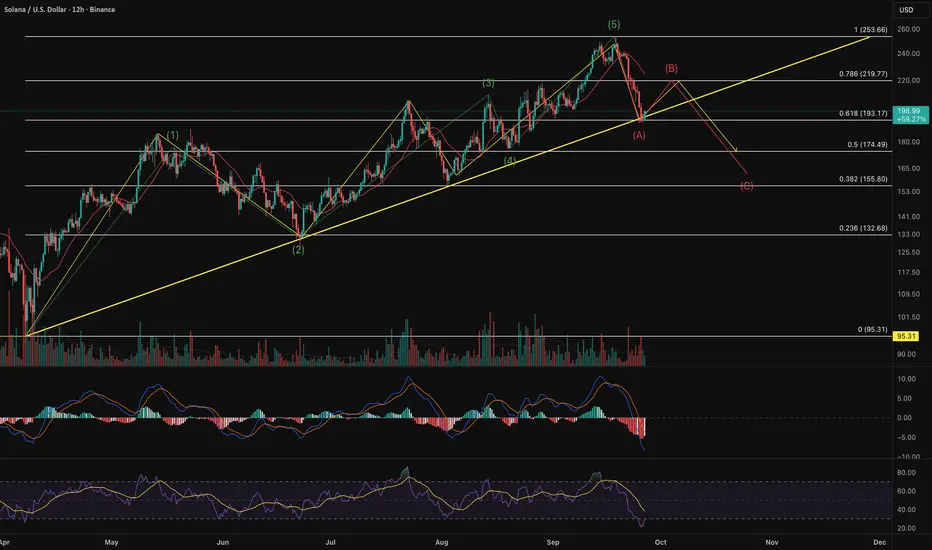
SOL on A‑B‑C correctionWave B usually retraces 38‑62 % of wave A. A 38.2 % retracement from the wave‑A low (≈ US$193.17) yields a bounce to roughly US$216.28, while a 61.8 % retracement projects a rally toward US$230.55. The earlier peak around US$219.77 (78.6 % fib of the full range) provides a realistic target range (≈ US$216–231).
In zigzag corrections, wave C often equals wave A in length or extends by a Fibonacci multiple. Assuming wave B tops near US$219.77–230.55, a drop equal to the US$60.49 length of wave A would target US$159–170. The 38.2 % Fibonacci retracement of the entire move (≈ US$155.80) and the 50 % level (≈ US$174.49) mark likely support zones.
(generated by AI)
Solana's oversold RSI. Major upward move ahead.Solana Fibonacci .618 retracement resets RSI to oversold, which signals a major move ahead.
A major move would also coincide with the upcoming major ETF approval on October 10.

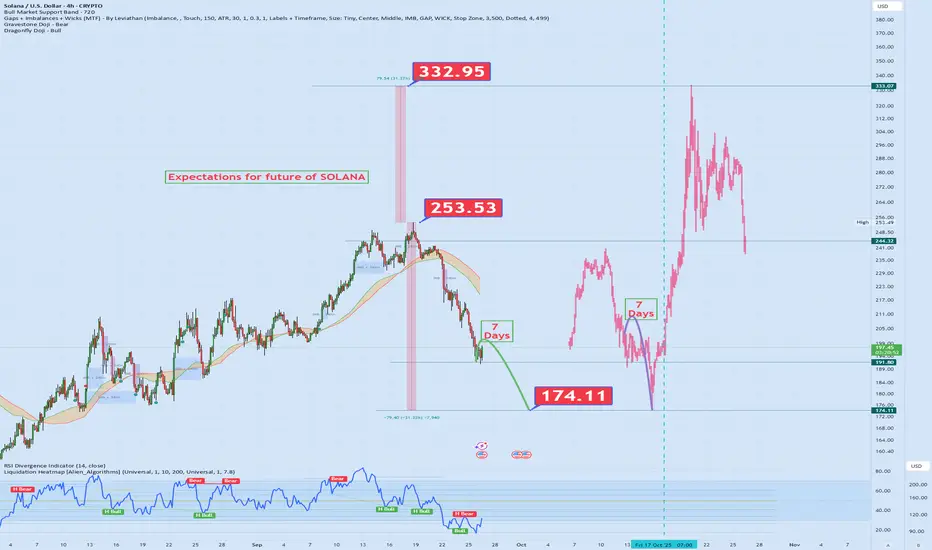
SOLANA Technical Analysis & My ProjectionI've combined past price action with future possibilities on the SOL chart. Here are the key highlights:
🚀 Peak Level: 332.95 📉 Correction Zone: 253.53 🛑 Support Area: 174.11
📍 Supported by RSI and moving averages, the red line represents my personal expectation. It points to a potential recovery and a new bullish trend. 💥
🔁 I’ve mapped out scenario-based planning using historical price behavior—now my eyes are on that red trajectory! 💡 Technical analysis + intuition = strategic positioning!
📌 What do you think? Will this scenario play out? Drop your thoughts below! 👇
Solana coin up another 60% Whats next In this video I recap our previous video calling for a pullback into $150 with a target of $240 which has now been fulfilled .
The question is whats next from $240, we are top heavy and despite market structure still bullish I anticipate a move up to fill the single prints at $245/250 before a healthy pull back into $200 zone .
I also recap Bitcoin and the ETH /BTC pair
Take the trades level by level and plan ahead . Enjoy

SOL RSI Reset & SupportsWe are experiencing a painful but necessary pullback to reset our RSI and start with a fresh sleeve. I would like to outline the critical supports we have on the daily chart.
1. 100 day MA - 194 USD
2. 200 day MA - 180 USD
3. 0.382 fib level - 164 USD
From looking at the RSI I would deem the 194 level as most likely, however breaking that support would lead to a further downtrend. DYOR and let me know your thoughts

SOLUSDT ShortedWe saw a free fall for SOLUSDT, which can touch around 210-20,5, taking a short position with a risk of 10$ and RR of 1:4. Risk Management is more important than trading RM first trading next
