Sol/Usdt - Breakout Or BreakdownResistance Zone
A green shaded area labeled "Resistance" indicates a key price level where price has previously failed to break higher.
This is a supply zone where sellers have stepped in multiple times.
Price has tested this resistance area several times but failed to break out convincingly.
2. CHoCH (Change of Character)
"CHoCH" is marked below the resistance, signaling a trend shift from bullish to bearish.
Typically, a CHoCH occurs when price breaks a recent higher low—indicating weakening bullish momentum and potential start of bearish move.
3. Decision Point
Labeled in blue as “Decision Point”.
This is a critical area where price may:
Break above and confirm a bullish continuation.
Reject and fall, confirming bearish pressure.
This zone could be used to plan entries based on confirmation (e.g., breakout or rejection).
4. Target Scenarios
Two possible scenarios drawn with arrows:
Bullish scenario: If price breaks above the decision point/resistance, the next target lies in the upper 230s or beyond.
Bearish scenario: If price rejects from this zone, it could lead to a bearish continuation, targeting lower support levels.
5. Volume
Volume bars at the bottom show varying levels of interest.
Increasing red volume toward the CHoCH indicates strong selling pressure.
Conclusion / Trading Plan
Watch the Decision Point zone closely.
Bullish bias: On a breakout with strong volume and bullish candle close above resistance.
Bearish bias: On rejection from the resistance zone with a lower high and a strong bearish candle.
Use tight risk management due to the proximity of volatility around the decision point.
Trade ideas

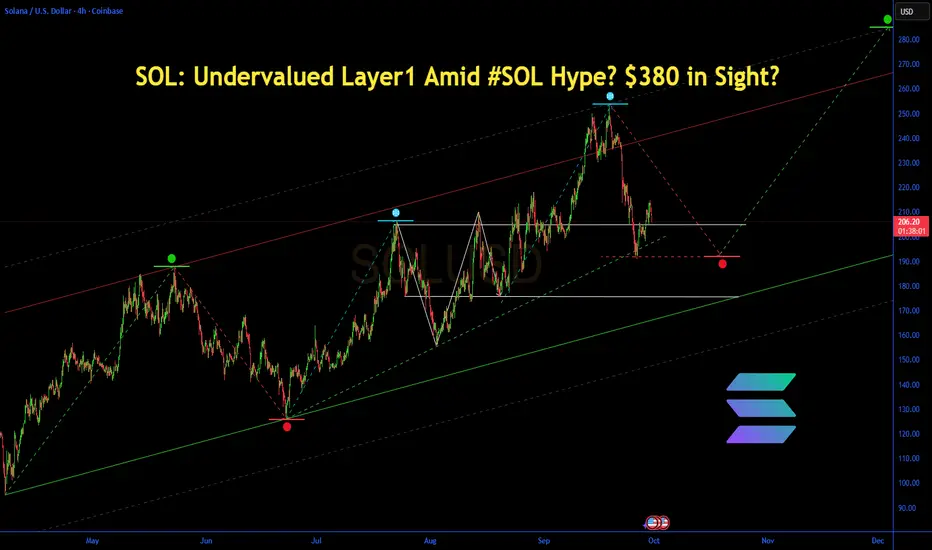
SOL: Undervalued Layer1 Amid #SOL Hype? $380 in Sight?SOL: Undervalued Layer1 Amid #SOL Hype? $380 in Sight?
Price $210.94 (-1.07%), fueled by TVL $12.2B surge and X airdrops, undervalued with 31.83% YTD, questioning if ETF inflows drive breakout.
Fundamental Analysis
Market cap $114.55B, TVL $12.2B up 57% 6M, supply growth stable; Lynch-like growth emphasis on 198% TVL rise, PEG adapted low vs peers; DCF projects $300+ on adoption moat; opportunity cost vs ETH favors efficiency, inversion warns outages.
Positive:
3.88% monthly rise.
67% staked.
Negative:
High volatility.
Rival competition.
SWOT Analysis
Strengths: Fast DeFi hub.
Weaknesses: Past downtimes.
Opportunities: ETF in #Altseason.
Threats: Regulations.
Technical Analysis
Sell signal short-term. Price: $210.94, VWAP N/A. Key indicators: RSI: Below 40/oversold.
MACD: N/A.
Moving Averages: Neutral.Support/Resistance: $177/$214. Patterns/Momentum: Potential rebound. Bullish | Bearish.
Scenarios and Risk Management
Bullish: Break $214, DCA to $380 on hype; second-order thinking amplifies network effects.
Bearish: To $150.
Neutral: Range $177-214.Risk Tips: 10% stops, diversify crypto, DCA weekly.
Conclusion/Outlook
Bullish on ecosystem, lollapalooza from #Crypto trends parabolic. Watch ETFs. Fits layer1 theme with #SOL upside. Take? Comment!
Solana: Trendline Breakdown & Support Test
Solana: Trendline Breakdown & Support Test
Solana (SOLUSD) on the 4-hour timeframe has recently broken down from its ascending trendline and is currently testing the "220 to 224 Immediate Support" zone, trading around 222.04 after a significant drop.
Bullish Scenario: For a reversal, SOL must reclaim and hold above the "220-224 Immediate Sup-port" and push past the "230" level (which was previously support), targeting "240 current Re-sistance".
Bearish Scenario (Immediate): If Solana fails to maintain the "220 to 224 Immediate Support" or gets rejected when attempting to retest the broken trendline from below, it would signal further bearish pressure, leading to a test of the "215 Key Support."
Bearish Scenario (Deeper): A confirmed breakdown below the "215 Key Support" would invalidate the recent bullish structure and likely lead to a deeper retracement towards the critical "200 to 205, Trend Change" zone, where a significant re-evaluation of the trend would be necessary.
Disclaimer:
The information provided in this chart is for educational and informational purposes only and should not be considered as investment advice. Trading and investing involve substantial risk and are not suitable for every investor. You should carefully consider your financial situation and consult with a financial advisor before making any investment decisions. The creator of this chart does not guarantee any specific outcome or profit and is not responsible for any losses incurred as a result of using this information. Past performance is not indicative of future results. Use this information at your own risk. This chart has been created for my own improvement in Trading and Investment Analysis. Please do your own analysis before any investments.
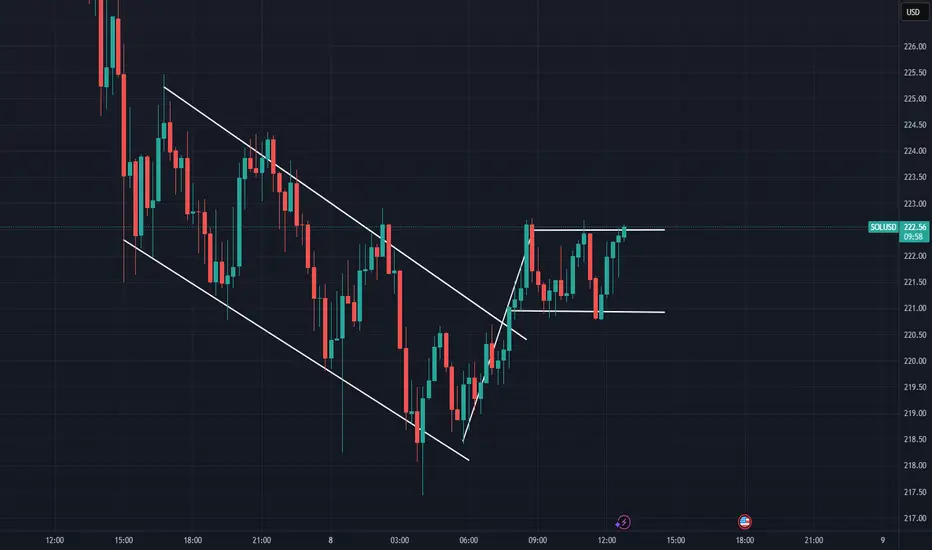
Descending channel, followed by a bullish flagSolana seemed to have stabilized again. Wondering if the bullish flag pattern will work out perfectly again. This all depends on BTCUSD and ETHUSD atm.

solana x binance coin Solana follow it Binance Coin on its journey to $1k
CRYPTOCAP:SOL vs. CRYPTOCAP:BNB

SOL/USD – Sideways Under Pressure🟠 Neutral bias below $232
Solana trades at $230, slightly below SMA200 ($232) with RSI near 41, signaling weak short-term momentum. Resistance stands at $235, support at $228.
📖 Keywords: #SOLUSD #Solana #AltcoinWatch #CryptoSetup

SOLUSD - Up Channel A sharp up channel has formed on solana's daily chart
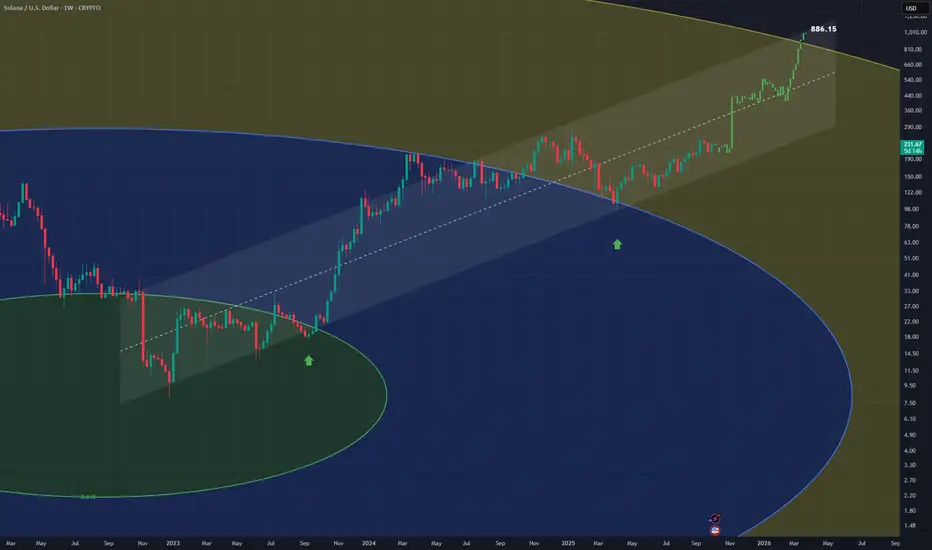
im allowing further movement up as price bounces off the fib circle ring
bullish towards the top of channel
SOLUSD H4 | Could we see a bearish reversal from here?Based on the H4 chart analysis, we can see the price reacting off the sell entry which is a pullback resistance that aligns with the 78.6% Fibonacci retracement and could reverse from this levle to the take profit.
Sell entry is at 238.31, which is a pullback resistance that aligns with the 78.6% Fibonacci retracement.
Stop loss is at 253.39, which is a swing high resistance.
Take profit is at 216.84, which is a pullback support that is slightly below the 38.2% Fibonacci retracement.
High Risk Investment Warning
Trading Forex/CFDs on margin carries a high level of risk and may not be suitable for all investors. Leverage can work against you.
Stratos Markets Limited (tradu.com ):
CFDs are complex instruments and come with a high risk of losing money rapidly due to leverage. 65% of retail investor accounts lose money when trading CFDs with this provider. You should consider whether you understand how CFDs work and whether you can afford to take the high risk of losing your money.
Stratos Europe Ltd (tradu.com ):
CFDs are complex instruments and come with a high risk of losing money rapidly due to leverage. 66% of retail investor accounts lose money when trading CFDs with this provider. You should consider whether you understand how CFDs work and whether you can afford to take the high risk of losing your money.
Stratos Global LLC (tradu.com ):
Losses can exceed deposits.
Please be advised that the information presented on TradingView is provided to Tradu (‘Company’, ‘we’) by a third-party provider (‘TFA Global Pte Ltd’). Please be reminded that you are solely responsible for the trading decisions on your account. There is a very high degree of risk involved in trading. Any information and/or content is intended entirely for research, educational and informational purposes only and does not constitute investment or consultation advice or investment strategy. The information is not tailored to the investment needs of any specific person and therefore does not involve a consideration of any of the investment objectives, financial situation or needs of any viewer that may receive it. Kindly also note that past performance is not a reliable indicator of future results. Actual results may differ materially from those anticipated in forward-looking or past performance statements. We assume no liability as to the accuracy or completeness of any of the information and/or content provided herein and the Company cannot be held responsible for any omission, mistake nor for any loss or damage including without limitation to any loss of profit which may arise from reliance on any information supplied by TFA Global Pte Ltd.
The speaker(s) is neither an employee, agent nor representative of Tradu and is therefore acting independently. The opinions given are their own, constitute general market commentary, and do not constitute the opinion or advice of Tradu or any form of personal or investment advice. Tradu neither endorses nor guarantees offerings of third-party speakers, nor is Tradu responsible for the content, veracity or opinions of third-party speakers, presenters or participants.

SOL retracementHead and shoulders is obvious and we will have a small retracement back to the zone where everything has started
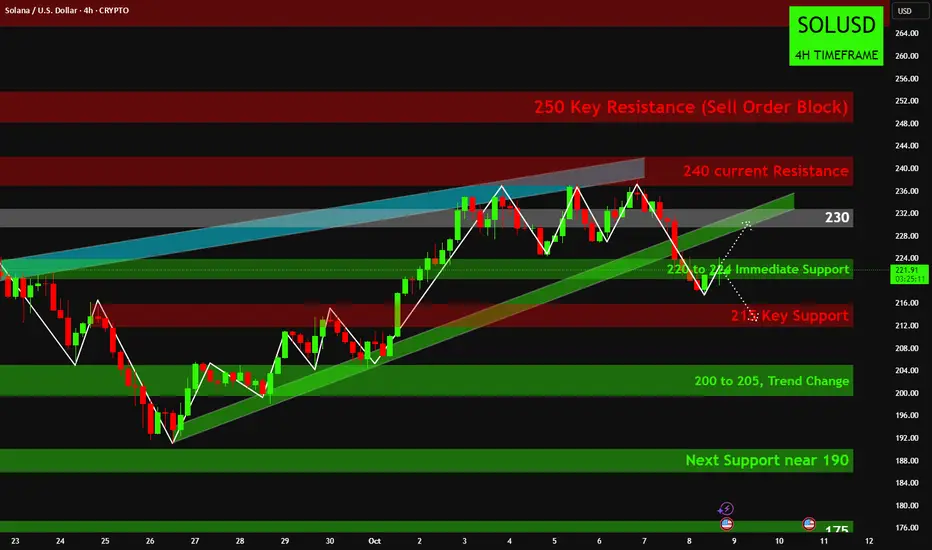
SOLUSD 4H: Solana's 250 Charge - Overcoming 240 Resistance! SOLUSD 4H: Solana's 250 Charge - Overcoming 240 Resistance!
Solana (SOLUSD) is currently exhibiting strong bullish momentum on the 4-hour chart, having rallied significantly from the "Support near 190" and "200 to 205, Trend Change" levels.
The price is now trading above "230" mark, challenging a trend channel (blue) and just below the 240 flip zone, indicating a pivotal test for the ongoing upward movement.
A potential retracement from these immediate resistance levels could see the price retest the "220 to 224 Immediate Support" zone or the ascending green trend line as critical areas for buyers to step in.
Maintaining price action above the "215 Key Support" and the "200 to 205, Trend Change" is essential for the bullish structure to remain intact and for further upside potential towards the "250 Key Resistance (Sell Order Block)".
Disclaimer:
The information provided in this chart is for educational and informational purposes only and should not be considered as investment advice. Trading and investing involve substantial risk and are not suitable for every investor. You should carefully consider your financial situation and consult with a financial advisor before making any investment decisions. The creator of this chart does not guarantee any specific outcome or profit and is not responsible for any losses incurred as a result of using this information. Past performance is not indicative of future results. Use this information at your own risk. This chart has been created for my own improvement in Trading and Investment Analysis. Please do your own analysis before any investments.

SOL Macro - Time for Price discovery?$SOLWeekly RSI has returned to the EQ giving Solana plenty of space for upside growth! Price is attempting to break into all time high but just can’t find the momentum it needs. This is good thing for now, keeping volatility to a minimum!
Weekly R5 Pivot and Fibonacci extension targets are $660. Price is above the weekly pivot showing the uptrend is in tact and may well test it as support again!
Consolidating under resistance for an extended period often leads to a breakout!
Safe trading
Another bullish flag!For my idea the two most bullish patterns are:
- cup and handles
- bullish flags
Combined with our seasonal Solana month, more possible FED rate cuts, government shutdown.. breaking the $240 resistance will become inevitable.
Let’s see how this one works out for us.

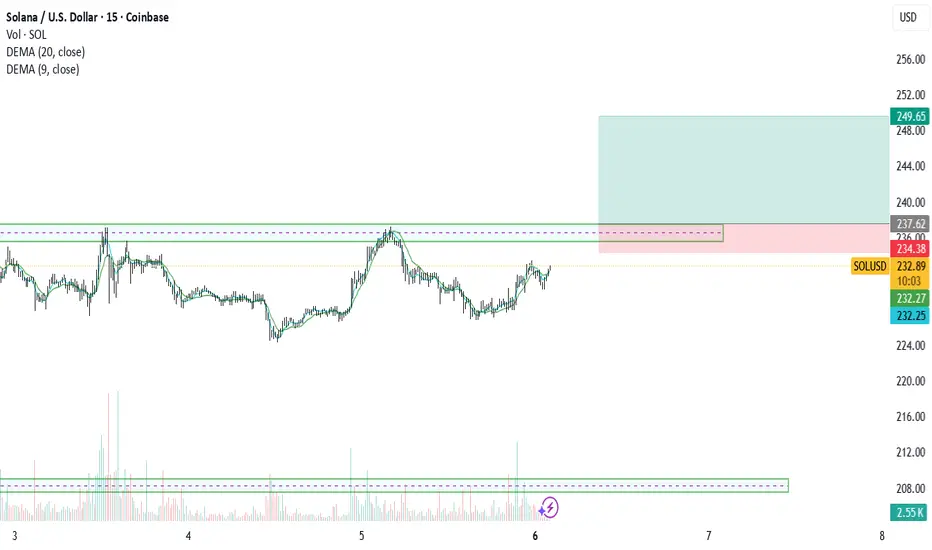
Sol Take Positionas ou see that solana is consolidating at this key level , once the candles break through the green zone , we will take the position and aim for the next point of interest .... have a good week
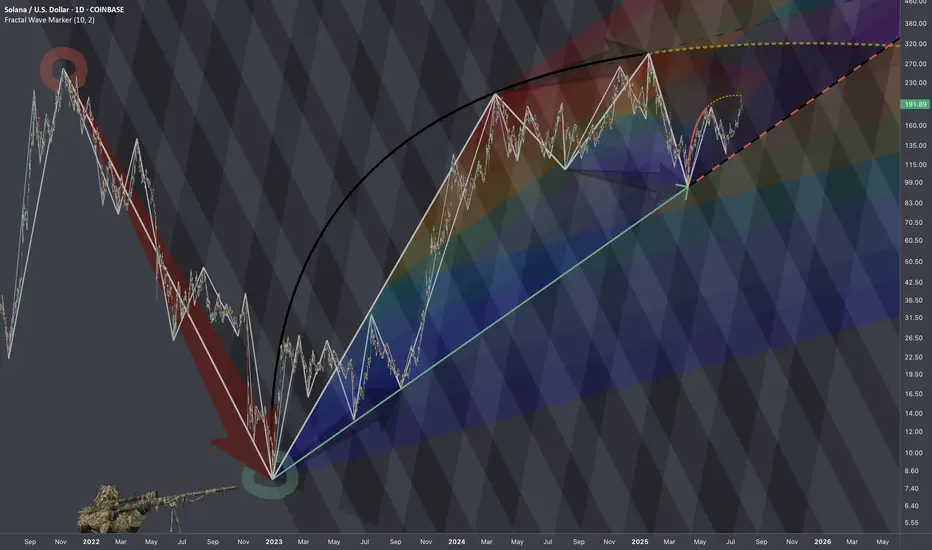
$SOLUSD: Scaling LawsResearch Notes
Progressions here are evident so I'll use the historic bits and organize them into structure that would determine the levels inside dark highlighted zone of the local scope.
If we scale back, it's hard to avoid the massive drop that structurally can serve as reference point.
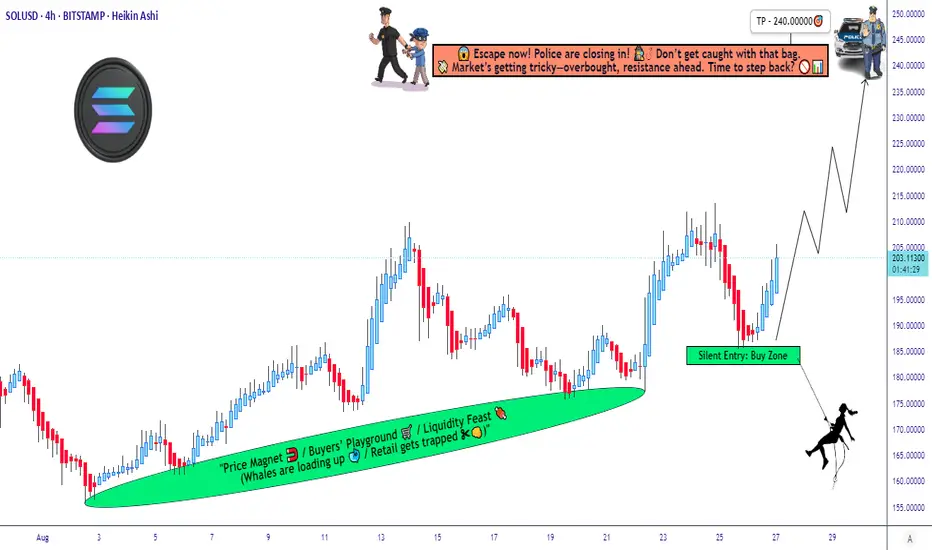
SOL/USD: Bullish Swing Plan w/ Layered Buy Limits & Target🏴☠️ ATTENTION ALL THIEVES & ROBBERS! 🏴☠️
Asset: SOL/USD "Solana vs U.S Dollar" Crypto Market Heist Plan (Swing / Day Trade)
Plan: Bullish Heist ✅
🎯 THE MASTER PLAN: OPERATION SOLANA BULL RUN
Ladies & Gentlemen of the thieving community! 👔🦹♂️🦹♀️ Based on the Thief Trader's secret technical analysis, the vault door to Solana profits is creaking open! Time to execute the heist!
🚪 ENTRY: LAYER UP & SLIP IN SILENTLY
The Thief is using a multi-layer limit order strategy for this entry! We don't knock down the door, we pick the locks one by one! 🔓
Place your buy limit orders at these levels:
Layer 1: 190.00000
Layer 2: 195.00000
Layer 3: 200.00000
🛠 PRO TIP: You can increase your limit layers based on your own capital! More layers = bigger haul! 💰💰
🛑 STOP LOSS: THE GETAWAY DRIVER'S LOCATION
This is the Thief's SL: @180.00000
Listen up, OG's! 👉 Adjust your final SL based on your own strategy and risk appetite! Don't get caught because you got greedy on the entry! Know your exit route! 🚗💨
🎯 TARGET: ESCAPE BEFORE THE COPS ARRIVE!
The police barricade is forming at @240.00000! 🚨👮♂️
Do NOT get greedy! Grab the stolen money, exit the vehicle, and ESCAPE WITH THE PROFITS before the target! A true thief knows when the job is done! 🏁💰
⚠️ THIEF'S FINAL WARNING & DISCLAIMER
📰 News is an Undercover Cop: It will wreck our plan! Avoid new trades during high-impact news!
🔄 Use Trailing SL: Once in profit, trail your stop to lock it in! Protect the loot!
📉 This is not financial advice. This is a heist plan. You are the thief. Your capital, your risk. I'm just the mastermind.
💖 Enjoyed the plan? SMASH THAT LIKE & BOOST BUTTON! ✅ It helps our crew grow and plan the next big score! 🚀🤝
Stay sharp, thieves! I'll see you on the next heist. 🤑👋
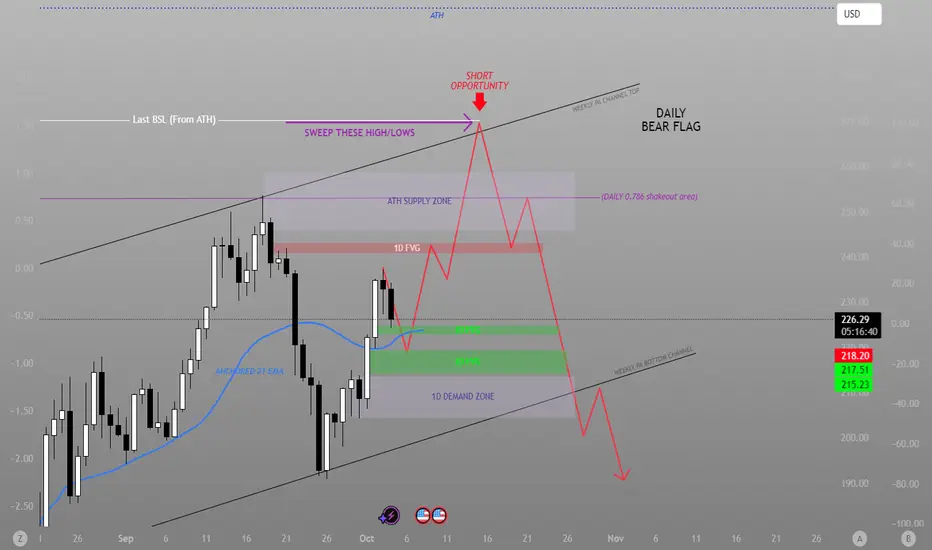
Time for the bears to step in, FINALLY!Overview Context:
Support: $190.00
Resistance: $260.00
Supply Area: $245 to $260
Demand Area: $200 to $215
Psychological Levels: $270 and ATH ($300 Area)
Technical Context:
Technical Structure- We are still residing in our Weekly PA channel that began in April of 2025. With Solana showing strong bullish momentum we see a recipie for a new ATH or a huge reversal at the most prominent price points.
Volume Context:
Volume Insight suggest that a massive amount of liquidity on the Weekly Timeframe is all the way down to the $22 range. While the Daily Timeframe shows a concentration around our Demand Zone.
Extra Confluences (DAILY TF):
FVG -
One bullish Daily FVG located below price. One smaller bearish Daily FVG above price.
Golden Pocket-
The Golden pocket has been met but we see the 0.786 level possibly getting retested.
EMA-
The Daily Timeframe 21 EMA is below price showing storng bullish momentum
RSI-
A bullish signal line crossover is present at the midline to most likely revisit the Overbought region.
MACD-
We are approching a crossover of the midline with extreme bullish momentum. A strong confluence for rally.
Bearish Scenario:
We find ourselves slowly rejecting off of the 50% area of our weekly PA channel and off of the Daily 21EMA. We retrace down to and tap into the Daily FVG located just below price and we get a bounce to the 0.786 level of the ATH to shake retail once more before we change momentum and see a massive reversal as we clear the Supply Zone created by the ATH to sweep the final Buy Side Liquidity pocket and implement a false breakout of our PA channel for a short opportunity.
SOL/USD – Oversold Pullback🟠 Bounce setup near $224
Solana trades at $226, slipping under SMA200 ($230.9) with RSI at 29, signaling oversold. Support sits at $224, resistance near $237 — potential for a short-term relief bounce.
📖 Keywords: #SOLUSD #Solana #CryptoReversal #AltcoinSetup

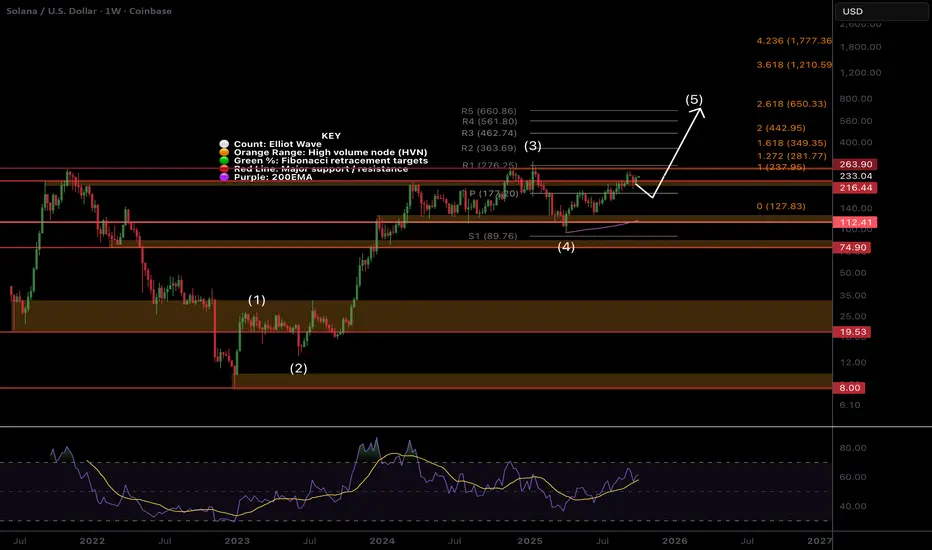
Solana’s Battle With Historic ResistanceAnalysis of SOL/USDT on the daily chart:
🔎 Technical Overview
Current Trend: Solana has rallied strongly from around $120 to $240 but is now facing heavy resistance at the long-term descending trendline (blue line). Price is currently correcting.
50-Day SMA: Located around $142, acting as a key support zone.
Key Resistance: $260–265 (descending trendline + horizontal resistance).
Key Support: $210–212 (horizontal support + close to SMA50 area).
📉 Short-Term Outlook (1–3 weeks)
Bearish case: If price loses $212, a drop toward $185–190 is likely.
Stop Loss: Below $210.
Bullish case / Short-term target: If price stabilizes above $240, next upside target is $260 (retest of trendline).
📈 Long-Term Outlook (3–6 months)
Bullish breakout scenario: A strong breakout above $265 would confirm a trend reversal, opening room for a larger rally.
Long-term targets:
First target: $300
Second target: $350
Stop Loss (long-term): Below $185 (falling back into the previous bearish channel).
✅ Summary:
Short-term: Risk of correction remains; $210 support is crucial.
Long-term: A confirmed breakout above $265 could trigger a new bullish phase with potential toward $300–350.

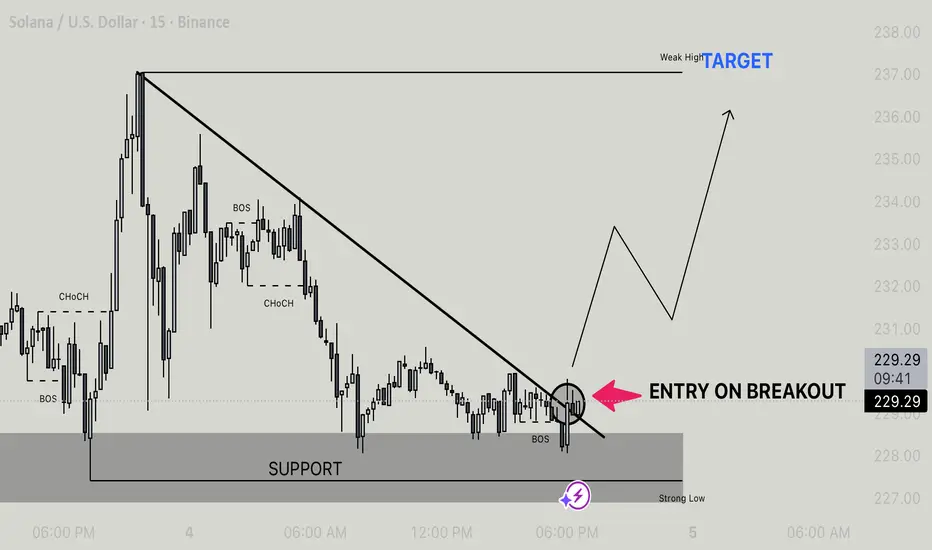
Sol/Usdt - Bullish Breakout Setup From Support Price has been consolidating around the support zone after a strong bearish move. We can observe multiple BOS (Break of Structure) and a clear descending trendline acting as resistance.
• Currently, price is testing the support zone and forming a potential trendline breakout setup.
• Entry confirmation will be on a clean breakout above the descending trendline (marked area).
• Once the breakout occurs, price is expected to retest and then push higher towards the weak high liquidity area, with the next target around 236–238.
Plan:
• Entry: On breakout + retest confirmation.
• Target: 236–238 (weak high).
• Invalidation: A strong break below the support zone would invalidate this bullish setup.
SOLUSD sell at Market PriceHi everyone.
I think we can sell our Solana at this level.
I'll partial exit at first tp that I mentioned, and I think it will has potential to go lower.
Let's see what happens.
Good luck.
Dear traders, please support my ideas with your likes and comments to motivate me to publish more signals and analysis for you.
Best Regards
Navid Nazarian

SOL we keep Pushing 100K so fari'm so happy to annouce that my trade on solana was so successful that i have put my house into it ; and we keep pushing ; let's go hit the 280 dolars and we will never be broke again

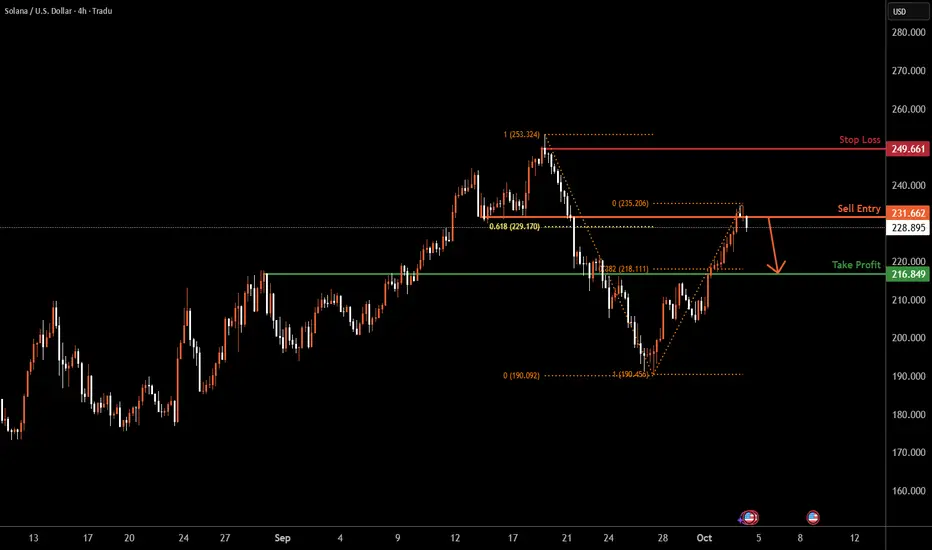
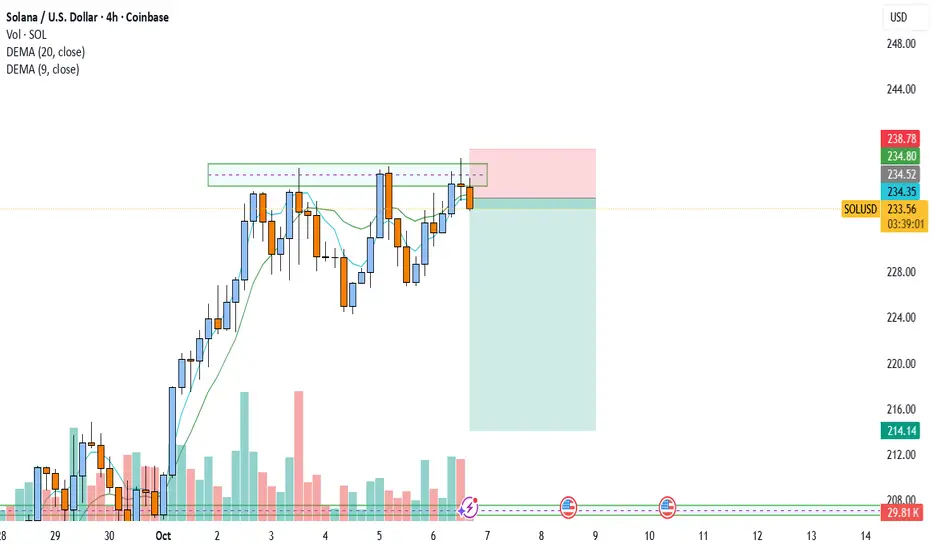
SOLUSD H4 | Bearish Reversal SetupSOL/USD is reacting off the sell entry, which is a pullback resistance that is slightly above the 61.8% Fibonacci retracement and could drop from this levle to the take profit.
Sell entry is at 231.66, which is a pullback resistance that is slightly above the 61.8% Fibonacci retracement.
Stop loss is at 249.66, which is a swing high resistance.
Take profit is at 216.84, which is an overlap support that aligns with the 38.2% Fibonacci retracement.
High Risk Investment Warning
Trading Forex/CFDs on margin carries a high level of risk and may not be suitable for all investors. Leverage can work against you.
Stratos Markets Limited (tradu.com ):
CFDs are complex instruments and come with a high risk of losing money rapidly due to leverage. 65% of retail investor accounts lose money when trading CFDs with this provider. You should consider whether you understand how CFDs work and whether you can afford to take the high risk of losing your money.
Stratos Europe Ltd (tradu.com ):
CFDs are complex instruments and come with a high risk of losing money rapidly due to leverage. 66% of retail investor accounts lose money when trading CFDs with this provider. You should consider whether you understand how CFDs work and whether you can afford to take the high risk of losing your money.
Stratos Global LLC (tradu.com ):
Losses can exceed deposits.
Please be advised that the information presented on TradingView is provided to Tradu (‘Company’, ‘we’) by a third-party provider (‘TFA Global Pte Ltd’). Please be reminded that you are solely responsible for the trading decisions on your account. There is a very high degree of risk involved in trading. Any information and/or content is intended entirely for research, educational and informational purposes only and does not constitute investment or consultation advice or investment strategy. The information is not tailored to the investment needs of any specific person and therefore does not involve a consideration of any of the investment objectives, financial situation or needs of any viewer that may receive it. Kindly also note that past performance is not a reliable indicator of future results. Actual results may differ materially from those anticipated in forward-looking or past performance statements. We assume no liability as to the accuracy or completeness of any of the information and/or content provided herein and the Company cannot be held responsible for any omission, mistake nor for any loss or damage including without limitation to any loss of profit which may arise from reliance on any information supplied by TFA Global Pte Ltd.
The speaker(s) is neither an employee, agent nor representative of Tradu and is therefore acting independently. The opinions given are their own, constitute general market commentary, and do not constitute the opinion or advice of Tradu or any form of personal or investment advice. Tradu neither endorses nor guarantees offerings of third-party speakers, nor is Tradu responsible for the content, veracity or opinions of third-party speakers, presenters or participants.