SOLUSD; Heikin Ashi Trade Idea📈 Hey Traders!
Here’s a fresh outlook from my trading desk. If you’ve been following me for a while, you already know my approach:
🧩 I trade Supply & Demand zones using Heikin Ashi chart on the 4H timeframe.
🧠 I keep it mechanical and clean — no messy charts, no guessing games.
❌ No trendlines, no fixed sessions, no patterns, no indicator overload.
❌ No overanalyzing market structure or imbalances.
❌ No scalping, and no need to be glued to the screen.
✅ I trade exclusively with limit orders, so it’s more of a set-and-forget style.
✅ This means more freedom, less screen time, and a focus on quality setups.
✅ Just a simplified, structured plan and a calm mindset.
💬 Let’s Talk:
💡Do you trade supply & demand too ?
💡What’s your go-to timeframe ?
💡Ever tried Heikin Ashi ?
📩 Got questions about my strategy or setup? Drop them below — ask me anything, I’m here to share.
Let’s grow together and keep it simple. 👊
Trade ideas

Solana Explosion: Will SOL Hit $183 or Crash Below $100?If SOL breaks above 144.77, next stops are 153.65 and possibly 183 on strong momentum.
But dropping below 130 could trigger a sharp slide toward the $100 zone—watch these levels!

SOLUSD Bearish ContinuationSOLUSD is firmly in a daily downtrend after sliding from above 250 to a recent low near 136.23. Price is now hovering around 141.43, consolidating in what looks like a classic bear flag under a fully bearish MA stack (MA20 at 154.14 below MA60 at 186.94 and MA120 at 193.07). With Squeeze Momentum showing a negative “squeeze release,” the backdrop still favors a continuation lower rather than a sustained recovery.
The primary path is simple: a daily close below 136.00 would confirm a breakdown from the flag and open the door toward 132, then 128, with an extended objective near the 120 zone. In that scenario, a reclaim of 144–148 would be the first warning that sellers are losing control, and a sustained move above 155–156 would invalidate the immediate bearish continuation idea and put 170–171 back on the map as a possible squeeze target.
Aggressive bulls only really get a counter-trend setup if SOLUSD can close above 155.00, clearing the declining MA20 and trapping late shorts, with 171 as the next major resistance. Until that happens, failed bounces into 148–155 are more likely to offer opportunities for trend-following shorts than a lasting bottom. This is a study, not financial advice. Manage risk and invalidations.
Thought of the Day 💡
In strong trends, “no trade” is often better than fighting the tape.
-------------------------
Thanks for your support!
If you found this idea helpful or learned something new, drop a like 👍 and leave a comment, I’d love to hear your thoughts!

SOL PRICE-MOVEMENT COINBASE:SOLUSD BINANCE:SOLUSDT BINANCE:SOLUSDC
1) SHORT-TERM PRICE MOVEMENT (Next 6–18 hours)
SOL is currently consolidating after the breakout from the $136–$138 zone. The short-term structure across 15m/1h shows a healthy cooldown phase, not a reversal. Momentum is still positive, OBV is rising, and delta shows seller absorption around $142–$143.
Price is expected to dip into the micro demand zone at $140.2–$141.5, fill remaining liquidity pockets, and then attempt a re-push into the $144.5–$145 range.
As long as $139.8–$140.5 holds, the short-term bias is bullish continuation.
Short-term expectation:
Range → small dip → continuation upward
Immediate upside tag: $144.5 → $145.7
2) MID-TERM PRICE MOVEMENT (1–3 days)
The current market structure on 1H/4H shows a transition from CHoCH to early SMS. When SOL forms this pattern after a deep liquidity sweep, the next wave usually targets the nearest FVG and inefficiency levels.
The next magnets are:
$147.5 (first liquidity pool)
$150.2–$151.3 (major inefficiency fill)
$153.0 (HTF fib cluster + supply touch)
Mid-term bias remains bullish unless the $135 OB is broken.
Mid-term expectation:
$147.5 → $150 → $153 zone in sequence
3) HIGH-TIMEFRAME PRICE MOVEMENT (4–10 days)
The daily falling wedge bottom has been tapped. This wedge historically produces a multi-day bullish expansion once mid-structure flips. The next HTF level — and the one that decides the trend — sits at $156–$160, which matches the top wedge boundary, VPVR high-volume node, and macro resistance.
If SOL clears this region with strong candle bodies, a full HTF trend reversal will occur, opening the way to:
$165–$168 (HTF extension)
$178 (1.618 HTF fib)
If it rejects the $156–$160 range, it will retrace back to $147–$150 before the next attempt.
HTF expectation:
Primary target: $156–$160
Break → $165–$168
Full breakout → $178
LIQUIDATION & LEVERAGE MAP (Kingfisher-style projection)
Below Price
Light clusters at $141.2
Medium shelves at $139.6
Large cluster at $136.8–$137.4
Deep liquidity at $134.5–$135.3
If any bearish wick forms, price will likely stop at the first or second cluster ($140–$139.6). The heavy $135 zone is the “max pain” level and unlikely to be revisited unless Bitcoin breaks structure.
Above Price
Significant liquidation pool at $145.8–$147.5
Heavy cluster at $150.5
Massive build-up at $153.2–$154.4
Final HTF liquidation pocket at $156.5–$158
These will act as magnets during any bullish breakout.
WHALE MAP (CVD & VPVR Projection)
Whale behavior (from your delta charts + VPVR):
Whales accumulated at $136–$138 (clear delta spikes)
Absorption at $141–$143 (sellers trapped)
Minimal whale sell walls until $150–$153
Heavy whale resting liquidity at $156 (profit-taking zone)
Whale map direction:
Upward toward $147 → $153 → $156
TRADE PLAN
Direction: LONG
Entry Zones
Primary pullback entry: $140.2–$141.5
🔥🔥🔥Deep entry (if swept): $138.8–$139.6
🔥🔥🔥Breakout entry: Above $144.6 with retest
🔥🔥🔥Stop Loss
🔥🔥🔥Below $134.90
(Below OB, below liquidity shelves, below structure)
Take Profit
🔥🔥TP1: $147.5
🔥🔥TP2: $150.6
🔥🔥TP3: $153.2
🔥🔥TP4 / Cycle: $156–$160
Risk–Reward
3.1R – 6.2R depending on entry
Management
🔥🔥🔥🔥If price stalls at $147.5 → partial exit
🔥🔥🔥🔥If $150 rejects → expect pullback to $147
🔥🔥🔥🔥🔥If $156 is broken with volume → SOL begins macro reversal
INVALIDATION
🚨🚨🚨🚨🚨🚨🚨The price-movement expectation becomes invalid if:
SOL closes 1H below $134.90
OBV breaks demand-side trend
RSI prints H-Bear divergence on 1H & 4H simultaneously
BTC loses its mid-range and drops below $59k
SOL loses the daily wedge lower boundary (< $128)
COINBASE:SOLUSD COINBASE:SOLUSD COINBASE:SOLUSD
Let me know what you think in the comments — your feedback helps me improve these analyses, and if you found this useful, a like or share would mean a lot.

SOL PRICE-MOVEMENT
1) SHORT-TERM PRICE MOVEMENT (Next 6–18 hours)
SOL is currently consolidating after the breakout from the $136–$138 zone. The short-term structure across 15m/1h shows a healthy cooldown phase, not a reversal. Momentum is still positive, OBV is rising, and delta shows seller absorption around $142–$143.
Price is expected to dip into the micro demand zone at $140.2–$141.5, fill remaining liquidity pockets, and then attempt a re-push into the $144.5–$145 range.
As long as $139.8–$140.5 holds, the short-term bias is bullish continuation.
Short-term expectation:
Range → small dip → continuation upward
Immediate upside tag: $144.5 → $145.7
2) MID-TERM PRICE MOVEMENT (1–3 days)
The current market structure on 1H/4H shows a transition from CHoCH to early SMS. When SOL forms this pattern after a deep liquidity sweep, the next wave usually targets the nearest FVG and inefficiency levels.
The next magnets are:
$147.5 (first liquidity pool)
$150.2–$151.3 (major inefficiency fill)
$153.0 (HTF fib cluster + supply touch)
Mid-term bias remains bullish unless the $135 OB is broken.
Mid-term expectation:
$147.5 → $150 → $153 zone in sequence
3) HIGH-TIMEFRAME PRICE MOVEMENT (4–10 days)
The daily falling wedge bottom has been tapped. This wedge historically produces a multi-day bullish expansion once mid-structure flips. The next HTF level — and the one that decides the trend — sits at $156–$160, which matches the top wedge boundary, VPVR high-volume node, and macro resistance.
If SOL clears this region with strong candle bodies, a full HTF trend reversal will occur, opening the way to:
$165–$168 (HTF extension)
$178 (1.618 HTF fib)
If it rejects the $156–$160 range, it will retrace back to $147–$150 before the next attempt.
HTF expectation:
Primary target: $156–$160
Break → $165–$168
Full breakout → $178
LIQUIDATION & LEVERAGE MAP (Kingfisher-style projection)
Below Price
Light clusters at $141.2
Medium shelves at $139.6
Large cluster at $136.8–$137.4
Deep liquidity at $134.5–$135.3
If any bearish wick forms, price will likely stop at the first or second cluster ($140–$139.6). The heavy $135 zone is the “max pain” level and unlikely to be revisited unless Bitcoin breaks structure.
Above Price
Significant liquidation pool at $145.8–$147.5
Heavy cluster at $150.5
Massive build-up at $153.2–$154.4
Final HTF liquidation pocket at $156.5–$158
These will act as magnets during any bullish breakout.
WHALE MAP (CVD & VPVR Projection)
Whale behavior (from your delta charts + VPVR):
Whales accumulated at $136–$138 (clear delta spikes)
Absorption at $141–$143 (sellers trapped)
Minimal whale sell walls until $150–$153
Heavy whale resting liquidity at $156 (profit-taking zone)
Whale map direction:
Upward toward $147 → $153 → $156
TRADE PLAN
Direction: LONG
Entry Zones
Primary pullback entry: $140.2–$141.5
🔥🔥🔥Deep entry (if swept): $138.8–$139.6
🔥🔥🔥Breakout entry: Above $144.6 with retest
🔥🔥🔥Stop Loss
🔥🔥🔥Below $134.90
(Below OB, below liquidity shelves, below structure)
Take Profit
🔥🔥TP1: $147.5
🔥🔥TP2: $150.6
🔥🔥TP3: $153.2
🔥🔥TP4 / Cycle: $156–$160
Risk–Reward
3.1R – 6.2R depending on entry
Management
🔥🔥🔥🔥If price stalls at $147.5 → partial exit
🔥🔥🔥🔥If $150 rejects → expect pullback to $147
🔥🔥🔥🔥🔥If $156 is broken with volume → SOL begins macro reversal
INVALIDATION
🚨🚨🚨🚨🚨🚨🚨The price-movement expectation becomes invalid if:
SOL closes 1H below $134.90
OBV breaks demand-side trend
RSI prints H-Bear divergence on 1H & 4H simultaneously
BTC loses its mid-range and drops below $59k
SOL loses the daily wedge lower boundary (< $128)
Let me know what you think in the comments — your feedback helps me improve these analyses, and if you found this useful, a like or share would mean a lot.

You can't ignore a double top, a double bottom and falling wedgeThose are the three important things you just can not ignore!
People start going long from the last bottom hit (see lower chart) - I think they know what's coming for us. 130$ shows strength!

SOL is Oversold (-1.3 Z-Score). Time to Buy? (Quant Analysis)Solana has been in a relentless downtrend, but my Quant Master system is finally flashing signs of seller exhaustion.
What the Algo sees:
The Trend is still Bearish: The candles are Red. Price is below the Supertrend and below the institutional VWAP anchor. The trend is down, do not fight the current.
The "TP" Signal (Bottom Right): Notice the small Purple Triangle that just printed at the lows ($130 region).
This signals that Price has deviated significantly from the mean.
Historically (look at the chart left), these TP signals mark local bottoms where shorts should cover.
The Data:
Z-Score: -1.3 (Approaching the -2.0 "Bounce Zone").
Market Weather: Trending (Green Label) but deep in bearish territory.
My Game Plan:
The "TP" tells me to stop shorting, but the "Red Candles" tell me it is too early to buy. I am waiting for the Z-Score to hit -2.0 OR for a confirmed Blue Candle close above $142 to confirm the reversal.
Until then, patience pays.

Bull Bear SolanaIn my personal view Solana is the best project on the DEFI Tokenazation of Real assets Gaming NFT.
Solana best leverage against Sui first is that Sui is not faster or more saclable and the SUI zkLogin is a hge wealness for any web 3 projects. You dont want the possibility to open your safe box i n a Bank with your facebook password!!!
Solana aproach on DEFI is the aproach that undestand that web 3 is all about your keys your assets and makes evything around that.
Meaning there is not a Solana Killler as nver was an ETH killer.
You cant be slow, its not secure to be slow as wel the other security issue is Your assets your Keys mainly along with the number of transactions as well of the volume that make more liquidity and decentralize the network.
Regarding TA
If a Bear Mkt will be Best $75 cousld be a fair Traget. $50 also has odds.
If the Bull Continuation theres a Big Cup and Handle so yu can figure the traget of that.
But why shouldnt Solana make 20,000% to 50,000% from the $8 price if now Solana poupuse is more clear an sread know, to Institutions that are on the game as well of US Gov (Crypto ZAr on wWhite House)?

KRAKEN SHOWS SOLANA $ 511.80🔥 Solana to $500? Here’s What Would Have to Happen (SOL/USD Technical Breakdown)
In today’s video, we break down the real path Solana would need to take to even approach the $500 level — including key price zones, market structure shifts, liquidity pockets, and the macro catalysts that could fuel (or kill) the move.
This isn’t hopium — it’s technical analysis. We’re looking at:
🟩 Higher-timeframe structure (weekly + daily)
🟦 Critical supply zones that must break
🔶 Liquidity gaps + last untouched inefficiencies
🟥 Invalidations that would destroy the $500 thesis
📊 Market conditions needed to sustain a parabolic leg
Whether you’re holding SOL, trading SOL/USD, or just watching the ecosystem evolve, this breakdown gives you a clear, level-headed roadmap of what a $500 Solana actually means — and what the charts are saying right now.
If Solana ever hits $500, it won’t be by accident. Let’s map out the levels, catalysts, and traps along the way.

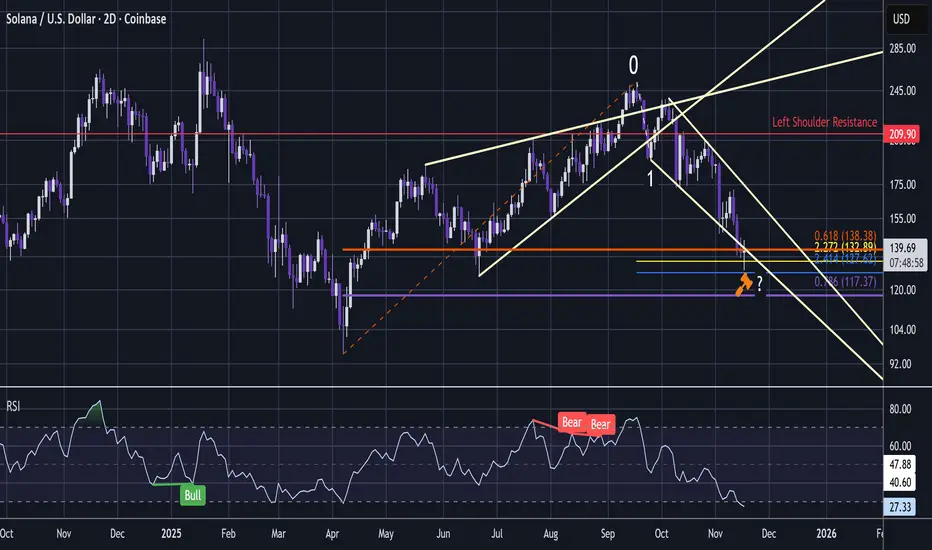
SOL - Advanced Dip Buy AnalysisBears everywhere but the question is - can they really read a chart 🤨?
Anyhow - various altcoins now printing positive candles from positions of ratio balance.
Notice that SOL is hitting a "Harmony Confluence Zone" (as I call it = multiple confluences within a small price band) here bouncing within a double Golden Window:
The bullish hammer candle has quickly whipsawed to reach the 2.272 extension Golden Window (one of my favourites) - taking the 0 and 1 pivots of the downtrend.
And that is within a higher time frame retracement Golden Window (0.618 - 0.786) taking the low to the high of the April uptrend as pivots.
The RSI is oversold - down at 27.
It is the first time it has been oversold since the June 2023 lows. And that was in accumulation before the bull market:
In addition it has slumped to fall through a descending wedge. Its quite steep but descending wedges tend to be a bullish clue and this trending below the trendline may prove to be a liquidity shakeout below the wedge which may later recover to the upside.
All of these combined events signal that there is plenty of bullish confluence and this may be prime dip buy territory right here.
For price action confirmation - the day candle should close bullish - so a doji wouldn't really be enough, a hammer would be better - let's see 🧐.
This analysis is shared for educational purposes only and does not constitute financial advice. Please conduct your own research before making any trading decisions.
SOLA short trade (learning to read the charts). Advices welcomeMy graphs are for learning only, I have a long way to go but I will follow my gut with what I learned.
If there is a big mistake or something i missed please let me know :).

SOL USDHI GUYS,
Whenever i post Btc usd , i also trade a few alt coins like DOGE USD,
ADA USD,
SOL USD
I expect sells on candle close a few minutes from now.
NOTE. These pairs respect and follow BTC.

Global Interest Rate Trends (Fed, ECB, BOJ, BOE)1. Why interest-rates matter
A central bank’s policy (or “policy rate”, the rate at which it lends to or charges on banks) is one of the most important levers in its monetary-policy toolkit. By raising interest rates, a central bank can make borrowing more expensive, slow spending, dampen demand and thus help reduce inflation. By lowering rates, it can stimulate borrowing, spending and investment — supporting growth when the economy is weak.
Because economies are open and interlinked, the interest-rate decisions of one major central bank can ripple through global financial markets via currency, capital‐flows, trade, investment and inflation expectations.
Given the inflation surge in many economies during 2021-23 (linked to supply-chain disruptions, pandemic responses, energy-price shocks, etc.) many central banks shifted gears sharply. Let’s examine what happened region by region.
2. The U.S. – Fed
What happened
The Fed’s main policy mechanism is the federal funds rate (overnight rate banks charge one another).
In response to rising inflation, the Fed embarked on a large rate-hiking cycle during 2022 and early 2023. For example: the target rose to around 4.25-4.50% in December 2022.
More recently (2024-25) the Fed has begun to move into a more cautious stance: holding rates steady, signalling possible cuts, and factoring in weaker labour markets and inflation which is easing.
Why
High inflation meant the Fed needed to tighten policy: raising rates reduces demand and helps bring inflation back toward target.
But raising rates has costs: increased borrowing costs, pressure on consumers and firms, risk of economic slowdown. The Fed must balance inflation control with growth and employment (its dual mandate).
Because inflation has declined from its peaks, and growth has shown signs of moderation, the Fed is increasingly considering when (and how fast) to ease rates rather than only focusing on further hikes.
Implications
The U.S. rate path matters globally: when the Fed raises rates, it raises global funding costs and strengthens the dollar, which can hurt emerging markets or trade partners.
Markets now watch closely for Fed signals on cuts, because a transition from hiking to easing is meaningful for all asset classes (bonds, equities, currencies).
As of late-2025 the Fed’s policy rate is around 4.00%.
3. The Euro-area – ECB
What happened
The ECB’s policy rate (e.g., deposit facility rate) peaked after the inflation surge (in 2023) and then began to be trimmed. For example, one report says the ECB initiated rate cuts in June 2024 after holding rates steady for some time.
As of 2025 the ECB’s rate is about 2.15% (per one data table) though that may slightly lag current decisions.
Why
The Euro-zone economy has been weaker relative to the U.S., with inflation pressures starting to ease and growth concerns creeping in (including from the war in Ukraine, energy shocks, supply disruptions) – so the ECB had both inflation to worry about and growth softness.
Once inflation began to come down, the ECB felt able to begin easing earlier than some peers. However, it emphasised that rates would remain “sufficiently restrictive” for as long as needed.
Implications
Because the ECB began cuts ahead of some other major central banks (e.g., the Fed) it has driven a divergence in interest-rate policy between Europe and the U.S.
That divergence has implications for the euro-dollar exchange rate, export competitiveness in Europe, and how capital flows respond to the relative attractiveness of the euro-zone vs. the U.S.
Lower rates in the euro-zone can help support growth and relieve borrowing costs, but if the divergence becomes too large it could put pressure on the euro and import inflation.
4. The United Kingdom – BoE
What happened
The BoE’s Bank Rate famously rose during the inflation wave; for example, the Bank Rate reached 5.25% around August 2023.
More recently the rate has been brought down somewhat — for instance, it was cut to around 4.00% by November 2025.
Why
The UK experienced high inflation in the post-pandemic period, driven by energy/commodity shocks, supply constraints, labour constraints etc. So the BoE tightened aggressively.
As inflation began to moderate and growth concerns grew (especially with the UK’s unique mix of domestic and external shocks), the BoE shifted toward modest rate cuts or rate holds — trying to tread a fine line between inflation control and growth support.
Implications
The UK being a smaller, open economy relative to the U.S. means that rate decisions can influence the pound, capital flows (especially into London financial markets), and how UK growth holds up in a global slowdown.
For borrowers in the UK (mortgages, consumer debt) the cost of borrowing tends to follow Bank Rate closely, so higher rates have had visible impacts on households and firms.
The BoE’s choices also take into account not only inflation but also the strength of domestic sectors (financial services, housing, exports), the currency, and global spill-overs.
5. Japan – BoJ
What happened
For many years Japan had ultra-low to negative interest rates, as the BoJ battled deflation and weak growth.
In March 2024, the BoJ ended its negative interest-rate policy (NIRP) and raised its overnight rate from around -0.1% to 0-0.1% (its first rate hike in 17 years).
This marks a shift toward “normalising” policy (though rates remain very low compared to other advanced economies).
Why
Japan’s economy had long struggled with deflation or very low inflation, so the BoJ kept policy ultra-accommodative for a long time.
With inflation rising globally and domestically, and the yen weakening significantly, the BoJ signalled a move to exit the ultra-low/negative rate regime.
But Japan still faces structural challenges: high public debt, demographic headwinds, modest growth, which means the BoJ remains cautious.
Implications
Japan’s policy shift matters globally because Japanese investors and financial institutions are major players in global capital markets; changes in Japanese rates/currency affect cross-border flows.
A “last major central bank” to normalise means the phase of ultralow or negative rates worldwide is ending — which has implications for bond yields, global risk premiums, and asset valuations.
For Japan’s economy, the move suggests the BoJ is increasingly confident about inflation reaching target, but any further hikes will depend on sustained domestic wage/inflation momentum.
6. The overall trend & divergence
Broad trend
Following the inflation shock of 2021-22, most major central banks moved into tightening mode: raising policy rates aggressively.
With inflation now easing (though unevenly) and growth risks increasing (especially in Europe and Japan), many central banks are either pausing on hikes or beginning to ease (cut rates).
However, the timing, pace, and magnitude of both tightening and easing differ significantly among the major central banks, creating policy divergence.
Divergence: Why it matters
When one major central bank cuts while another holds or hikes, it affects relative interest-rates, which influence currency values, international capital flows, and trade competitiveness.
For example: the ECB started cutting while the Fed held rates higher for longer — meaning euro-zone borrowing costs fell relative to the U.S., impacting bond yields, equity valuations, and currency markets.
Divergence also complicates global financial conditions: for borrowers, savers, and investors across borders, the landscape becomes more complex.
Risks
Inflation rebound risk: If a central bank cuts too early, inflation might rebound, forcing another hiking cycle — which hurts credibility and causes turbulence.
Growth slowdown risk: If rates remain high too long, growth could falter or a recession could arrive. Central banks are balancing this carefully.
Spill-overs and coordination: Because global markets are integrated, policy decisions in one region spill into others (via currencies, capital flows, commodity prices). For example, U.S. policy is often referenced by other central banks.
7. What this means for you (and for India/global economy)
For borrowers (businesses, households) higher policy rates mean higher interest costs for loans/mortgages; if rates begin to fall, borrowing becomes cheaper.
For savers/investors: higher rates typically make saving more attractive (though other factors like inflation matter), and bond yields rise; lower rates reduce yields and push investors toward riskier assets.
For emerging markets (including India): the global interest-rate environment matters a lot. If the Fed is high or hiking, capital tends to flow to the U.S., currencies of emerging markets can weaken, cost of external borrowing rises. If global rates ease, that can ease conditions for emerging markets.
In trade and currency: if your country’s interest rates diverge from those of major economies, it can affect exports/imports, exchange rates, inflation (via import costs) and competitiveness.
For inflation and growth in your country: since global commodity/energy prices, supply chains, and global demand all influence domestic inflation and growth, central-bank policy abroad matters to you indirectly.
8. Summary & takeaway
In short:
After the pandemic, global inflation surged; central banks responded by raising policy rates.
The U.S. Fed raised quickly and to relatively high levels; the ECB and BoE also raised but faced additional growth/headwind concerns. Japan stayed ultra-low for much longer.
Now (2024/25) many central banks are shifting toward pausing or cutting rates as inflation eases and growth slows — but the timing and extent differ across countries.
These differences (divergences) matter globally: they affect currencies, capital flows, trade and financial markets.
For individuals, businesses and policymakers, keeping an eye on these major central-bank paths helps anticipate borrowing costs, investment yields, exchange‐rate risks and macroeconomic conditions.

SOL/USD Spot Long! 11-17-2025 RSI way Oversold with Bullish Divergences on Multiple Timeframes!
Fibonacci Golden Pockets!
Potential for High Profits!
Enter at Own Risk!
Killer Whale Warning!
Extreme Volatility!

$SOLANA ABC to 47 to 37 SOLANA Analysis Weekly elliott wave ABC
Abc pattern A wave done b bounce now started C wave target to 47 37

SOLUSD Bullish Bat Pattern Thesis – 4H & DailyI'm monitoring SOL for a potential bullish Bat harmonic reversal pattern developing on both the 4H and Daily timeframes. The Bat pattern is a high-probability harmonic formation that can signal trend exhaustion and a reversal, especially when confirmed at the D leg, which typically completes between the 0.886–0.9 retracement of the X-A move.
4H Chart
Structure: The price is currently correcting after a local top, with recent lower lows forming potential A, B, and C legs in sequence.
Key Bat Levels:
X-A: Local swing high to low, establishing the pattern's root.
A-B: Retrace to ~0.382–0.5 of X-A.
B-C: Moves higher, ideally hitting around 0.382–0.886 of A-B.
C-D: Final leg down, targeting the 0.886 retracement of the X-A origin.
Criteria:
Watch for a bullish reaction in price and supporting indicators (volume spike, bullish candle formation, positive divergence) at/near the 0.886 retracement.
Confirmation from order flow or divergence indicators adds confluence.
Daily Chart (D)
Pattern Fractal: The Daily shows a broader corrective move that could echo the 4H pattern, with a larger-scale Bat formation possibly in play.
Entry/Trigger Level: The ideal buy zone is at or just below 0.886 of the key X-A swing.
Risk Controls: Set stop losses slightly below X to minimize risk if the harmonic invalidates.
Targets:
Initial: Return to point C (~0.5–0.618 retracement of A–D)
Ultimate: Approach point A swing high for full pattern completion.
Thesis & Market Context
SOL remains structurally bullish on higher timeframes despite the local correction.
Bat completions often coincide with liquidity sweeps and value zones, strengthening the reversal thesis.
If D completes as drawn, expect a rapid reaction as short liquidation and fresh bids enter the market.

SOL/USDNasty H&S.
My guess, another bull trap on Solana up to $180ish, then vertically down to ~$10.
Thinking market is too much fear presently. We need to go back to complacency, which we should achieve by another record high on SPX this week...

$SOL is still in a heavy downtrend toward the lower targetsCRYPTOCAP:SOL is still in a heavy downtrend toward the lower targets that I mentioned in my previous analysis.
126 and 95 are the next targets.

Falling wedges: Are you convinced now about what's to come?Yes, we are still in a downtrend, but this is not the first time this happens. Maybe this chart will convince you why.
The upcoming two weeks will become very important on what's next for COINBASE:SOLUSD : will a breakout occur on this last falling wedge just like previous times?
I think it will.

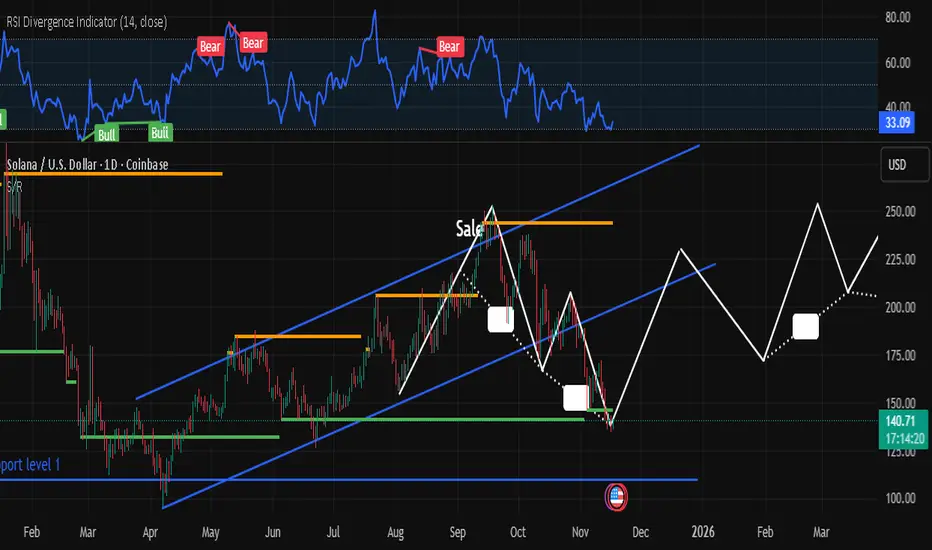
Solana – Daily Chart AnalysisSolana is currently holding around $140 after a sharp correction from the upper channel resistance. Price is testing a key ascending trendline and horizontal support zone near $135.
📉 RSI at 32.76 signals oversold conditions, watch for potential bullish reversal setups.
🔮 Possible Path Ahead (White Projection):
• Bounce to $180 → Consolidation
• Breakout toward $240
• Target zone: $280–$300 by mid-2026
(based on channel re-entry and momentum recovery)
❗If support fails, next major demand zone sits around $100–$110.
📊 Watching closely for confirmation of trend reversal.
Systematic Risk Explained in the Global Market1. What Is Systematic Risk?
Systematic risk refers to the risk that is inherent to the entire market or financial system. It reflects the vulnerability of the global economy to macro-level events that investors cannot avoid. It affects:
Stock markets
Bond markets
Currency markets
Commodity markets
Real estate markets
No matter how diversified a portfolio is, systematic risk will still influence the overall value because it impacts all components of the financial system.
Systematic risk is often represented mathematically through beta (β), a metric that shows an asset’s sensitivity to market movements. A beta above 1 means the asset is more volatile than the market, while a beta below 1 means it is less volatile.
2. Sources of Systematic Risk in the Global Market
a. Economic Cycles
The global economy moves in cycles: expansion, peak, contraction, and recession. When major economies such as the U.S., China, or the European Union experience slowdown, the effects spread worldwide. Exports decline, capital flows shrink, manufacturing slows, and investor confidence drops. These broad economic cycles cause movements in all markets and are a primary form of systematic risk.
b. Interest Rate Fluctuations
Central banks across the world—especially the U.S. Federal Reserve—play a powerful role in global financial stability. When interest rates rise:
Borrowing becomes expensive
Business expansion slows
Consumer spending reduces
Stock markets often fall
Similarly, lowering interest rates can stimulate markets but may also fuel inflation or asset bubbles. Because interest rates influence global capital flows, they are a major generator of systematic risk.
c. Inflation and Deflation
High global inflation reduces purchasing power, increases input costs for companies, weakens consumer spending, and raises interest rates. It affects:
Corporate profits
Bond yields
Commodity prices
Exchange rates
Deflation, though less common, can be equally dangerous, as it leads to falling prices, reduced business revenues, and prolonged recessions.
d. Geopolitical Tensions
In a highly interconnected world, geopolitical risks have immediate and widespread effects. Examples include:
Wars and military conflicts
Trade wars
Diplomatic breakdowns
Cyberattacks on national infrastructure
These events can disrupt energy supplies, manufacturing hubs, commodity routes, and global investor sentiment.
e. Currency Risk
Currency fluctuations affect international trade, corporate earnings, and global investments. When a major currency like the U.S. dollar strengthens:
Emerging markets face capital outflows
Dollar-denominated debt becomes more expensive
Commodity prices fall (as most are priced in USD)
Currency instability is a core component of systematic risk.
f. Global Pandemics and Natural Disasters
Events like the COVID-19 pandemic demonstrated how quickly the global financial system can be disrupted. Lockdowns halted manufacturing, slowed trade, reduced demand for oil, and triggered a worldwide recession. Natural disasters such as earthquakes, floods, and climate disasters also create global economic ripple effects.
g. Technological Change
Rapid innovation brings both opportunity and risk. Automation, AI, cybersecurity threats, and digital currency transitions can destabilize industries and markets. While this risk is often overlooked, technological disruption can create large-scale economic shifts.
3. Why Systematic Risk Cannot Be Eliminated Through Diversification
Investors commonly use diversification to reduce exposure to individual company or sector risk. However, systematic risk affects all sectors at the same time. During a global recession or major geopolitical conflict, even well-diversified portfolios tend to decline.
For example:
In 2008, during the global financial crisis, almost all equity markets crashed.
In 2020, during the pandemic, global markets fell simultaneously.
Oil shocks, interest rate hikes, and currency crises affect entire asset classes.
The only way to manage systematic risk is through hedging, asset allocation, and risk management techniques, not through simple diversification.
4. Measuring Systematic Risk
a. Beta (β)
Beta measures how responsive an asset is to market swings. A beta of 1 means the asset moves with the market. Higher than 1 indicates greater sensitivity.
b. Value at Risk (VaR)
VaR estimates how much an investment might lose during normal market conditions.
c. Stress Testing
Financial institutions simulate worst-case scenarios—interest rate spikes, geopolitical events, currency crashes—to assess vulnerabilities.
d. Global Risk Indexes
Indexes such as the VIX (volatility index) provide insight into market-wide fear or uncertainty.
5. Examples of Systematic Risk Events in Global Markets
a. The 2008 Global Financial Crisis
Triggered by U.S. mortgage defaults, it spread globally, collapsing banks, stock markets, and entire economies.
b. COVID-19 Pandemic (2020)
Markets worldwide plunged as economic activity halted.
c. Russia–Ukraine War (2022–present)
Caused spikes in oil, gas, wheat, and metal prices, impacting inflation worldwide.
d. U.S.–China Trade War
Tariffs on hundreds of billions of dollars in goods disrupted global supply chains.
These events show how interconnected the world is—and how quickly systemic risk spreads.
6. Managing Systematic Risk
While it cannot be eliminated, investors and institutions use strategies to reduce exposure:
a. Hedging
Using options, futures, or inverse ETFs to protect portfolios.
b. Asset Allocation
Balancing between equities, bonds, gold, cash, and real estate to reduce volatility.
c. Geographic Diversification
Investing across multiple countries to limit exposure to any single region.
d. Investing in Low-Beta Assets
Such as defensive sectors—utilities, healthcare, consumer staples.
e. Risk-Aware Investing
Regular portfolio rebalancing, stress testing, and risk monitoring.
7. Conclusion
Systematic risk is a permanent and unavoidable part of global financial markets. It arises from broad, powerful forces—economic cycles, geopolitical tensions, interest rate movements, inflation, currency fluctuations, natural disasters, and technological disruptions. Because it affects all sectors, industries, and economies simultaneously, diversification alone cannot remove it.
Understanding systematic risk helps investors prepare for market volatility, manage portfolios more effectively, and make informed decisions in a world of growing uncertainty. As global markets become more interconnected, the importance of understanding and managing systematic risk continues to increase, ensuring long-term stability and resilience.
SOLUSD SHORTTERM BUY BIASTook a BUY position and targeting this level 145.46 as my Target Level, SOLUSD is overall bearish, but we should see a consolidation just towards the 146 area, before a possible push downwards...
*TRUST THE SYSTEM*

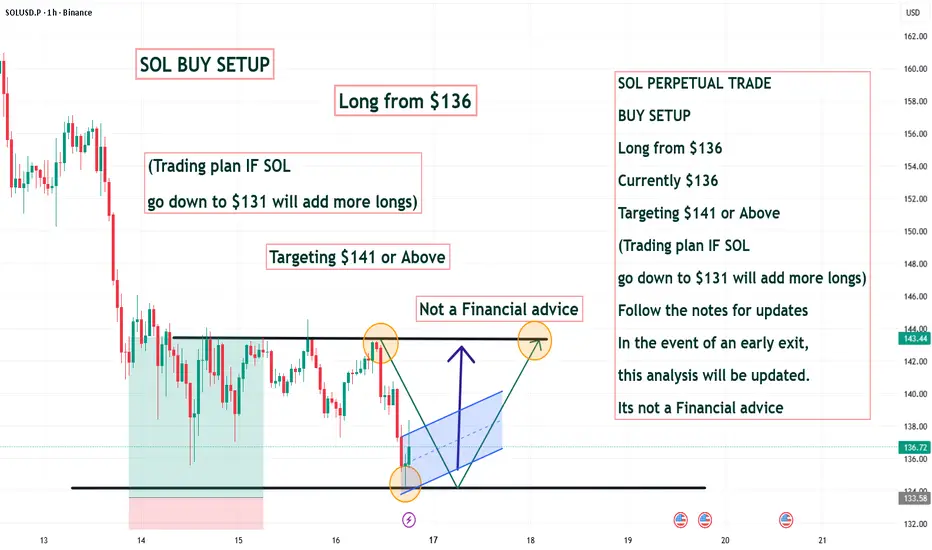
SOL PERPETUAL TRADE BUY SETUP Long from $136SOL PERPETUAL TRADE
BUY SETUP
Long from $136
Currently $136
Targeting $141 or Above
(Trading plan IF SOL
go down to $131 will add more longs)
Follow the notes for updates
In the event of an early exit,
this analysis will be updated.
Its not a Financial advice