SOL/USD – Oversold but Still in Downtrend🔴 Bias: Bearish → Bounce-prone
Price: $139.7
Below SMA200 ($180). RSI ~31 → heavily oversold.
Key Levels
Resistance: $145 → $155
Support: $136 → $130
Read:
SOL is in the same phase as ADA but not as weak. The $136–$130 zone is real support from past liquidity sweeps. Bounce potential is there due to RSI exhaustion, but trend is unquestionably down.
Trade ideas

Recovery? I believe solana is slowly recovering ❤️🩹. I believe we will see solana up at $150 by the end of the week. I've se up a stop loss at $135. If trend fully recovers we'll see it back to $200.
Inside the falling wedge: H&S followed by ascending triangleWe are here looking at the end of a falling wedge, here a H&S (+double top) was formed causing the price to go down and a retest from the long term uptrend line. We bounced from this and can see a ascending triangke there. We have seen that before inside this same wedge. Will we see a breakout occur (market with orange circle) the closer we get to Dec? What else is expected for Dec? The possible end of QT (which is bullish for us)! See my linked idea also.

Solana vs USD – Bearish Playbook High-Probability Swing Setup🔹 Asset: SOL/USD – “SOLANA VS U.S. DOLLAR”
🔹 Trade Style: Crypto Market Opportunity Blueprint (Swing Trade)
🔻 Plan: Bearish Plan
📍 Entry Zone
You can enter at any price level according to your strategy and confirmation signals.
🛑 Stop Loss (SL)
This is Thief SL → @ 152.50
Dear Ladies & Gentleman (Thief OG’s), adjust your SL based on your own strategy & risk levels.
🔔 Important:
Place SL only after breakout confirmation.
I am not recommending to use only my SL. It’s your choice — you make money, you take money at your own risk.
🎯 Target (TP)
Market has strong support + oversold conditions + potential trap zones, so kindly exit with profits.
Our Target → @ 125.00
🔔 Important:
Dear Ladies & Gentleman (Thief OG’s), I am not recommending to use only my TP.
It’s your choice — you make money, you take money at your own risk.
📊 Related Pairs to Watch (Correlation Guide)
1️⃣ BITSTAMP:BTCUSD – Bitcoin
King of crypto; SOL often follows BTC’s direction.
If BTC breaks down, SOL bearish continuation becomes stronger.
2️⃣ BITSTAMP:ETHUSD – Ethereum
High correlation with major altcoins.
ETH weakness usually signals pressure on L1 chains like SOL.
3️⃣ COINBASE:AVAXUSD – Avalanche
Competitor L1 chain; often moves in similar sentiment flow.
If AVAX also shows bearish structure → confirms broad L1 weakness.
4️⃣ COINBASE:LTCUSD – Litecoin
Old major coin; used for risk-on/risk-off sentiment checks.
If LTC dumps → market-wide bearish confirmation.
5️⃣ CRYPTOCAP:TOTAL2 – Altcoin Market Cap
Measures overall altcoin health.
If TOTAL2 breaks its support → SOL likely accelerates toward bearish target.
🔍 Why These Pairs Matter? (Key Correlation Points)
BTC sets the tone – SOL follows the major trend 75–85% of the time.
ETH determines altcoin liquidity – if ETH dominance rises, SOL loses capital flow.
AVAX acts as sector correlation – L1 competitors weaken together during bearish cycles.
TOTAL2 confirms broad alt weakness, making SOL’s downside more reliable.

SOL - Long - 175The Crypto is expected to take support at 120 and 106.
These support may push the coin to 175 levels.

Carbon Credit Secrets: Market Opportunity, Gobal Economic Shift1. What Carbon Credits Actually Represent (The Real Meaning)
A carbon credit is 1 metric ton of CO₂ (or equivalent greenhouse gas) reduced, captured, or avoided.
But the secret is: it’s not just a certificate—it’s a transferable promise of environmental impact.
Industries that produce high emissions (oil, steel, cement, power) must offset their pollution by purchasing these credits from companies that reduce emissions (solar farms, reforestation projects, biogas plants, green tech).
This creates a supply–demand tension, which becomes the heart of the carbon market.
2. The Two Carbon Markets (Most People Don’t Know the Difference)
Carbon credits exist in two major forms, and understanding them is crucial:
(A) Compliance Market (Regulated Market)
Managed by governments.
Mandatory for polluting industries.
Prices are higher because companies have no choice but to buy.
Examples:
EU ETS (European Union Emissions Trading System)
California Cap-and-Trade
China National ETS
This market is worth hundreds of billions of dollars globally.
(B) Voluntary Carbon Market (VCM)
Companies buy credits voluntarily to appear green.
Tech companies, airlines, luxury brands often participate.
Price varies widely (₹200 to ₹2,000 per credit).
The secret here is: the voluntary market is expected to grow 15x–20x in the next decade because nearly every large corporation has signed a "Net Zero by 2050" pledge.
This massive corporate pressure will create explosive demand.
3. How Carbon Credits Are Created (The Hidden Engine Behind Supply)
A carbon credit is not just printed—it must be generated, verified, and issued based on real climate impact.
There are four main sources:
1. Nature-Based Solutions
Reforestation
Mangrove restoration
Soil carbon storage
Avoided deforestation
These projects create long-term, high-quality credits.
2. Renewable Energy
Solar farms
Wind farms
Hydro projects
Earlier common, but now some countries limit renewable credits because it’s becoming the norm.
3. Waste & Methane Reduction
Landfill methane capture
Biogas projects
Improved cookstoves
These are cheap to generate and highly scalable.
4. Technology-Based Solutions
Carbon capture & storage (CCS)
Direct air capture (DAC)
Low-carbon manufacturing
This is the future of premium credits.
4. The Secret Behind Carbon Credit Prices (Why They Vary So Much)
Carbon credit prices depend on:
Project type
Country
Verification body
Demand pressures
Market perception
Co-benefits (biodiversity, community development)
But the biggest secret:
High-quality credits can sell for 5x–20x the price of low-quality credits.
Example:
A basic renewable credit may sell at ₹200–₹500
A genuine rainforest preservation credit can sell at ₹2,000–₹10,000
The market rewards authenticity and long-term climate impact.
5. The Verification Game (Where the Real Power Lies)
Carbon credits are only valuable if verified by third-party bodies:
Verra
Gold Standard
ACR
CAR
GCC
These agencies act like credit rating agencies in financial markets.
Their approval means a project is legitimate.
Secret:
In carbon markets, verification = value.
Without verification, the credit is worthless.
This creates a competitive advantage for projects that follow strict rules.
6. Why Carbon Credits Are Becoming a Trading Market
Carbon credits are now:
Tokenized
Traded on exchanges
Stored on blockchain
Sold in futures & forwards
Bundled into ETFs
This financialisation of carbon credits is transforming them from environmental tools to investable commodities, similar to oil, gold, or energy futures.
Even large financial institutions like JPMorgan, BlackRock, and Standard Chartered are entering the carbon markets.
Hidden secret:
Companies hoard carbon credits today expecting prices to rise sharply in the future.
This creates scarcity.
7. The Global Push That Will Explode Carbon Credit Demand
There are six megatrends driving the carbon boom:
1. Over 5,000 companies have net-zero commitments.
They must buy credits.
2. International aviation (CORSIA) mandates offsetting.
Airlines are huge buyers.
3. Countries are adding carbon taxes.
Businesses pay if they don’t reduce emissions.
4. ESG investing pressures all listed companies.
Investors prefer greener companies.
5. More countries joining Emissions Trading Schemes (ETS).
China, India, Brazil, Middle East expanding systems.
6. Public pressure forces companies to go green.
Brand image depends on carbon neutrality.
Demand will outpace supply, causing prices to rise.
8. India’s Role – The Quiet Giant
India is becoming one of the world’s biggest carbon credit suppliers because of:
Massive renewable energy growth
Agriculture-based carbon projects
Biogas & waste management projects
Reforestation potential
Low project development cost
In 2023, India restarted its voluntary carbon market, and soon a regulated national ETS will launch.
Secret:
India may become the Saudi Arabia of carbon credits
due to its high-volume, low-cost production capability.
9. Carbon Credits as a Trading Opportunity (The Insider View)
Carbon trading is becoming a hot space for:
Hedge funds
Commodity traders
Energy companies
Environmental firms
Retail investors (via funds or platforms)
The real trading profits come from:
1. Forward contracts (pre-purchase deals)
Buying credits early at low price and selling once verified.
2. Vintage trading
Older credits often sell cheaper; traders buy and resell.
3. Quality arbitrage
Spotting underpriced premium credits.
4. Tokenized credits
Blockchain carbon projects allow fractional ownership.
5. Exchange-traded carbon allowances
Like EU ETS futures.
10. The Biggest Secret – Carbon Credits Will Become Scarcer
Global climate goals require:
45% emission reduction by 2030
Net zero by 2050
But current carbon credit supply covers less than 5% of the needed reduction.
This gap is the biggest secret opportunity:
**Carbon credits will get more valuable every year.
Scarcity will drive long-term price appreciation.**
Some experts predict a 500%–1000% rise in premium credit prices within a decade.
11. The Dark Side – Fraud & Low-Quality Credits
Yes, carbon markets have flaws:
Overestimated emission reduction
Fake tree plantations
Double counting
Poor verification standards
Greenwashing by big brands
This is why transparency, digital MRV (monitoring-reporting-verification), and blockchain solutions are becoming essential.
Smart investors focus only on:
Verified
Transparent
High-quality
Long-term
Durable carbon removal credits
Final Takeaway
Carbon credits are not just an environmental tool—they are becoming:
A global commodity
A future trading instrument
A corporate necessity
An economic climate currency
Understanding carbon credits today gives you a powerful advantage in:
Trading
Investing
Business strategy
Sustainability consulting
The biggest secret is simple:
As carbon limits tighten, the value of every real carbon credit will rise sharply.

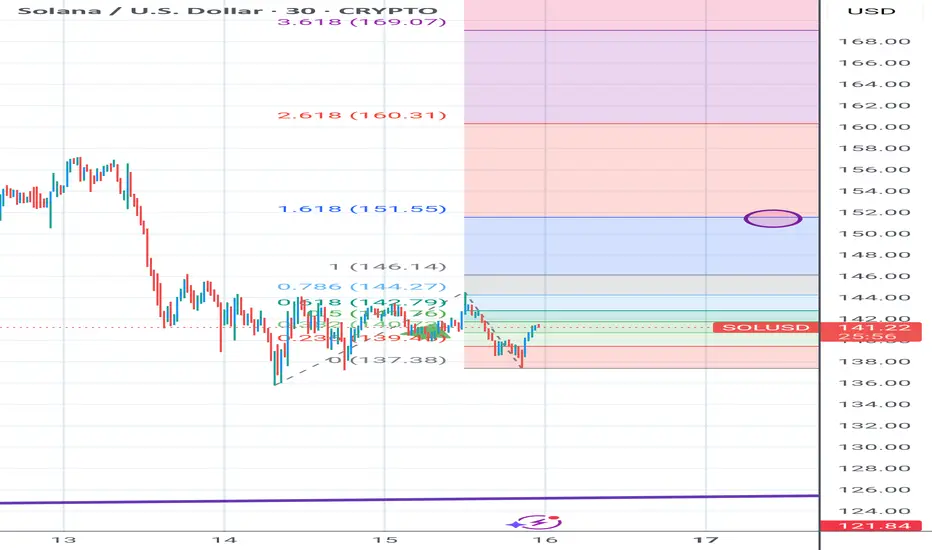
SOLUSD⬆️ Buy Entry: 140.000
⏹️ Stop Loss: 124.00
*️⃣ Take Profit-1: 157.000
*️⃣ Take Profit-2: 170.000

SOLANA GO SHORTBearish Momentum in the Short Term
Price fell below key support levels: SOL slipped under $150, with the next support zones around $142 and $140. A breakdown below $140 could extend losses toward $132 or even $120.
Chart structure shows downtrend: SOL has formed a series of lower highs and lows since early November, confirming bearish momentum, supported by declining On-Balance Volume (OBV) and a Money Flow Index (MFI) below 50.
Technical indicators remain weak: Trading below multiple EMAs (20, 50, 100, 200) indicates sellers are firmly in control
In the immediate term, Solana is more likely to go down ("go short") rather than rebound. The technicals and on-chain flows favor a continuation of the current pullback.

SOL PERPETUAL TRADE BUY SETUP Long from $136SOL PERPETUAL TRADE
BUY SETUP
Long from $136
Currently $136
Targeting $141 or Above
(Trading plan IF SOL
go down to $132 will add more longs)
Follow the notes for updates
In the event of an early exit,
this analysis will be updated.
Its not a Financial advice

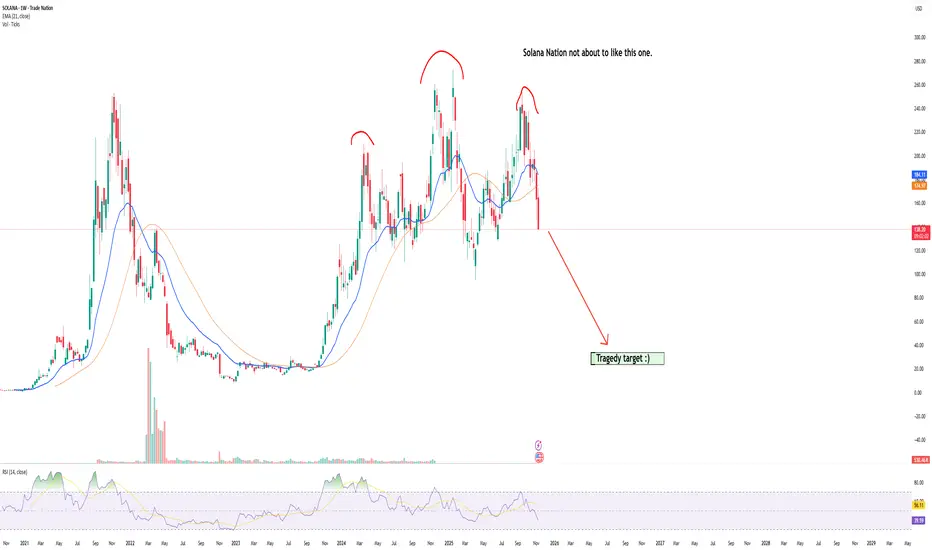
Solana tragedy incomingEvery downfall creates buy oportunities. :) Every tragedy is soil for another flower...
SOL PERPETUAL TRADE BUY SETUP Long from $144SOL PERPETUAL TRADE
BUY SETUP
Long from $144
Currently $144
Targeting $148.80 or Above
(Trading plan IF SOL
go down to $140 will add more longs)
Follow the notes for updates
In the event of an early exit,
this analysis will be updated.
Its not a Financial advice

SOL ReversalTerrrrrible week for Crypto, broadly, but I am watching a potential bullish divergence on the daily RSI for Solana.
This sell-off has been particularly pronounced, but I believe there will be some form of bounce provided this divergence sets tomorrow. If it does I am long with a short horizon, medium leverage, and tight stops.

SOLUSD: Battling Bearish Trend Below Key Zone – – 146-148 Focus📉 SOLUSD: Battling Bearish Trend Below Key Zone – 146-148 Support in Focus!
Timeframe: 4-Hour Chart
Introduction:
Solana (SOLUSD) on the 4-hour chart continues to reflect a prevailing bearish sentiment, currently trading around $153.97. The price is caught in a persistent downtrend, repeatedly failing to establish a sustained recovery above critical resistance levels.
Current Price Action & Trend Analysis:
Solana has been under significant selling pressure since its peak in late October, establishing a clear downtrend visible through a series of lower highs and lower lows. A prominent red descending trendline has consistently acted as dynamic resistance, rejecting multiple attempts by bulls to push higher.
Most recently, SOLUSD attempted a recovery, reaching towards the 160 to 165 'Key Zone', but faced strong rejection from both this zone and the descending trendline around November 10th-11th. This rejection pushed the price back down, and it is currently consolidating below this 160-165 'Key Zone', which now functions as immediate overhead resistance.
The price is now trading precariously above the 146 to 148 support area. This range has seen some bounces, indicating a potential short-term floor, but the overall context of the descending trendline and the inability to reclaim the 160-165 'Key Zone' suggests that bearish pressure remains dominant.
Key Resistance Levels:
Descending Red Trendline: This dynamic trendline is the most immediate and significant barrier. A breakout above this would be crucial for any shift in momentum.
160 to 165 Key Zone: This area has proven to be a strong resistance after previously acting as support. A decisive reclaim of this zone is essential for bulls.
175 Previous Support: What was once a support level now stands as a more formidable resistance, lying above the current trading range and requiring significant bullish strength to overcome.
190 to 195 Key Resistance: This zone represents the origin of the current major downtrend and remains a very strong long-term resistance.
Key Support Levels:
146 to 148: This grey band is the immediate support zone currently being tested. A breakdown below this level would confirm further bearish continuation.
135: Should the 146-148 support fail, the 135 level is identified as the next significant downside target. This represents a critical psychological and technical support, vital for preventing a deeper sell-off.
Bullish Scenario:
For SOLUSD to show any meaningful bullish reversal, it must first break decisively above the descending red trendline and concurrently reclaim the 160 to 165 'Key Zone' with conviction and increased volume. A sustained move above this combination would open the path to challenge the 175 'Previous Support' (now resistance).
Bearish Scenario:
The current technical structure heavily favors continued bearishness. Failure to reclaim the 160 to 165 'Key Zone' and continued rejection from the descending trendline will likely lead to a decisive breakdown below the 146 to 148 support area. A breach of this immediate support would accelerate selling pressure, targeting the 135 level as the next major downside objective.
Conclusion:
Solana is at a critical juncture, struggling within a clear downtrend and facing strong overhead resistance. The immediate battle is centered on the 160-165 'Key Zone' acting as a ceiling and the 146-148 area providing temporary support. Traders should closely watch these levels; a decisive break in either direction will likely dictate Solana's short-term trajectory.
Disclaimer:
The information provided in this chart is for educational and informational purposes only and should not be considered as investment advice. Trading and investing involve substantial risk and are not suitable for every investor. You should carefully consider your financial situation and consult with a financial advisor before making any investment decisions. The creator of this chart does not guarantee any specific outcome or profit and is not responsible for any losses incurred as a result of using this information. Past performance is not indicative of future results. Use this information at your own risk. This chart has been created for my own improvement in Trading and Investment Analysis. Please do your own analysis before any investments.

Solana Cup w/ HandleFor some reason everyone is bearish on SOL right now.
Breakpoint coming up.
Falling Wedge for the handle.
I'll see you at $400 bears.

Solana: Bears are in Full ControlFenzoFx—Solana is up by 3.30% today, after the sharp decline on November 25. The daily candle of this date is a bearish engulfing, meaning the sellers are in control of the $171.70. This level has the highest volume spike level as shown on the chart.
The immediate resistance is at $171.70. From a technical perspective, the downtrend will likely resume if the price holds below this level. In this scenario, the next bearish target could be the sell-side liquidity at $137.60, followed by $126.00.


Solana (SOL/USD) — Potential Bullish Reversal in Play!After a strong sell-off into the key demand zone ($140–$150), Solana is showing early signs of recovery. The green zone has acted as a major support area, with previous price reactions confirming it as a solid buy zone.
If SOL can hold this level and form a solid higher low, we could see a bullish move toward the supply zone ($210–$230) — the red area on the chart.
📈 Technical Outlook:
Support: $140–$150 (Strong Demand Zone)
Resistance: $210–$230 (Supply Zone)
Current Price: $157
Bias: Bullish above $150
Invalidation: Daily close below $140
🔥 What to Watch:
Daily candle close above $160 could signal momentum shift.
Volume confirmation and RSI recovery would add confidence.
Possible “V-shaped recovery” toward the red zone if buyers step in.
💬 Your Turn:
What’s your outlook on Solana?
Do you think SOL will bounce from this support and continue the uptrend, or will bears drag it lower first?
👇 Share your thoughts in the comments and let’s discuss possible trade setups!
#Solana #SOLUSD #Crypto #TradingView #PriceAction #SupportResistance #TechnicalAnalysis #BullishSetup

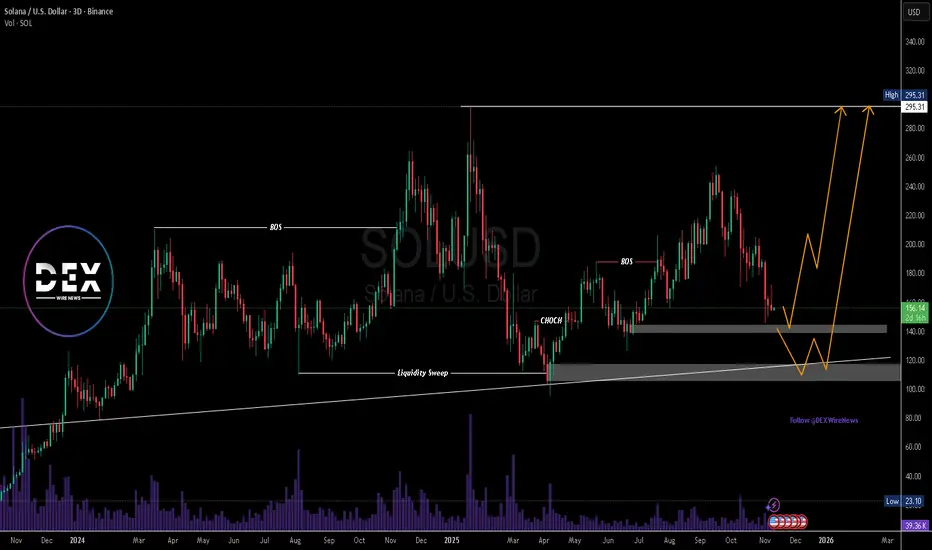
$SOLUSD Eyes Key Demand Zone Before Potential Macro BreakoutSolana (SOL/USD) is approaching a pivotal technical zone that could define its next major move. After an extended corrective leg from the $254 region, the price has retraced toward key demand areas, around $140, and around $120 where prior liquidity sweeps and structural reversals have historically emerged.
The chart reveals a repeating market behavior where Solana establishes a base within strong demand zones before launching decisive bullish impulses. An external structure Break of Structure (BOS) from previous swing highs, followed by an internal Change of Character (CHOCH) confirmation, after a retracement, suggests the broader bullish structure remains intact despite short-term weakness due to macro- economic challenges.
Should price hold the $120 range, a rebound toward the $295 previous highs appears probable. However, if sellers drive price lower, deeper liquidity could be collected near the $115–$120 region, aligning perfectly with the ascending trendline and long-term support base. This would likely create a high-probability accumulation phase before another impulsive leg higher.
Volume trends show healthy market participation during both expansions and pullbacks, reflecting consistent investor interest in Solana’s price action. Fundamentally, Solana’s growing adoption across DeFi, NFTs, and high-performance dApp ecosystems continues to strengthen the bullish bias.
A confirmed reversal from current levels could set the stage for a macro breakout toward the $295 zone, which represents a higher high of the external bullish structure and a psychological milestone for market participants.
In summary, Solana’s technical framework signals that the market is in a late-stage correction within a larger bullish cycle. A clean defense of the $140 zone would reinforce the bullish continuation narrative, while a brief dip into the $115 zone could form the final liquidity trap before another surge toward new highs
Capital Flows Impacted1. Understanding Capital Flows
Capital flows are broadly classified into two categories:
Foreign Direct Investment (FDI):
Long-term investments in physical assets like factories, infrastructure, or real estate. FDI represents stable and sustainable investment because it indicates confidence in the host country’s economy.
Portfolio Investment:
Short-term investment in financial assets like stocks, bonds, or other securities. These flows are more volatile, as investors can quickly withdraw funds based on changes in risk perception or economic conditions.
Other Capital Flows:
These include banking sector flows, loans, and remittances. While remittances are generally stable, banking flows can fluctuate depending on interest rates and credit conditions.
Capital flows contribute to a country’s balance of payments, affect exchange rates, and determine the availability of foreign reserves. They can enhance investment, technology transfer, and job creation, but excessive inflows or sudden outflows can destabilize financial markets.
2. Factors Impacting Capital Flows
Capital flows are influenced by both push factors (conditions in advanced economies) and pull factors (conditions in emerging markets).
a. Global Interest Rates
One of the most powerful influences on capital movement is the difference in interest rates between countries.
When interest rates in advanced economies like the United States rise, investors tend to pull money out of emerging markets to take advantage of higher returns on safer assets such as U.S. Treasury bonds.
Conversely, when global interest rates are low, investors seek higher yields in developing countries, leading to capital inflows.
For example, during the U.S. Federal Reserve’s monetary tightening cycles, emerging markets like India, Brazil, and Indonesia often experience capital outflows and currency depreciation.
b. Inflation and Macroeconomic Stability
High inflation reduces the real return on investments, making a country less attractive for foreign capital. Investors prefer economies with stable prices and predictable policy environments. Macroeconomic instability—such as high fiscal deficits, political turmoil, or weak governance—can trigger capital flight as investors look for safer destinations.
c. Exchange Rate Movements
Exchange rate expectations play a crucial role in capital flow decisions.
If investors expect a currency to appreciate, they increase inflows to benefit from exchange gains.
If depreciation is expected, capital outflows intensify as investors try to avoid losses.
Unstable or artificially managed exchange rates can also discourage long-term investment, as they create uncertainty about future returns.
d. Trade and Investment Policies
Governments that promote open trade, ease of doing business, and investor-friendly policies tend to attract more capital. On the other hand, restrictive trade policies, high tariffs, or uncertain regulatory environments discourage investors.
For example, India’s liberalization reforms in the 1990s led to significant FDI inflows, while policy uncertainty in some developing countries has caused capital to dry up.
e. Geopolitical and Global Uncertainties
War, sanctions, political instability, and diplomatic tensions often lead to abrupt shifts in capital flows. Investors seek safe-haven assets such as gold, the U.S. dollar, or Swiss franc during uncertain times. The Russia-Ukraine war and tensions in the Middle East have both demonstrated how quickly capital can move in response to global crises.
3. How Capital Flows Impact Economies
The impact of capital flows can be both positive and negative, depending on their nature, duration, and management.
a. Positive Impacts
Boost to Investment and Growth:
Inflows of foreign capital provide funds for domestic investment, which can increase productivity, job creation, and infrastructure development.
Technology Transfer and Knowledge Sharing:
FDI often brings advanced technologies, managerial skills, and innovation to the host country, improving competitiveness.
Strengthening of Financial Markets:
Portfolio inflows increase liquidity in stock and bond markets, deepening the financial system and promoting market efficiency.
Improved External Balances:
Stable capital inflows help countries finance current account deficits and build foreign exchange reserves.
b. Negative Impacts
Volatility and Financial Instability:
Short-term capital, especially portfolio flows, can exit the market rapidly, leading to sharp currency depreciation, stock market crashes, and financial crises.
Exchange Rate Appreciation (Dutch Disease):
Excessive capital inflows can cause the local currency to appreciate, making exports less competitive and hurting the manufacturing sector.
Asset Bubbles:
Large inflows can fuel speculative investments in real estate or equities, inflating asset bubbles that may burst later.
Dependency and External Vulnerability:
Over-reliance on foreign capital can make an economy vulnerable to global shocks. Sudden outflows can lead to liquidity crises, as witnessed during the 1997 Asian Financial Crisis.
4. Historical and Contemporary Examples
Asian Financial Crisis (1997–98):
Rapid capital inflows into Southeast Asia fueled credit and asset bubbles. When investor confidence collapsed, massive outflows led to currency crashes and economic recessions.
Global Financial Crisis (2008):
In the wake of the crisis, developed nations lowered interest rates, leading to a surge in capital inflows to emerging markets like India and Brazil. However, these flows reversed when the U.S. signaled policy tightening in 2013, causing the “taper tantrum.”
COVID-19 Pandemic (2020):
The pandemic caused unprecedented global uncertainty, leading to sudden capital outflows from emerging markets. Later, massive liquidity injections by central banks brought capital back, especially into tech and healthcare sectors.
Current Scenario (2023–2025):
Persistent global inflation, high U.S. interest rates, and geopolitical instability have created volatile capital movements. Many emerging markets are witnessing capital outflows due to a strong U.S. dollar and rising global risk aversion.
5. Policy Measures to Manage Capital Flow Impacts
Governments and central banks use various strategies to mitigate the negative effects of volatile capital movements:
Monetary Policy Adjustments:
Central banks can use interest rate changes to stabilize currencies and control inflation, influencing the direction of capital flows.
Foreign Exchange Reserves:
Maintaining adequate reserves helps cushion against sudden outflows and currency volatility.
Capital Controls:
Temporary restrictions on certain types of inflows or outflows can prevent speculative attacks and financial instability.
Macroprudential Regulations:
Strengthening the banking system through regulations reduces the risk of asset bubbles and credit booms fueled by capital inflows.
Fiscal Discipline:
A sound fiscal policy framework reassures investors of a stable economic environment, encouraging long-term investment.
6. Conclusion
Capital flows are a double-edged sword in the global economy. While they promote growth, innovation, and development, their volatility poses challenges to economic stability. Managing capital flows effectively requires a careful balance between openness and prudence.
Countries must design policies that attract long-term, productive investments while shielding their economies from the adverse effects of short-term speculative movements. As globalization deepens, the interdependence of financial markets means that even local policy decisions can have global repercussions. Therefore, maintaining financial stability amid changing global capital dynamics remains one of the most critical tasks for modern policymakers.
In essence, capital flows reflect not just the movement of money but the pulse of global confidence — a signal of how nations are perceived in an interconnected economic world.

SOLANA entered into bearish territory, targeting $105.Solana (SOLUSD) closed last week below its 1W MA50 (blue trend-line) for the first time since July 28 2025. This is an extension of the downtrend that started following the September 15 High, which took place right below the Resistance Zone that started back on the November 2021 Cycle Top.
This is a critical Resistance as it rejected the price another 2 times during this Bull Cycle, with the most recent causing the January - April correction to the 1W MA200 (orange trend-line).
Given the huge 1W RSI Bearish Divergence for almost 2 years now (Lower Highs), we expect last week's closing below the 1W MA50 to initiate the bearish extension towards the 1W MA200 (at least) again. Our Target is $105.00.
---
** Please LIKE 👍, FOLLOW ✅, SHARE 🙌 and COMMENT ✍ if you enjoy this idea! Also share your ideas and charts in the comments section below! This is best way to keep it relevant, support us, keep the content here free and allow the idea to reach as many people as possible. **
---
💸💸💸💸💸💸
👇 👇 👇 👇 👇 👇

Double top after ascending triangle: 163$ will be retestedDouble top occurred at COINBASE:BTCUSD and at $COINBASE:SOLUSD. 163$ will be retested. I think we will see a bounce from there.

SOLUSD⬆️ Buy Range: 156.100 - 153.000
⏹️ Stop Loss: 140.000
*️⃣ Take Profit: 172.800 - 179.000
🔠 Upward movement from medium-term support.

SOLUSD Looking strong selling from key resistance area📉 SOL/USD Technical Update (1H Timeframe)
SOL/USD showing a strong downtrend, with fresh selling pressure emerging from the resistance area around 156.27.
🎯 Technical Targets:
Support 1️⃣: 150.85
Support 2️⃣: 146.60
The momentum remains bearish — watch for potential continuation moves as long as price stays below key resistance levels.
⚠️ Risk Management Reminder:
Always apply proper risk and position management — protect your capital first.
💬 Like • 💡 Comment • 🔁 Share • ✅ Follow for more technical insights
