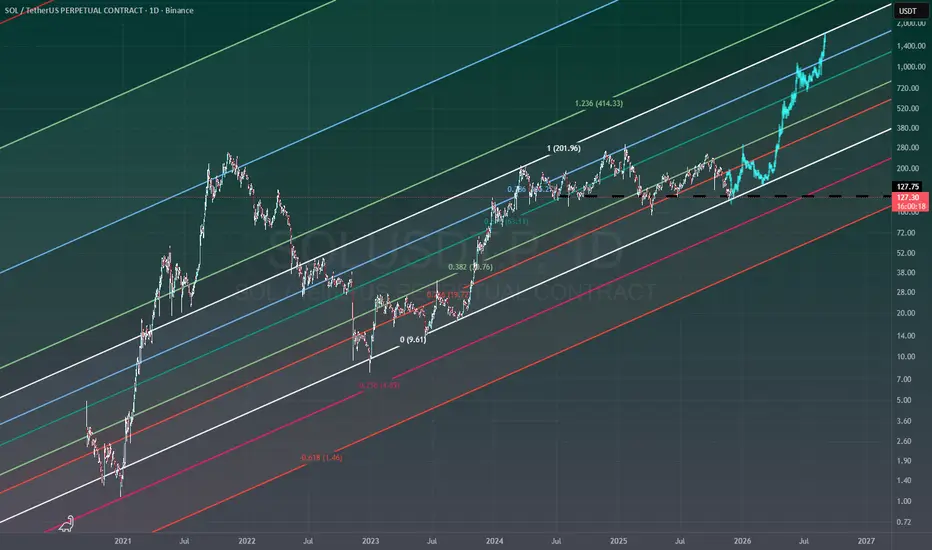
Decision time for #SOLAccording to fib channels, since 2020 September we only see one time degradation of SOL in late December 2020 which responded from -0.236 and starts its rally.
Now we are in the same zone . and have two different scenario in hand:
1. Fib 0 is trying to support the price once again. if we lose this support, price will see 75-80 support level around Fib -0.236 .
Do not want to share any worse scenario but it is also be catastrophic if price lose support of Fib -0.236 .
2. As a positive scenario, Until the end of 2027 we will see the price will rush to the Fib 1 (Approx 1K)
We will see which scenario is going to be validated, but just fingers are crossed for the 2nd scenario.
Trade ideas
SOL-USDTI updated the support box and the range 🕯
Solana is currently between a support box and a range, with prices between $123 and $128, which is an extremely important support, and the RSI is also in oversold territory 💰💲
If this support holds and the top of the box, meaning $128, is broken 📣
The first rise would be towards $135 🔼🚨

purches ideapurches idea
purches idea
purches idea
purches idea
purches idea
purches idea
purches ideavpurches ideapurches ideapurches ideapurches ideapurches ideapurches ideapurches ideapurches ideapurches ideapurches ideapurches ideapurches ideapurches ideapurches ideapurches ideapurches ideapurches ideapurches ideapurches ideapurches ideapurches ideapurches ideapurches ideapurches ideapurches ideapurches ideapurches ideapurches ideapurches ideapurches ideapurches ideapurches ideapurches ideapurches ideapurches ideapurches ideapurches ideapurches ideapurches ideapurches ideapurches ideapurches ideapurches ideapurches ideapurches ideapurches ideapurches ideapurches ideapurches ideapurches ideapurches ideapurches ideapurches ideapurches ideapurches ideapurches ideapurches ideapurches ideapurches ideapurches ideapurches ideapurches ideapurches ideapurches ideapurches ideapurches ideapurches ideapurches ideapurches ideapurches ideapurches ideapurches ideapurches ideapurches ideapurches ideapurches ideapurches idea

SOL/USDT: Strong Uptrend – Short-Term Buy Opportunity!We are witnessing an excellent opportunity on the SOL/USDT chart, as Solana (SOL) continues to maintain a strong upward trend. In the context of a gradually stabilizing cryptocurrency market and positive news about Solana's ecosystem development, SOL is entering a significant price increase phase.
Currently, SOL/USDT is trading within an ascending channel and has broken out of the 140.00 support zone . The price is fluctuating around 143.66, close to the 140.00 support, which could see a slight pullback before continuing the upward momentum.
The next target for SOL/USDT in the short term is 155.00, where it might encounter some resistance. However, if the price maintains above 140.00, there is a high probability that SOL could continue its strong upward momentum towards 156.00 and even beyond.
Trading Strategy:
Buy SOL around the 140.00–143.00 range, with a short-term target of 155.00 and 156.00.
Set stop-loss if the price breaks below 139.00, as this is a crucial support level within the current uptrend channel.
In conclusion, SOL/USDT is maintaining a solid uptrend, and with positive signals from both technical indicators and fundamental factors, buying around the support zone is a reasonable strategy to capitalize on the upward movement.

SOLI have been telling you for a while to buy CRYPTOCAP:SOL at these levels and I am telling you again. This is major support. Yes, it could break down, but doing so would destroy a very clean structure that I do not think the market or the market makers will allow. This is a strong entry zone.

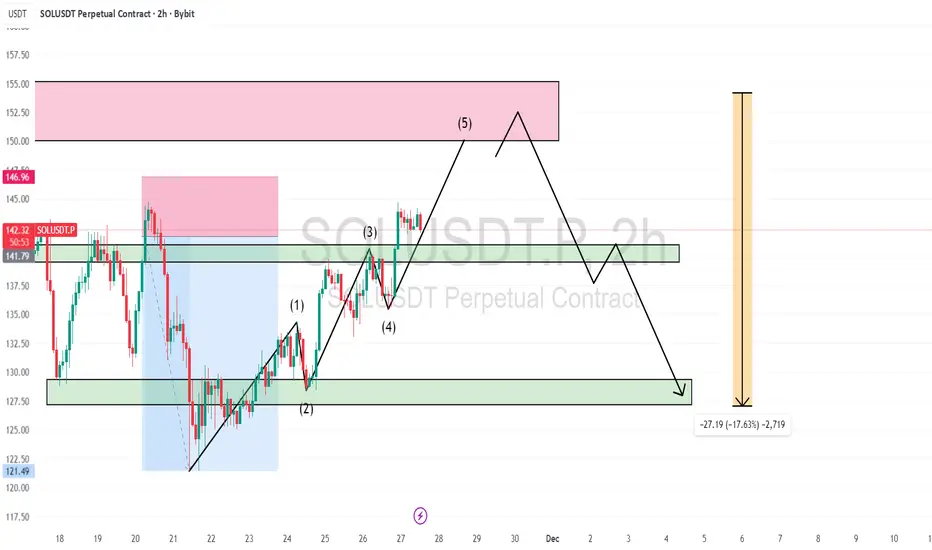
Sol trade idea
Solana is currently moving inside a bearish ascending channel.
I’m targeting a 50% retracement, which aligns with the Monday high and a fair value gap.
I’m waiting for confirmation, meaning I want price to break the channel, then retest from the MSS level.
If that retest shows weakness, I’ll look to enter the short setup.


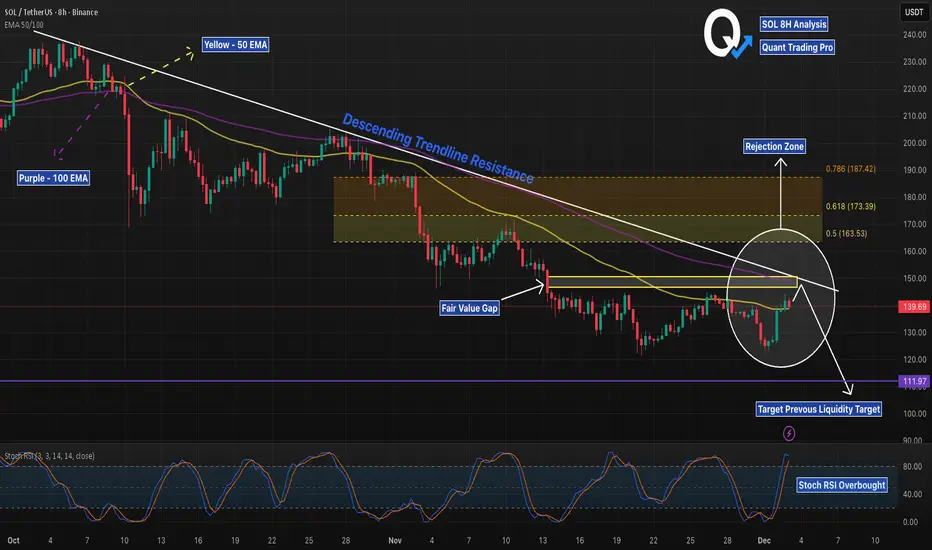
SOL 8H – FVG + EMA Rejection, Liquidity Next?SOL has tapped a clean multi-confluence rejection zone: the descending trendline, the 50/100 EMA cluster, and a filled Fair Value Gap all stack at the same price level. This area has acted as a strong pivot throughout November, and today’s reaction is consistent with prior trendline rejections.
The Stoch RSI is already in overbought territory on the 8H, adding momentum exhaustion to the setup. Bears will watch for continuation toward the major liquidity level around $111.97, which remains untested below.
For bulls to regain control, price must break and hold above the EMA cluster and FVG, flipping the trendline into support. Until then, the path of least resistance remains down toward liquidity.

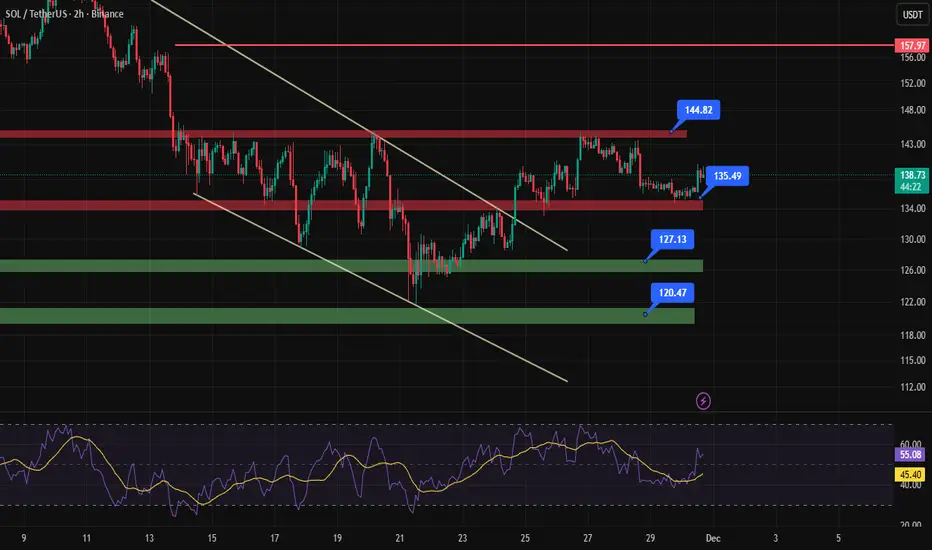
SOL-USDTIn the two-hour timeframe, it is still above the specified support level at $135, and on the top, there is static resistance at $144 📊
So the next move is either a break of the support and continuation of the correction down to $127 🔽💰, or a break of the resistance and rise up to $157 🔼💲
SOLUSDT long tradeENTRY: 142.20
STOP LOSS: 140.80
TP1: 143.80
TP2: 145.30
RRR: ~2.4:1
🔍 MULTI-TIMEFRAME ANALYSIS
1m:
Strong micro structure break + engulfing candle reclaim around 142.00
Liquidity sweep below short-term low (fakeout at 141.90–142.00 zone)
Reclaim with higher low forming (valid sniper zone at 142.20)
5m:
Bullish engulfing from demand zone (below 141.00) with volume spike
Clean breakout reclaiming mid-structure range
Price holding above previous resistance turned support (142.00 zone)
15m:
Bounce off higher low in a bullish range after deep pullback
Recovery after sweep of major support zone near 138.00–139.00
Confirmed reversal + clean impulse suggests continuation toward upper range

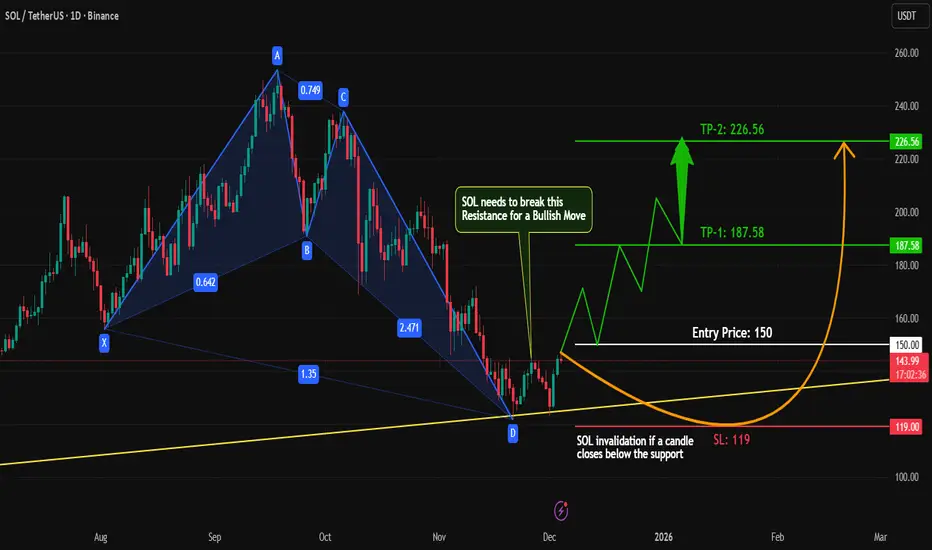
SOLUSDT to $420 ? - harmonic butterfly/crab/deep crab
Extremely clean XABCD harmonic pattern spotted on solusdt. Please read the entire post for education, target entry and TP zones. I put a lot of research in it. Hope you enjoy the read. Not a financial advice, just for education purpose. :)
To summarize the post, the most likely harmonic completion is the BUTTERFLY/Crab into $350–$410 ( first TP).
Here’s why:
- Fits the macro Solana channel
- Fits Elliott Wave 5 target
- Fits the center of the yearly momentum projection
- Fits market cycle timing (BTC topping 2026 → ALTs explode late)
- Matches confluence on trendlines
- fear and greed factor - extreme fear ( usually expect a bounce)
- SOL historically performs deep harmonic extensions in cycles
--------------------------------------------------------------
DETAILS:
----------------------------------------------------------------
ENTRY ZONE (now to $118)
BEST entries are:
✔ $142 – $132 (current accumulation)
✔ $128 – $118 (golden entry zone) → this is ideal
✔ $110 – $100 (max fear entry if BTC dips)
Why these?
Because they form the C-to-D inflection, where harmonics begin their strongest rallies.
🟢 TAKE PROFIT LADDER (precision)
🎯 TP1 – $348–$417
Scale out 20–25%
(Butterfly/Crab PRZ + first alt rally)
🎯 TP2 – $540–$615
Scale out 40–50%
(The primary Deep Crab completion)
🎯 TP3 – $720–$820
Scale out 25–40%
(Extended mania phase)
🔻 STOP LOSS & INVALIDATION
You need two levels, not one.
🔻 Soft SL (Pattern Risk)
$110
If broken, pattern might retest deeper liquidity, but still intact.
🔻 Hard SL (Harmonic Invalidation)
$95 – $90
A weekly close below $95 breaks:
- XA structure
- Trend geometry
- Harmonic ratios
- Crab + Butterfly tolerance
________________________________________________________________
Here are details of the HARMONIC PATTERN AND MY NOTES....
_______________________________________________________________
X → A → B → C → D progression is valid:
X = $294
A = $95
B = $255–268 zone
C = $122
D (Projected) = $300–$400 zone depending on harmonic type
Key points:
XA retracement at B ≈ 0.786 – 0.88 zone
This is what defines the pattern:
If B is ~ 0.886 → Deep Crab / Butterfly
B is around 0.788–0.92 area, so this makes it: A DEEP HARMONIC PATTERN → most likely a Butterfly or Deep Crab
(depending on how far D will extend)
Final D target depends on which pattern completes first
IF Butterfly →
⭕ D = $348–$416
IF Crab →
⭕ D = $540–$630 >>> my target zone.
If Extended crab... $750–$830
Most Probable Outcome (based on structure)
The most likely harmonic completion is the BUTTERFLY/Crab into $350–$410.
Here’s why:
- Fits the macro Solana channel
- Fits Elliott Wave 5 target
- Fits the center of the yearly momentum projection
- Fits market cycle timing (BTC topping 2026 → ALTs explode late)
- Matches confluence on trendlines
- fear and greed factor - extreme fear ( usually expect a bounce)
- SOL historically performs deep harmonic extensions in cycles
For your education... MOST COMMON PATTERN RULES
1. Gartley Pattern
🔸 B = 61.8% of XA
🔸 D = 78.6% retracement of XA
🔸 BC = 1.27 or 1.618 extension
2. Bat Pattern
🔸 B = 38.2–50% of XA
🔸 D = 88.6% retracement of XA
🔸 BC = 1.618–2.618 extension
3. Crab Pattern
🔸 B = 38.2–61.8% of XA
🔸 D = 161.8% extension of XA
🔸 BC = 2.618–3.618 extension
4. Butterfly Pattern
🔸 B = 78.6% of XA
🔸 D = 127.2–161.8% extension of XA

SOL : MAYBE BUY...Hello friends
Well, you see that after the heavy price drop, buyers entered and broke several key resistances, and now there is a clear triangle left, which if broken by the buyers, the price can move to the targets specified.
Please note that this is not a buy or sell signal and is only reviewed from a technical perspective, so observe risk and capital management and avoid emotional behavior.
*Trade safely with us*

DeGRAM | SOLUSD will test the strength of the $150 resistance📊 Technical Analysis
● SOL/USD remains inside a broad descending structure with repeated rejections from the dynamic resistance line, preserving bearish dominance.
● Price is approaching the $150 zone, where previous flag and consolidation tops failed, making a reversal toward the $135–$130 support area highly probable.
💡 Fundamental Analysis
● Market rotation out of high-beta altcoins continues as investors reduce exposure amid rising volatility, limiting SOL’s upside potential.
✨ Summary
● Bearish bias below $150. Targets: $135 → $130. Resistance: $150.
-------------------
Share your opinion in the comments and support the idea with a like. Thanks for your support!

$SOL 1H CHART UPDATE📌 CRYPTOCAP:SOL could turn bearish again from the STRONG Resistance zone above ✅
📌Watch for bearish confirmation from that zone ✅
📌If that zone is rejected, CRYPTOCAP:SOL will move lower again 🚀
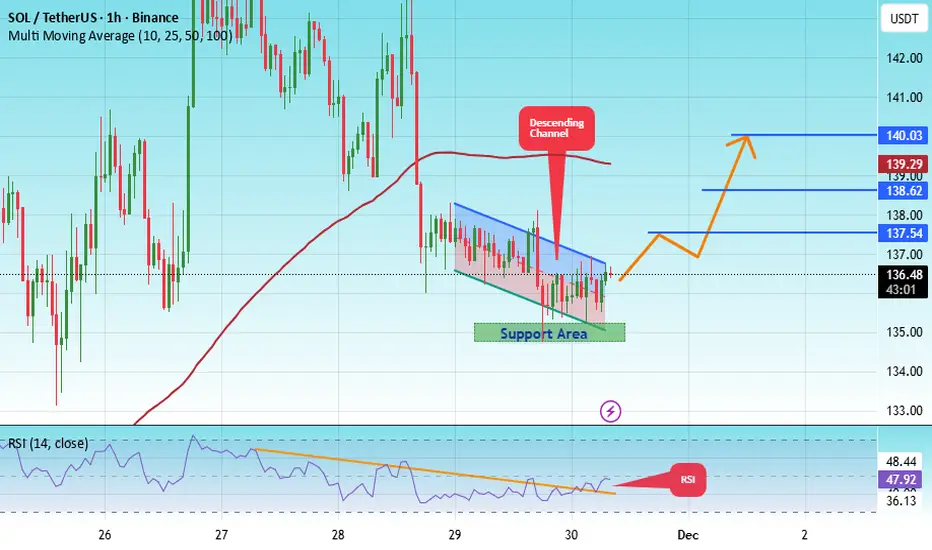
#SOL/USDT Final Liquidity Zone Before Expansion?#SOL
The price is moving in a descending channel on the 1-hour timeframe. It has reached the lower boundary and is heading towards breaking above it, with a retest of the upper boundary expected.
We have a downtrend on the RSI indicator, which has reached near the lower boundary, and an upward rebound is expected.
There is a key support zone in green at 135. The price has bounced from this zone multiple times and is expected to bounce again.
We have a trend towards stability above the 100-period moving average, as we are moving close to it, which supports the upward movement.
Entry price: 136.60
First target: 137
Second target: 138
Third target: 140
Don't forget a simple principle: money management.
Place your stop-loss below the green support zone.
For any questions, please leave a comment.
Thank you.
Solana - Bullish Divergence Solana is showing bullish divergence on the daily chart. A clear signal that a reversal is imminent. A number of other major crypto are showing the same signal. I now look for confirmation of a reversal via a trend line break. Wedge break, volume or bullish pattern on lower timeframe.

SOLUSDT spot idea or swing tradeCurrently we can see how SOL is moving in the descending channel, the price didn't manage to break out a global resistant level, hence, it pulled back from this zone significantly which led to a downtrend on the chart, there is still a little space for continued fall, and I would wait for the price to reach a strong support level around of $110-$125 where I would buy SOL on my spot portfolio. Another strong indicator why SOL may grow faster than the entire crypto market is ETFs. So far we see how investors are extracting funds from SOLETFs but it's just a matter of the time when inflows will get back.

SOL reversal⚡ SOL/USDT – 1H Reversal Heating Up
BYBIT:SOLUSDT.P holding strong above $136–$138 support — EMA ribbon flipped green and momentum’s curling up.
If bulls defend this level, next leg targets $150 → $160+.
Break below $132 invalidates short-term setup.
“Golden pocket bounce. Calm before the breakout.” ⚙️

SOLUSDT – Swing Trade in Play Alright traders, we’re trying another swing trade on SOL —
counting on a rally in the next few days/weeks.
Why? Because the macro picture is finally starting to look a bit less depressing.
Sure…
today’s Jobless Claims weren’t great,
but overall macros are improving slowly,
and that gives the market some space to breathe.
So what do I expect?
👉 Small push down first (because crypto can’t ever go straight up)
👉 followed by a move upward — hopefully the real swing leg we’re waiting for
It’s not guaranteed (nothing ever is),
but the setup looks solid and worth taking with proper discipline.
⸻
⚠️ Trade safely, legends
Use proper risk management,
don’t overleverage,
and let SOL do the heavy lifting. 😄
Good luck! 🚀🔥

SOL (Solana) – High-Probability Reversal Setup FormingSOL (Solana) – Advanced Harmonic Completion + Trendline Confluence | Break & Retest Strategy
#SOL remains within a broader downtrend on the higher timeframe, but the recent 1D structure is showing an important technical development. Price has completed a harmonic pattern directly on a major multi-touch trendline, creating a strong confluence zone with potential for a reversal.
Despite the existing downtrend, there is no confirmed bearish continuation signal. Momentum is slowing down, suggesting that sellers may be losing strength.
Technical Breakdown
Harmonic Completion Zone (HCZ)
Price has tapped a harmonic completion area aligning with a Fibonacci cluster, prior demand, and trendline support. This makes it a high-value level for reaction.
Trendline Confluence
#SOL continues to respect the ascending trendline. Current candles show corrective movement rather than impulsive sell pressure.
Trading Strategy
Bullish Plan:
Wait for a clean breakout above resistance.
Look for a retest into the breakout zone.
Confirm long entries through bullish rejection or engulfing structure.
Stop loss below structural lows.
Target next liquidity pools with a minimum 1:2 R:R.
This ensures entries are backed by confirmation rather than anticipation.
Bearish Consideration:
As long as resistance holds, the overall market remains in a downtrend. Failure to break the level may result in continuation to the downside.
Summary
Harmonic pattern completed at a strong confluence area.
Trendline support remains respected.
No bearish continuation signal at current levels.
Bullish scenario only valid after breakout and retest.
Structure confirmation is essential to avoid premature entries.
#SOL #Solana #CryptoAnalysis #TechnicalAnalysis #HarmonicPattern #Trendline #MarketStructure #BreakAndRetest #PriceAction #CryptoTrading #TradingStrategy #Altcoins #CryptoChart #TradingView
SOL / USDT : Accumulation zone for upcoming rallySol / USDT is currently trading at an attractive discount and is looking promising for a strong rally once the market stabilizes and shows bullish momentum.
This zone can offer a good opportunity for accumulation, but patience and confirmation are important.
Do your own research before investing. This is just my opinion.

SOLUSDT 12HSOLUSDT 12H
A double bottom pattern has formed at the end of the downtrend. If it can break the neckline, an entry can be taken on the pullback after confirmation.👌
