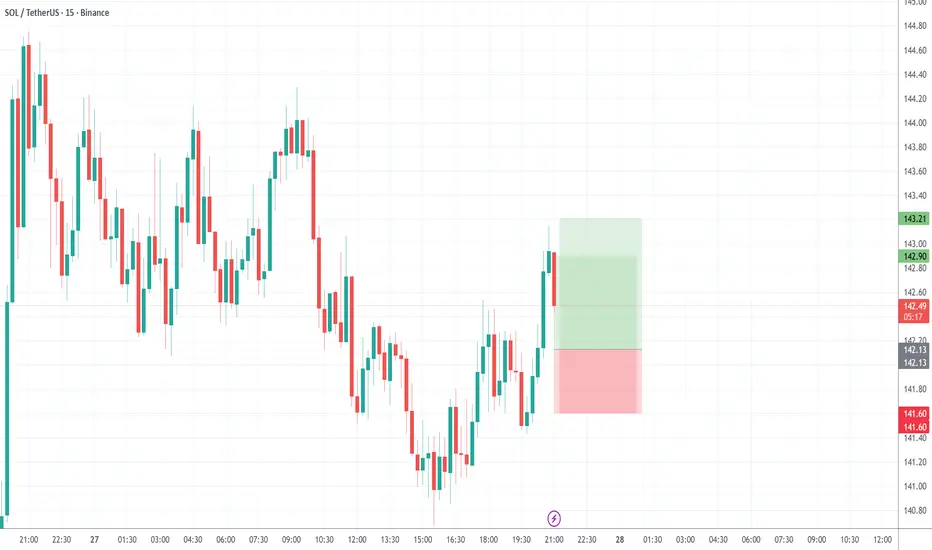
SOL/USDT LONG setup 1️⃣ Support Bounce
buy limit Entry: 142.10 – 142.30
Stop loss: 141.60
TP: 142.90 – 143.20
Confirmation: bullish engulfing / strong rejection wick on 1m
Trade ideas
SOL USDT LONG SIGNAL---
📢 Official Trade Signal – SOL/USDT
📈 Position Type: LONG
💰 Entry Price: 138.26
---
🎯 Take-Profit Targets (Partial Exits):
• TP1: 140.95
• TP2: 143.60
• TP3: 146.20
• TP4: 149.85
• TP5: 153.75
• TP6: —
---
🛑 Stop-Loss: 132.78
📊 Timeframe: 15m
⚖️ Risk/Reward Ratio: 2.89
💥 Suggested Leverage: 5× – 10×
---
🧠 Technical Summary
SOL is forming a bullish structure after bouncing from the 136–138 demand zone, confirming intraday higher lows.
Momentum indicators show early strength, supporting a continuation toward upper resistance levels:
140.95 → 143.60 → 146.20 → 149.85 → 153.75
A breakout above TP1 increases the probability of hitting extended targets.
---
⚙️ Trade Management Rules
✔ Take partial profits at TP1
✔ Move SL to Break-Even after TP1 is reached
✔ Trail SL as price approaches higher targets
✔ Avoid re-entry if SL hits
✔ Confirm market structure before entering
---
📌 TradingView Hashtags
#SOLUSDT #SOL #CryptoSignal #LongSetup
#TradingView #FuturesTrading #Altcoins #TechnicalAnalysis
---

SOLCRYPTOCAP:SOL has $215 as the next key resistance level. Once that breaks, the structure opens up cleanly and a move toward $400 plus should come with ease. Momentum is building and the chart supports continuation.

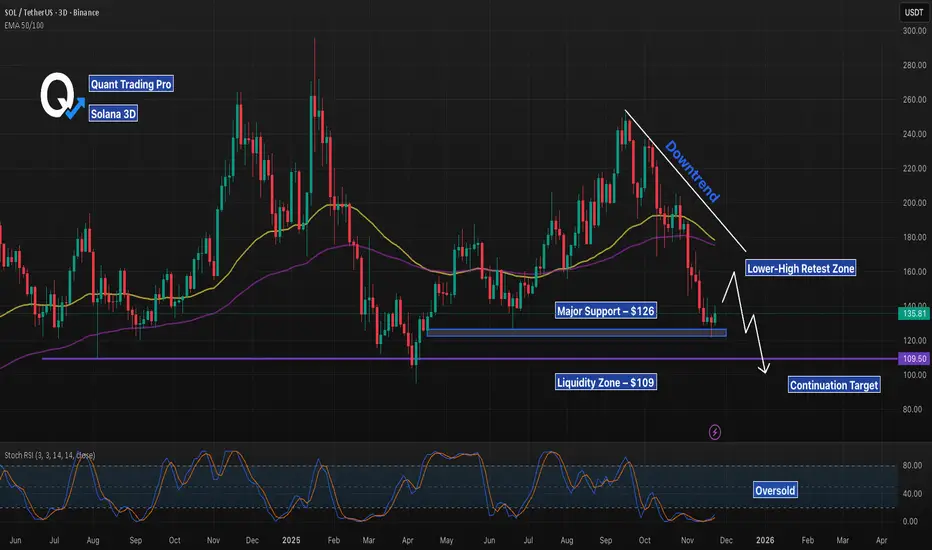
SOL 3D – Retesting Trendline, But Will Support Break Next?SOL remains in a clear daily downtrend, with price consistently setting lower highs beneath the descending trendline. Price is now pulling back into a potential lower-high retest zone, directly aligned with the confluence of the 50/100 EMAs overhead. Unless SOL can reclaim this trendline with a strong daily close, this setup favors continuation lower.
The first major area of interest is the $126 support, which has acted as a key reaction level across multiple months. A clean break of this level opens the door toward the lower $109 liquidity zone, which historically attracts deep wicks and stop-hunts before reversal attempts.
Stoch RSI remains in the oversold region, but without a confirmed bullish cross or momentum shift. Trend structure takes priority unless buyers reclaim the trendline and break the sequence of lower highs.
Watching for:
• Reaction at the trendline retest
• Daily close above or below $126
• Liquidity sweep toward $109 for potential reversal setups
Solana using TrenVantage LITEGood news is Solana was able to wick and grab a new high in this move.
Bad news is this looks like distribution of its move and the near support levels have already been tested.
Expecting a retrace back to the move which took us to the previous high, or previous accumulation levels.
If crypto market sees a bear market would expect below $50 for sol, probably below $20
Trends plotted by the TrenVantage LITE indicator,

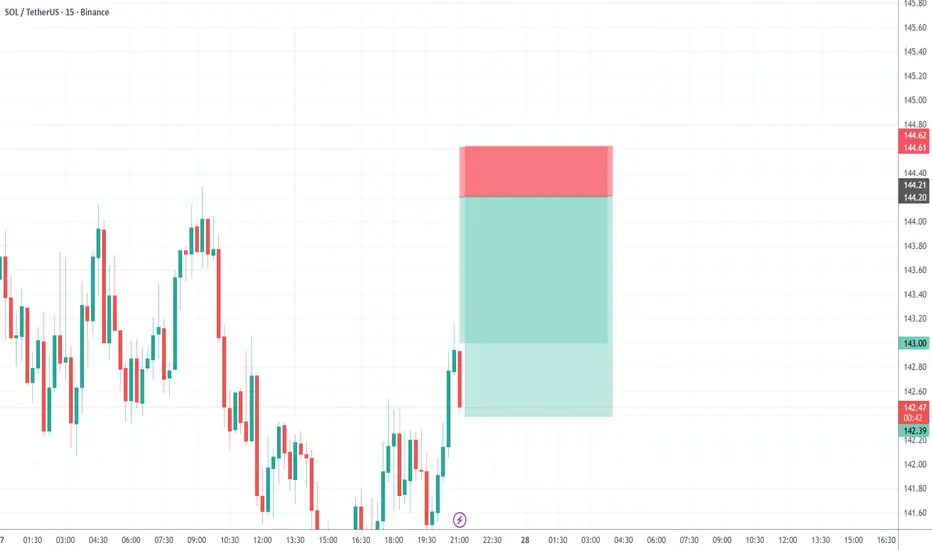
trong impulsive move supported by high volumeSOL has broken above a key intraday resistance level with a strong impulsive move supported by high volume. This breakout indicates renewed bullish momentum. After the breakout, price is retesting the structure, offering a clean continuation entry. As long as the retest holds, the bullish trend is expected to extend toward the next liquidity zone. Stop-loss is placed below the breakout structure to protect against a failed retest.
SOLUSDT SHORT Scalping SetupsResistance Rejection
Entry: 143.80 – 144.20
Stop loss: 144.60
TP: 143.00 → 142.40
The SOL Fractal That Called the April Bottom Is BackSOL – 63-Day Fractal Breakdown, Macro Liquidity Compression, and a Projected Structural Low at 109 (Dec 8)
Advanced Technical Analysis • Liquidity Cycle Modeling • HTF Structural Projection
This analysis examines Solana’s repeating 63-day distribution and decline cycle, visible across all major swing tops in 2024–2025. The current cycle aligns with the time and structural rhythm of the March–April decline, despite originating from different catalyst categories. A deeper extension is now projected, with a structurally valid new low at 109 around December 8, based on cycle symmetry and volume profile displacement.
1. Macro Structure: 63-Day M-Top → 63-Day Decline → Liquidity Exhaustion
Solana has produced three consecutive cycles with nearly identical structural components:
1. Distribution Phase (63 days)
A pronounced M-top forms with weakening momentum, lower-timeframe volatility expansion, and diminishing trend strength. Across all three cycles, this distribution top lasted approximately 63 days before breakdown.
2. Decline Phase (63 days)
Following the M-top, each cycle transitions into a multi-week decline of similar duration:
Lower highs on weekly structure
Gradual liquidity withdrawal
Volume profile thinning
Mean reversion into prior accumulation regions
These two phases together form a repeating HTF liquidity cycle, not random noise.
Cycles:
Dec 2024 → Mar/Apr 2025
May 2025 → Jul/Aug 2025
Sept 2025 → Current decline (ending projected Dec 2025)
The timing and structure of the current decline match the earlier two cycles.
2. Catalyst Comparison: Different Causes, Same Liquidity Behavior
Even though the bearish catalysts differ, the market reaction is identical.
March/April Decline (Internal SOL Catalysts)
Large exploit events
Validation congestion
Finality delays
On-chain liquidations
Current Decline (Macro-Driven Catalysts)
Inflation uncertainty
Government shutdown risk
Liquidity compression across risk assets
Declining altcoin participation
Buyer hesitation despite strong fundamentals
In both cases, liquidity exits the market at the same rate and in the same structural pattern. Price responds to liquidity, not narrative, validating the use of Fractal Structure Analysis.
3. Revised Support Projection: Structural Low at 109 by December 8
While previous cycles bottomed at 128–132, the current cycle shows:
Deeper volume displacement
Increased macro drag
Long-wicked bearish weekly closes
A more aggressive liquidity unwind
A declining mid-range reclaim rate
These factors support an extended deviation beneath the standard fractal floor.
**Projected Bottom: 109 ± 2
Projected Date: December 8**
This 109 target aligns with:
HTF liquidity sweep logic
The lower boundary of the volume imbalance left from the prior bullish expansion
Completion of the 63-day decline window
Equal-range extension from the M-top measured move
The long-term ascending trendline from the November 2023 breakout
This deeper retracement does not break the bullish macro structure—it simply represents a more aggressive liquidity purge due to macro pressure rather than internal network issues.
4. Forward Outlook: Accumulation (Dec) → Reversal (Jan) → Trend Expansion (Feb)
If Solana completes the projected liquidation down to the 109 level:
December
HTF accumulation
Seller exhaustion
Low-volatility compression
Volume profile stabilization
January
First structural higher low
Demand reentry
Reclaim attempts toward the 150–155 micro-structure band
February
Break in HTF market structure
Trend continuation
Full momentum expansion targeting prior resistance levels
Upside targets once the reversal begins:
240 (HTF breaker and mid-range)
280 (HTF supply region)
300+ (cycle extension if macro improves)
This trajectory mirrors the post-April recovery phase, with a shifted timeline due to extended macro drag.
5. Invalidation Criteria
The bullish fractal thesis is invalid under the following conditions:
Sustained weekly close below 105
BTC losing key support with high-volume follow-through
Breakdown of the long-term ascending structure from Q4 2023
Failure to reclaim 150–155 during the January recovery attempt
A breakdown beneath these thresholds would indicate deviation from the multi-cycle rhythm.
6. Conclusion
Solana remains in a well-defined 63-day distribution and decline cycle, consistent across all major tops in 2024–2025. Liquidity behavior remains identical to prior cycles, even though catalyst categories differ.
The cycle now projects a deeper structural low at 109 around December 8, driven by macroeconomic headwinds rather than Solana-specific issues.
A January–February recovery remains the highest-probability outcome, provided structural levels hold and macro conditions stabilize.

SOL first target 200$ and only after breakout 300$As observed on the chart, SOLUSDT has demonstrated significant resilience at the major daily support zone near $110, establishing a solid foundation for the current upward movement. The path toward the $200 resistance level appears well-defined, with the asset showing strong bullish momentum.
However, to advance beyond this level, a decisive breakout above the $200 resistance accompanied by substantial trading volume will be essential. Such a confirmation would signal sustained buying pressure and potentially open the path toward higher targets, with $300 emerging as the next significant technical objective. Until then, the $200 level remains a critical barrier that requires validation before anticipating further expansion.
DISCLAIMER: ((trade based on your own decision))
<<press like👍 if you enjoy💚

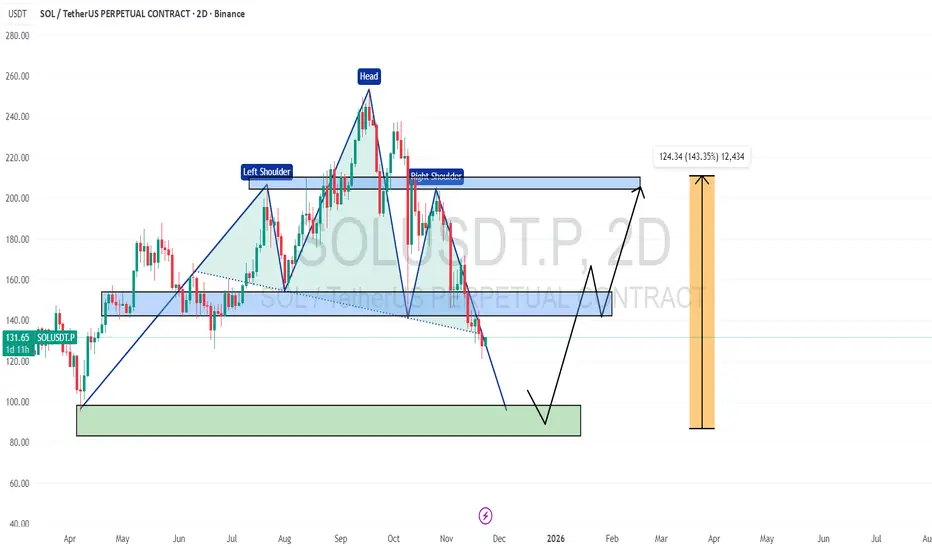
SOL USDT 2D CHART UPDATE 📌 CRYPTOCAP:SOL 2D Chart shows a head & shoulder pattern✅
📌 If this continues, the price may continue to decline ✅
📌 However, a bullish reversal is expected from the support zone below ✅
If this happens, the price may go back to the $150, $200+ range 🔥🚀
SOL Short 1D Rebalancing the bearish inefficiency is likely to lead to further development of the downward movement.

Solana hitting range lows. SOL price has pulled back into a major high-volume demand zone that supported every major rally in 2023–2024. The bearish divergence at the top played out cleanly, and now SOL is sitting on the first real test of this macro block.
Momentum indicators are resetting at historical reversal levels and showing early signs of a shift. As long as SOL holds the upper side of this demand zone, this remains an accumulation area, not a breakdown.
A bounce here sets up a mid-range reversal. A break below the liquidity shelf opens the door to the deeper demand block.
Watching for:
Higher low + momentum flip = bullish confirmation.

SOL-USDTIt had a good channel breakout and also a good pullback to the $135 level yesterday.
However, right now it's ranging between $135 and $144 🕯
Here, Solana needs to determine its path. If it breaks $144, the next target would be $160 🔼🔼💲💲
And if it goes below $135, the correction could continue down to $127 🔽🔽💲

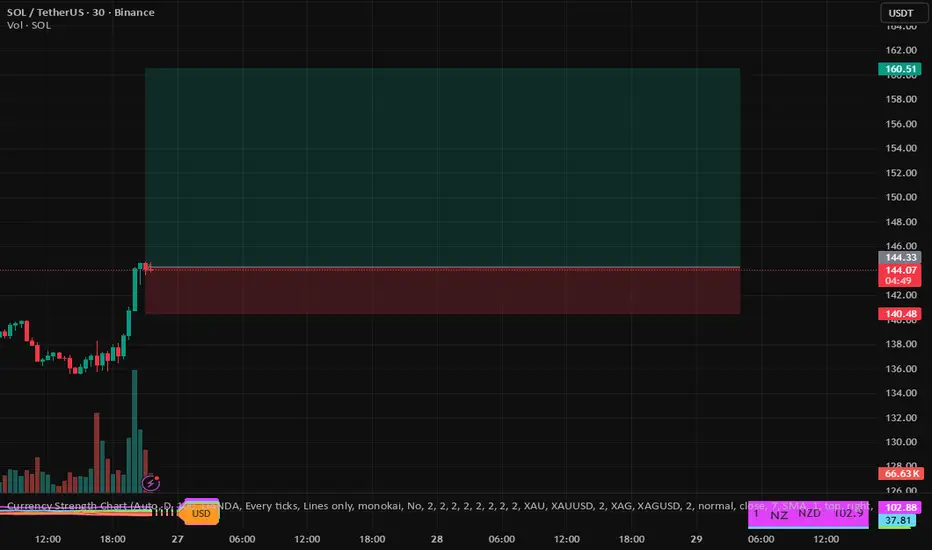
SOL-USDT
It has already grown to its target at 144.
Right now, it's under an important resistance.
There are two scenarios ahead ✌️
One is breaking the marked resistance and rising towards the next target at $157 🔼🔼
The second scenario is that it gets rejected from this resistance and consolidates below it, which means a correction back to 135 is possible again 🔽🔽
So we need to wait for either a breakout or a failure at a lower timeframe 📊📊💲💲

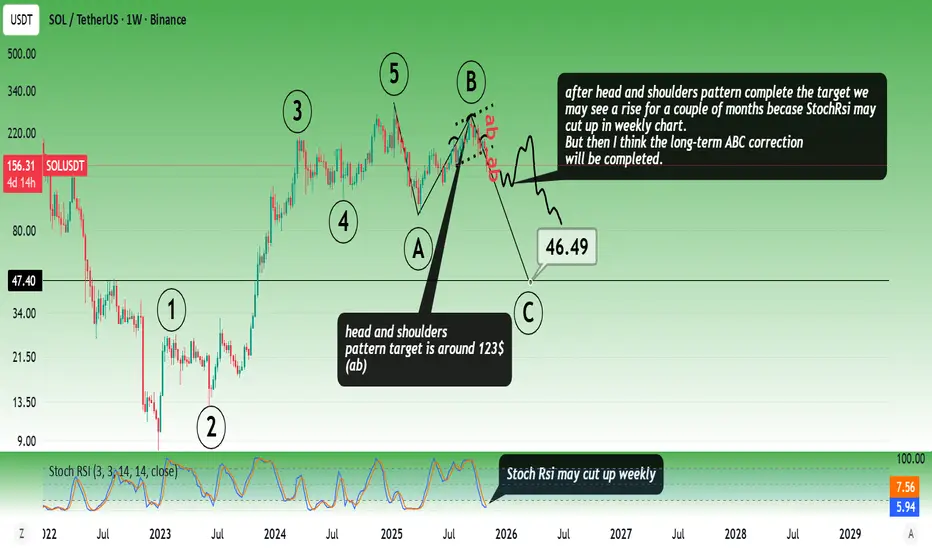
Solana RoadmapAfter the head and shoulders pattern complete the target we
may see a rise for a couple of months becase StochRsi may cut up in weekly chart.
But then I think the long-term ABC correction will be completed.
* The purpose of my graphic drawings is purely educational.
* What i write here is not an investment advice. Please do your own research before investing in any asset.
* Never take my personal opinions as investment advice, you may lose your money.
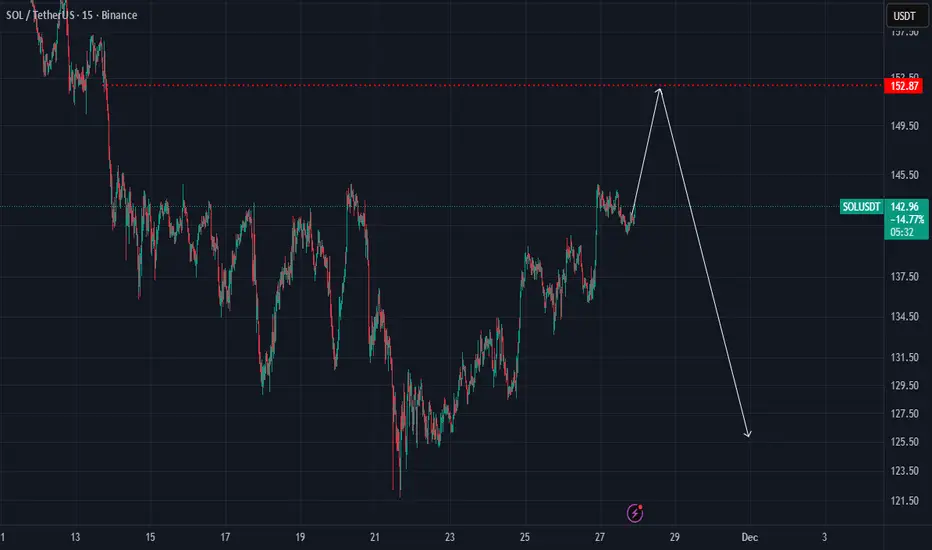
SOL/USDT (30-minute)..
✅ Targets Visible on My Chart (Already Marked by me)
My TradingView chart for SOL/USDT (30-minute) shows two downward “Target Points” marked with blue arrows:
1. First Target Zone:
• Around $128 (approx).
• Marked just below the current price break of the trendline.
2. Second / Deeper Target Zone:
• Around $120–121.
• This is the larger measured move shown by the longer blue arrow.
🧭 What the Chart Suggests (Just Based on What I Drew)
Price appears to have broken the ascending trendline.
Targets seem to be drawn using a measured-move / range projection.
Cloud (Ichimoku) shows price dipping into bearish zone

SOL USDT LONG SIGNAL---
📢 Official Trade Signal – SOL/USDT
📈 Position Type: LONG
💰 Entry Price: 131.34
---
🎯 Take-Profit Targets (Partial Exits):
TP1 = 133.70
TP2 = 136.87
TP3 = 140.35
TP4 = 143.90
TP5 = —
---
🛑 Stop-Loss: 128.00
📊 Timeframe: 15m
⚖️ Risk/Reward Ratio: 4.47
💥 Suggested Leverage: 5× – 10×
---
🧠 Technical Analysis Summary
SOL is currently showing strong bullish momentum after holding the 131.00 support zone and forming a clean higher-low structure on the 15m timeframe.
Buyers are stepping back in as price pushes above short-term EMAs, creating a favorable long opportunity.
Liquidity pools sit above 133.70 and 136.87, making TP1 and TP2 highly probable targets.
A breakout through 136.87 may fuel continuation toward 140.35 and higher liquidity at 143.90.
Market structure remains bullish unless price closes below the 128.00 invalidation zone.
---
⚙️ Trade Management Rules
✔️ Take partial profit at TP1
✔️ Move SL to Break-Even once TP1 is hit
✔️ Trail SL as price approaches upper targets
✔️ Avoid re-entry if SL gets hit
✔️ Always confirm short-term market structure before entering
---
⚠️ Risk-Management Note
Once TP1 is reached, moving SL to Break-Even is essential.
If price reverses and tags BE, the trade ends with zero loss, fully protecting capital.
🔐 Capital protection is priority #1.
---
📌 TradingView Hashtags
#SOLUSDT #SOL #CryptoSignal #LongSetup #TradingView
#TechnicalAnalysis #FuturesTrading #Altcoins
--

SOLUSDT – Push Down Again?Alright, are we going down again?
How far?
No clue. You don’t know. I don’t know.
Honestly, even Solana doesn’t know — it’s just vibing at this point. 😄
BUT… what we do know is that this week still looks pretty bearish overall.
Macro = trash.
Fear = extreme.
Traders = crying.
Perfect conditions for SOL to explore some lower real estate before even thinking about a pump.
I’m treating this as a mini swing / big scalp:
• lower RR
• higher win rate
• quick in, quick out
• don’t overthink it
🔎 What’s the plan?
We can easily push deeper this week, grab some liquidity, scare everybody, and then maybe — maybe — give us a bounce.
Or… we pump straight from here and make everyone who shorted feel pain.
Classic crypto.
And that’s exactly why:
⸻
⚠️ RISK MANAGEMENT > EGO
No predictions, no hopium, no copium — just proper risk.
Trade safe, enjoy the ride, and don’t let SOL send you to liquidation island. 😄🚀

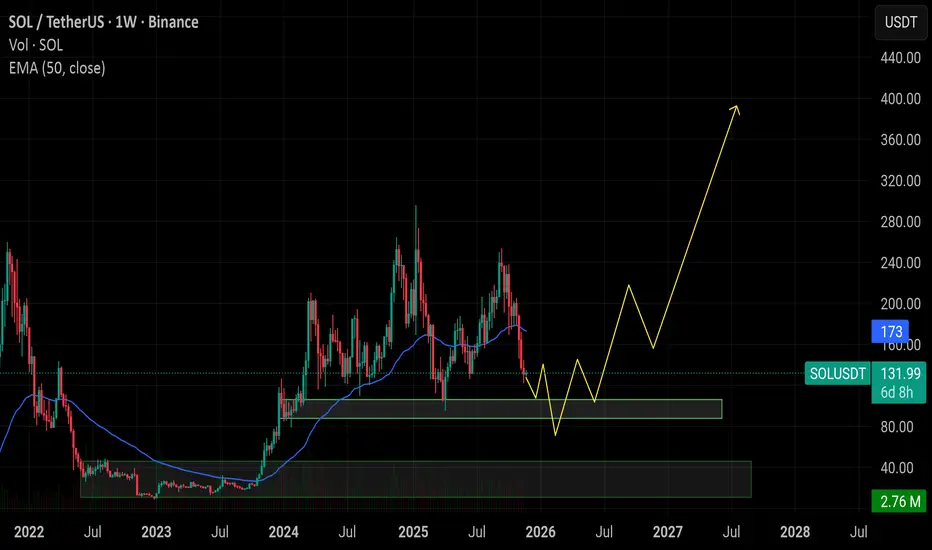
$SOL weekly structure shows a possible liquidity sweep toward CRYPTOCAP:SOL weekly structure shows a possible liquidity sweep toward the green demand zone before trend reversal. Current move looks corrective, not a trend change. If buyers defend the zone, market can enter an accumulation phase leading to a strong bullish expansion toward 2026-27. Long term outlook remains positive as long as the demand zone holds. Patience over panic.
SOLCRYPTOCAP:SOL is looking strong with support holding firmly. From the current level, the setup supports more than 200 percent in potential gains once momentum shifts. This is one of the cleanest support reactions on the chart right now.

SOL long-term TASolana is in heavy distribution, currently the weekly downtrend is engaged, it needs more time to bottom out, there's a good support at this area of $130ish and if it's broken we can see the lows of $100ish again.

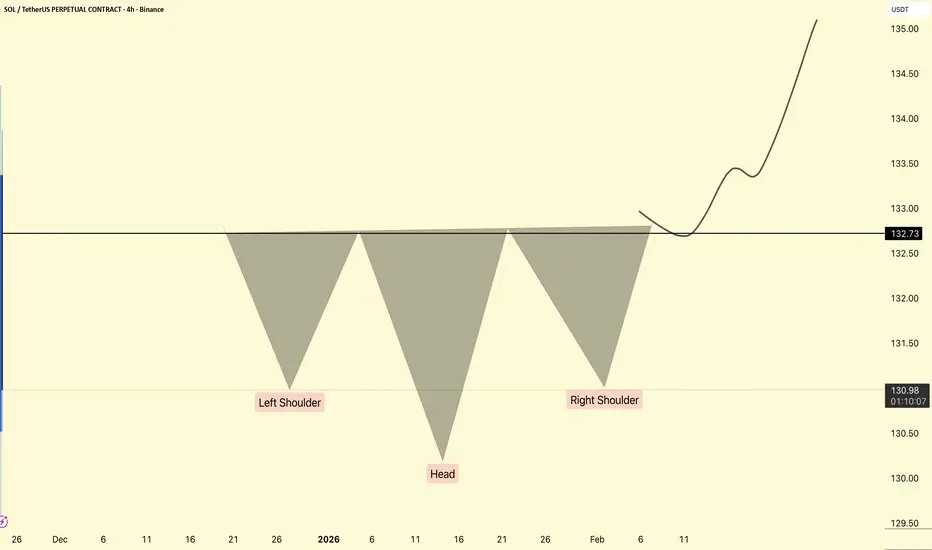
Inverse Head and Shoulders PatternThe inverse head and shoulders pattern is a technical analysis tool used to signal a potential trend reversal from a downtrend to an uptrend.
The inverse head and shoulders pattern is characterized by three consecutive troughs, with the middle trough (head) being the lowest and the two outer troughs (shoulders) being higher and nearly equal. This formation indicates that the downtrend is nearing its end, and a reversal to an uptrend may occur soon. Identifying this pattern can provide traders with a valuable signal to enter a new long position or exit a bearish trade, making it an essential part of technical analysis.
The inverse head and shoulders pattern is the opposite of the head and shoulders pattern. Technical traders widely follow both formations due to their distinct shapes and clear signals as trend reversal patterns.