#SOLUSDT – Harmonic C-Leg Hit | Bullish Expansion Zone
SOL has finally tapped the 0.844–0.886 retracement, completing the harmonic C-leg exactly as projected in the previous analysis.
This zone acts as a strong structural support, and holding above it keeps the bullish scenario intact.
🔹 Targets
• $230–$260
• $345 (Harmonic D)
• $410+ (Major Resistance Zone)
🔹 Invalidation
Weekly close below $100.
✨ Clean reaction. Harmonic structure still valid.
Trade ideas

SOL - Time for a pullback SOL - Time for a pullback
Before we take a new short we need a pullback and range
only after we can take a new short trade
Key resistance 171

Solana and ab=cd Solana has been performing very well and has started to decline after reaching the price ceiling it had repeated. After breaking the dynamic trend line on the daily timeframe, it is currently in a bearish trend. The probability of completing the ab=cd pattern at the drawn support area is high.

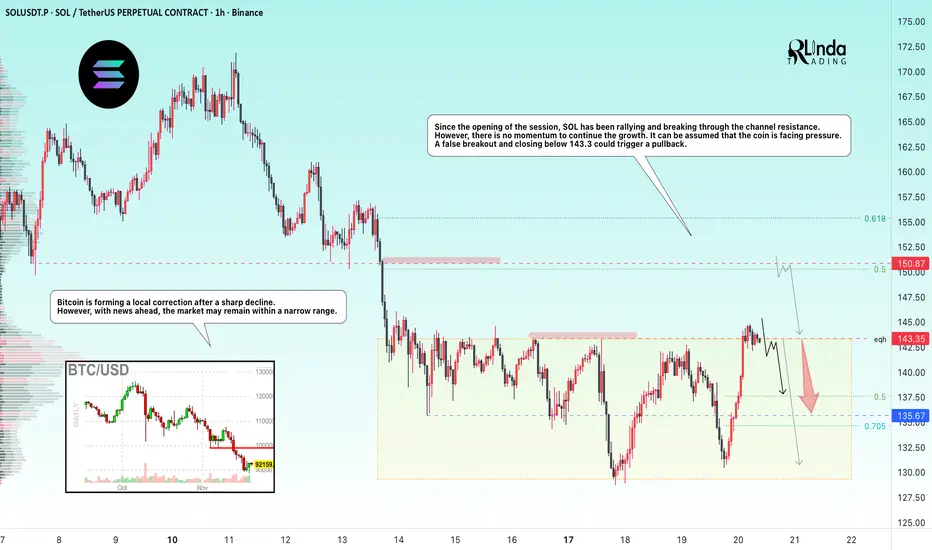
SOLANA → Manipulation - false breakout of resistance BINANCE:SOLUSDT.P flew up to resistance at 143.35 at the opening of the session and attempted to break through it, but bears may not let the price rise ahead of the news...
Bitcoin is forming a local correction after a sharp decline. However, news is ahead and the market may remain within a narrow range.
From the opening of the session, SOL rallies and breaks through the channel resistance, wasting 75% of its intraday growth potential. However, there is no momentum to continue the growth. It can be assumed that the coin is facing pressure. A false breakout and closing below 143.3 could trigger a pullback.
Resistance levels: 143.35, 150.87
Support levels: 135.67, 130.0
Two key levels for countertrend movement: 143.35 - 150.87. If the liquidity pool does not stop the price at the nearest level, then 150.87 can be considered as an additional level for trading a false breakout.
However, news on unemployment is coming soon, and the market may react quite aggressively. Therefore, if there are no trading opportunities before the news, I recommend refraining from action for an hour and waiting out the storm...
Best regards, R. Linda!
Solana monthly head and shoulders pattern Solana is showing a clear head and shoulders on the higher timeframe. A break of the neckline around $125 would see an eventual target of $60. This would represent a 50% reduction in price.

SOL reversal⚡ SOL/USDT – 1H Reversal Heating Up
BYBIT:SOLUSDT.P holding strong above $136–$138 support — EMA ribbon flipped green and momentum’s curling up.
If bulls defend this level, next leg targets $150 → $160+.
Break below $132 invalidates short-term setup.
“Golden pocket bounce. Calm before the breakout.” ⚙️

SOL 1W – FVG Cleared/Fib Reset Tagged, Is the Reversal Starting?SOL has reached a major confluence area on the weekly chart, tagging the broader Fib Reset Zone and reacting directly from long-term Trendline Support. This is the same structural level that launched previous multi-month rallies, making this an important point for potential reversal.
Price is also sitting just above the 0.618 retracement — historically one of SOL's strongest reaction levels — while the weekly Stoch RSI is emerging from oversold conditions, a signal often seen near macro turning points.
The declining 50/100 EMAs still create overhead pressure, but reclaiming these EMAs would confirm a shift in weekly trend structure and open the door for a broader recovery leg.
If the trendline fails, the lower demand zone becomes the next logical retest. But as long as SOL continues to defend this diagonal and build higher closes inside the Fib Reset Zone, the case for reversing the multi-month downtrend strengthens.
This is one of the most important weekly levels SOL has approached all year.

SOL-USDT
The 2-hour chart is still stuck around $145. Here, we should wait for either a break of resistance and continuation of the trend up to $157 🔼🔼 or a consolidation below resistance and the start of a corrective phase down to $138 🔽🔽
You can take the consolidations I mentioned for positions on the hourly chart 📣✔️

SOL/USDT: Bearish Structure Intact Below 155 Confluence ZoneSOL/USDT is approaching the 150–155 resistance cluster, where key technical levels—including the descending trendline, horizontal supply, and local upward trendline—converge. Despite a sharp rebound, the overall trend remains bearish, with lower highs dominating the structure. Recent price action appears corrective, not impulsive, suggesting this move may be a retracement rather than a true reversal.
If price gets rejected from this confluence zone, the bearish continuation toward 133 becomes the base case. Deeper downside could follow toward the mid-channel support unless bulls reclaim ground decisively.
➡️ Primary scenario: Rejection from 150–155 → drop toward 133
❗️ Risk scenario: Break and close above 155 would flip bias short-term bullish.

SOL-USDT
The two-hour timeframe has reacted to the 144 resistance. It has had good growth since yesterday 🔼✔️💲
I think, considering the RSI, this is a natural correction. In case of a correction, Solana's first support will be around $135 🔽🚨
If 144 is broken, I will update you 📣📊

Sol dropping ?Im in a small short
Might book partial at the white zone but expecting it to break and drop move
I will move to breakeven if it comes to white zone and let the setup play

FireHoseReel | All Eyes on Solana at This Critical Level🔥 Welcome to FireHoseReel!
Let’s jump into the Solana (SOL) market structure.
👀 SOL – 4H Overview
After breaking its descending curve structure, SOL faced strong resistance at $144 but failed to break it, leading to a sharp rejection.
Price then formed a double bottom and pushed back toward the same resistance. SOL is now trading near this critical zone once again.
📊 Volume Analysis
Volume increased significantly during the formation of the double bottom, driving a sharp move back toward resistance.
If buy volume remains sustained, the probability of a breakout above $144 increases.
✍️ SOL Trading Scenarios
You can use the following scenarios alongside your own trading strategy:
🟢 Long Scenario (Breakout Setup)
A confirmed breakout above $144, supported by a strong increase in buy volume, could provide a solid long opportunity on SOL.
🟢 Long Scenario (Aggressive Risk Setup)
Wait for price to consolidate, then enter during the pullback with decreasing volume, followed by the first signs of renewed buying pressure.
This setup allows for a tighter stop-loss and faster R:R, suitable for higher-risk traders.
🔴 Short Scenario
A loss of the key support at $124, accompanied by strong sell pressure, could activate a valid short setup for SOL.
❤️ Risk Management & Emotional Discipline
Crypto trading is highly risky. Without proper risk management and emotional control, trading is no different from gambling.
Logic must always come before emotions. Learn to manage your trades, and enjoy the process of trading with control and discipline.

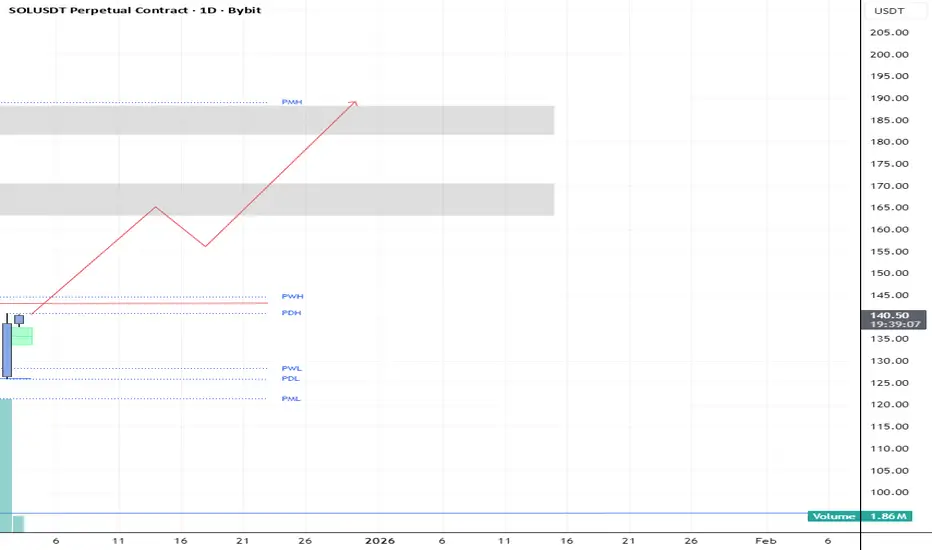
SOLUSDT-1D Bullish Outlook/RiskyChartechnical Overview:
Timeframe: 1 Day
Pair: SOL/USDT
Bias: Bullish (Reversal / Expansion Phase)
Context:
Price swept the previous weekly low (PWL) and daily low (PDL) liquidity before showing a strong bullish rejection candle from the discount zone.
The reaction suggests accumulation and potential for a bullish expansion phase targeting premium liquidity levels.
Structure Breakdown:
Liquidity Sweep: Price cleared downside liquidity below 130–135 zone before rebounding sharply.
BOS: A break of short-term structure to the upside signals shift in order flow.
Imbalance Zone: Small FVG (green box) is being mitigated, confirming strength from buyers.
Target Zones:
PDH / PWH: Near 150–155 USDT – short-term liquidity targets.
PWH / PMH: Around 175–185 USDT – long-term bullish objective.
Invalidation: Daily close below 128–130 would invalidate the bullish outlook.
SOL Up to 190 then down to 150Technical analysis. This is what it's all about man. Forecasting price.
So, I predict it's going to $190 because that's where my stop is, as I just entered short for no good reason in this sideways choppy market. Now price is guaranteed to hit my stop loss before actually making a huge move in my initial direction.
If I get stopped out, I'll lose $1000.
But I dont know, I haven't looked at metal commodities in the last few days, but those were coming down recently, so maybe people will start selling these kind of risky gold/crypto assets.
I'd also be curious about a possible gold-btc rotation thing. Has anyone looked into that? Let me know.

Market Technical Break Down For 1st to 5th December SessionGet ready to uncover mind-blowing trading secrets in this technical analysis video! From Forex forecast to Bitcoin trading, we've got you covered. Discover the latest trends and insights in the world of trading.
This secret is revealed in this video clip in straightforward terms and you can do it just by following the instructions in the video.
VISIT OUR LINK TREE on our profile: /tonyfx

Quick Update on Solana: $100 soon?Solana is still in a bearish trend. Be careful!
Here I present to you the levels and scenario that might happen

SOL-USDTI set the timeframe to two hours so that I can get confirmation on the hourly chart, because it's a lower timeframe ✌️
It has reached its support area at $126. If this level is broken on the hourly chart, the correction could continue down to $120 📉📉🔽🔽
However, if it forms two or three valid candles on this support, it could bounce back toward $134 🔼💲

A glimmer of hope.If we can get some bullish action above price 140, that combined with the oscillators moving up from the undersold area we could see a nice mean reversion from the 200 EMA(orange curve)


SOL-USDT
Solana has managed to break its downward channel and reach its first target at $136. This level now acts as Solana's first support 🔼✔️
Now, if this level holds, it could continue rising to $143. However, if this support breaks 📊📉
It could pull back to the broken trend line and then resume the upward move. These are the two current scenario possibilities.
I'll update you if there are any changes 🙂✌️💰💲

SOLUSDT — Move Down? (NY Session Shenanigans Edition)Alright, here we go — one more short idea for today… and then I promise I’ll touch grass. 🌿
SOL hit us with some premium NY session manipulation right out of the gate — classic “let’s stop out everyone before choosing a direction” behaviour.
Now it looks like price wants to slide down, so I’m taking the setup and calling it my final boss trade of the day.
Will it work?
Maybe.
Will it ruin my mood?
Also maybe. 😅
Let’s see how it plays out — trade safe, stay disciplined, and protect your sanity.
GL legends! ⚡️📉🔥

SOL: Very clear Head & Shoulders pattern visibility📊If we compare the D1 charts on BTC and Solana, we can see that on Solana's chart, we have a MUCH MORE clear image of the Head and Shoulders formation - that is why it is always worth spending extra time to compare the correlating charts to get the full picture if some evidence is missing or hidden under the market noise.
⚠️This might be an indication of a strong drop even further if the BTC major 75k support line were to collapse. Be cautious!

SOL-USDT
It is inside the same channel I told you about yesterday 💲💲
If it doesn't break above the top of the channel and the descending channel isn't broken 📊
The first support level is at $127, and if the correction continues, it might even go down to $121 🚨🔽
