SOL - Time for a pullback SOL - Time for a pullback
Before we take a new short we need a pullback and range
only after we can take a new short trade
Key resistance 171
Trade ideas

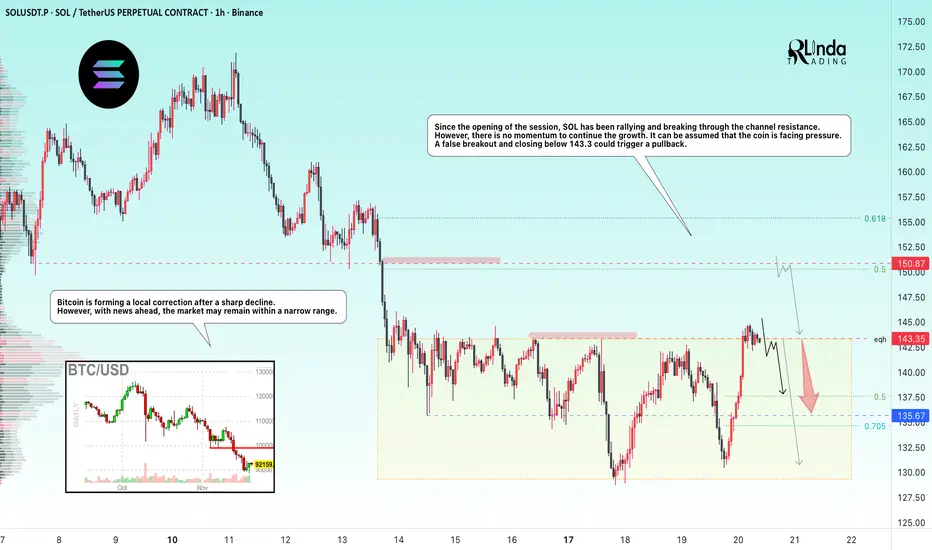
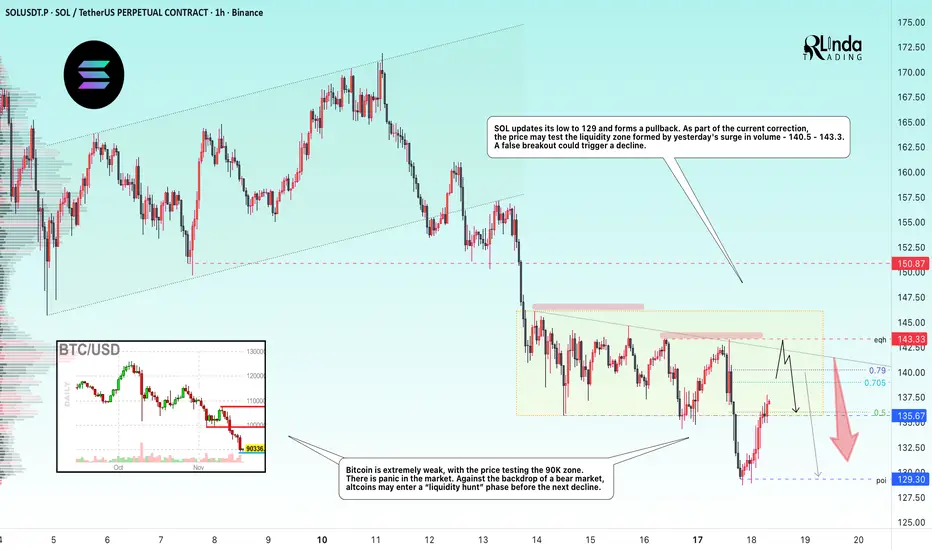
SOLANA → Manipulation - false breakout of resistance BINANCE:SOLUSDT.P flew up to resistance at 143.35 at the opening of the session and attempted to break through it, but bears may not let the price rise ahead of the news...
Bitcoin is forming a local correction after a sharp decline. However, news is ahead and the market may remain within a narrow range.
From the opening of the session, SOL rallies and breaks through the channel resistance, wasting 75% of its intraday growth potential. However, there is no momentum to continue the growth. It can be assumed that the coin is facing pressure. A false breakout and closing below 143.3 could trigger a pullback.
Resistance levels: 143.35, 150.87
Support levels: 135.67, 130.0
Two key levels for countertrend movement: 143.35 - 150.87. If the liquidity pool does not stop the price at the nearest level, then 150.87 can be considered as an additional level for trading a false breakout.
However, news on unemployment is coming soon, and the market may react quite aggressively. Therefore, if there are no trading opportunities before the news, I recommend refraining from action for an hour and waiting out the storm...
Best regards, R. Linda!
Solana monthly head and shoulders pattern Solana is showing a clear head and shoulders on the higher timeframe. A break of the neckline around $125 would see an eventual target of $60. This would represent a 50% reduction in price.

Final 2025 Forecast for SOLUSDT 21st November 2025 (Updated)1. Friday session dip to around ~$127
2. Pump to around ~$150 over the weekend and early next week
3. Final dump down to ~$113
4. Final pump to ~$230 to end the cycle
This idea does not indicate a massively new ATH but a topping out at the multi-cycle trend line from 2017.

SOLANA RETRACEMENT INCOMINGFollowing that impressive downward surge, a true force of momentum, we can reasonably anticipate a retracement upward to address those overlooked volume nodes left behind. Stay vigilant on the overall market structure; hold for a confirmed break, and cross-reference with the Cumulative Volume Delta (CVD) to time that short term pullback effectively. it's been a solid week so far, packed with solid setups, and the horizon promises even more to come.

SOLUSDT: Trend in 2-H time frameThe color levels are very accurate levels of support and resistance in different time frames.
A strong move requires a correction to major support and we have to wait for their reaction in these areas.
So, Please pay special attention to the accurate trends, colored levels, and you must know that SETUP is very sensitive.
BEST,
MT
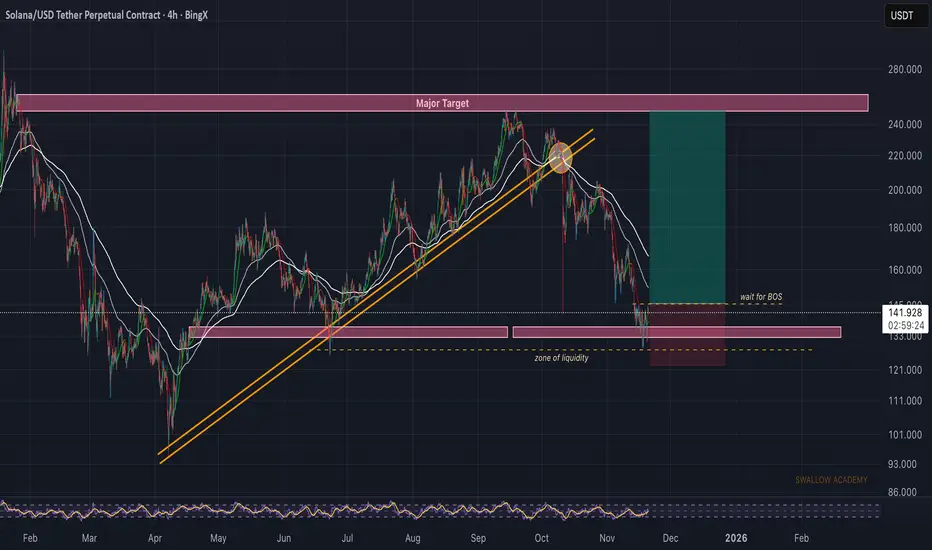
Solana (SOL): Looking For Proper Break of StructureSOL had a decent bounce from a liquidity zone, where buyers showed some reaction. For now we’re waiting for a clean BOS to confirm that buyers are actually stepping back in to fully overtake this area.
If we get that BOS, the plan is simple—look for a retrace entry and aim for the major target above (and maybe the EMAs as well before the major target).
Swallow Academy
SOL USDT LONG SIGNALSir📢 Signal
🔹 Currency pair:SOL.USDT
📉 Trade type:long
💰 Entry point:. Market
🎯 Targets (with withdrawal management):
▫️ TP1=145.60
▫️ TP2=150.20
▫️ TP3 =155.70
TP4=
TP5=
TP6=
🛑 Stop loss= 137.90
📊 Time frame:
⚖️ R/R:3.62
📌 Recommended leverage:.5 or 10
⚠️ Money management is required
Please log in after checking the chart

SOL-USDTIt was really tough 💰💰
But well, half of the path I was waiting for has gone up so far 📊
Today there's a resistance around 145 to 146 dollars, and if it breaks this, it could rise up to 154 🔼
The short-term support for Solana is at 138 dollars 🚀
SOLANA, November 15 Two Possible Correction Scenarios — One Outcome
In my view, Solana is currently forming a corrective structure.
At this moment, there are two scenarios:
🟧 Orange Scenario
The ABC corrective pattern has likely just completed, and Solana may follow the orange arrow toward 126 and potentially even lower.
🟪 Purple Scenario
The current flat ABC structure may actually represent wave A of a larger ABC correction — similar to what happened in Bitcoin right before its recent drop (see my recent BTC post where I expected 94K).
If this scenario plays out, Solana could first rise toward 144–146, and only then move down to 126.
I previously mentioned that I was waiting for Solana at 136 — and we’ve already seen that level.
I also expect 124, and possibly even lower.
But for now, I keep my short-term target at 126.
My global target is 112, but first, let’s see how exactly Solana approaches 126 — this will help confirm whether it truly intends to move below that level.
Let’s see which path Solana prefers — personally, I’m leaning toward the orange one.
⚠️Disclaimer: This is not financial advice or a call to action — only my personal vision.
🚀If you don’t want to miss updates, feel free to follow, leave reactions, or drop a comment.
Your support truly motivates me to continue posting regular Solana updates.

DeGRAM | SOLUSD held the $130 support level📊 Technical Analysis
● SOL/USD has created a false break below the dynamic support line while defending the 135–145 demand zone, signaling seller exhaustion.
● Price is stabilizing inside a descending channel; a rebound toward 160 is likely if buyers push above the short-term triangle breakout area.
💡 Fundamental Analysis
● Solana sentiment improves as ecosystem inflows rise and on-chain activity stabilizes, supporting recovery potential.
✨ Summary
Support: 135–145. Targets: 155 → 160. Medium-term bullish bias above demand zone.
-------------------
Share your opinion in the comments and support the idea with a like. Thanks for your support!

LongAccording to the analysis of the waves and the help of the Gann method, it can be expected that the price will return to the green zone again.
This is my personal opinion. Please don't use it as your trading criteria. Good luck

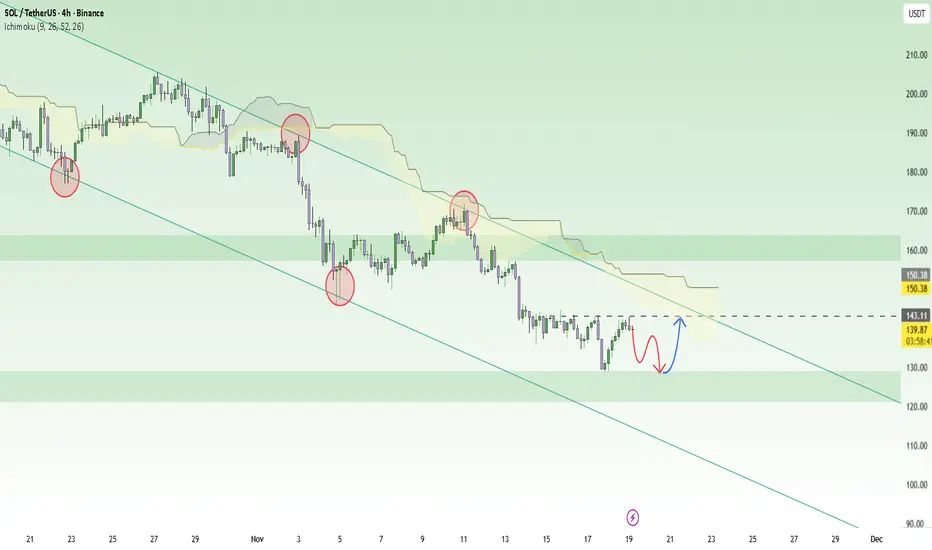
SOLUSDT: The Recovery is Gradually Being ConfirmedAfter a sharp decline, SOLUSDT is currently in the process of recovering and seems ready to return to strong upward momentum. Positive data from the Solana ecosystem is helping SOL regain momentum, and recent technical signals also support this trend.
The 4H chart shows that the price is reacting well at the 128.00 support level and has the potential to bounce from here. SOLUSDT is trading within a descending channel, but if it breaks above 139.00, the next target will be 143.00. Additionally, the Ichimoku indicator shows positive signals, with the Ichimoku cloud beginning to thin out.
The current trading strategy is to buy when SOLUSDT holds above 128.00 and breaks through 139.00, with a target of 143.00. Place a stop loss below 128.00 to protect your capital.
However, if the price fails to hold the 128.00 support and falls below it, the upward trend will be invalidated, and the price may return to a downtrend.
SOL update; Watch for a Bearish confirmation Price has almost reached the 4th low volume node. It started to reject low volume node 3 and began to show seller aggression. When finding an entry, look at your volume and Delta to confirm downside confirmation. waiting for a retracement back up to enter into a sell.

Market Update — Long Opportunities on BTC, ETH & SOL📊 Market Update — Long Opportunities on BTC, ETH & SOL
Using Pro Trading Indicator by Dr. Hafiz
After a sharp downside move across the crypto market, our Pro Indicator has detected fresh long signals from major demand zones on BTC, ETH, and SOL. Price has reacted strongly from discounted levels, indicating the possibility of a technical rebound.
🟢 BTCUSDT — Long Signal Activated
Entry: 89,640
Stop Loss: 88,349
Targets: 91,181 → 92,490 → 93,799
RR: 1:3.22
Analysis:
BTC formed a clean bullish reaction from a strong demand block. A higher-timeframe support is holding well, and the Pro Indicator signal confirms buying momentum. As long as BTC stays above 88,800, the recovery should extend toward 91,200 and above.
🟢 ETHUSDT — Strong Reversal Zone
Entry: 2,920
Targets: 3,020 → 3,097 → 3,160
RR: 1:4.47
Analysis:
ETH printed one of the cleanest reversal patterns today. A bullish engulfing candle formed directly at our mapped support zone. With ETH leading recovery movements historically, breaking 3,020 is key for continuation toward higher targets.
🟢 SOLUSDT — Demand Zone Bounce
Entry: 133.10
Stop Loss: 129.92
Targets: 136.60 → 139.67 → 142.75
RR: 1:3.03
Analysis:
SOL showed quick strength soon after touching the support area highlighted by our Pro Indicator. If SOL maintains above 130.40, bullish continuation toward the 137–143 range is expected.
📌 Summary
The market is currently reacting from major support zones after the panic drop.
Our Pro Trading Indicator by Dr. Hafiz has captured premium long setups with excellent RR ratios. If BTC continues to hold above its base, altcoins may follow with more upside.

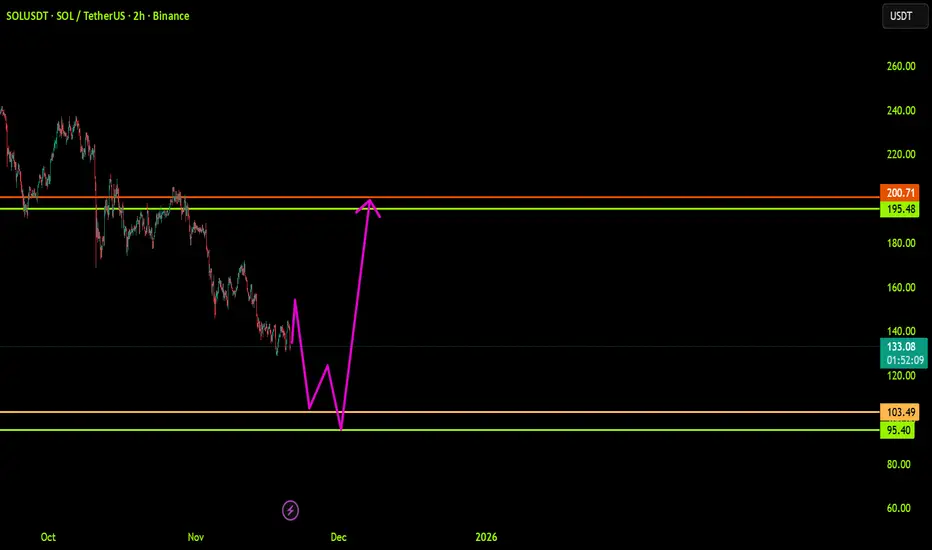
Solana full targets and realisticDear Traders,
here the realistic targets where solana can go lets see how this play out

SOL/USDT – Downside LoadingSOL/USDT – Downside Loading
The chart shows a prolonged distribution phase followed by a steady macro decline, with multiple structure breaks confirming a persistent bearish flow. After the earlier consolidation in the upper range, each attempt to reclaim previous highs has been met with a shift in momentum, leading to progressive downside sequences.
The recent breakout from the lower range transitioned into continued weakness, indicating sellers remain in firm control. Despite short-term rebounds, the overall behaviour reflects a market that is unwinding previous demand zones rather than building new ones.
At the current level, SOL is forming a tight corrective pattern, suggesting price is building liquidity before the next directional move. Given the broader trend context, this type of compression typically precedes continuation rather than full reversal. The chart’s projection implies a potential liquidity sweep on the minor rally, followed by renewed downside pressure once short-term buyers are exhausted.
Overall, the environment still favours the bearish continuation scenario unless the market shows a decisive shift in character backed by sustained strength — something not yet present.

SOLUSDT - 30M ANALYSISHey traders!
Based on the recent price action, SOL has finished a clean 5-wave impulse down, which usually signals the start of a correction. Right now the structure looks very much like a developing Zig-Zag:
- Wave A has played out,
- Wave B is close to completing,
- and I’m watching for a break of the B-wave resistance to confirm the start of Wave C to the
upside. If that happens, the next target zone sits around 146–150.
However, it’s important to keep the alternative in mind:
Wave B can still form as an expanded flat, meaning price could dip lower and even take out the Wave 5 low before reversing. If that happens, the bullish ABC idea is still possible — it just becomes a deeper setup.
So for now:
Keep an eye on how price behaves around the B resistance level, stay patient for confirmation, and don’t forget your risk management.
This is not financial advice — always DYOR.

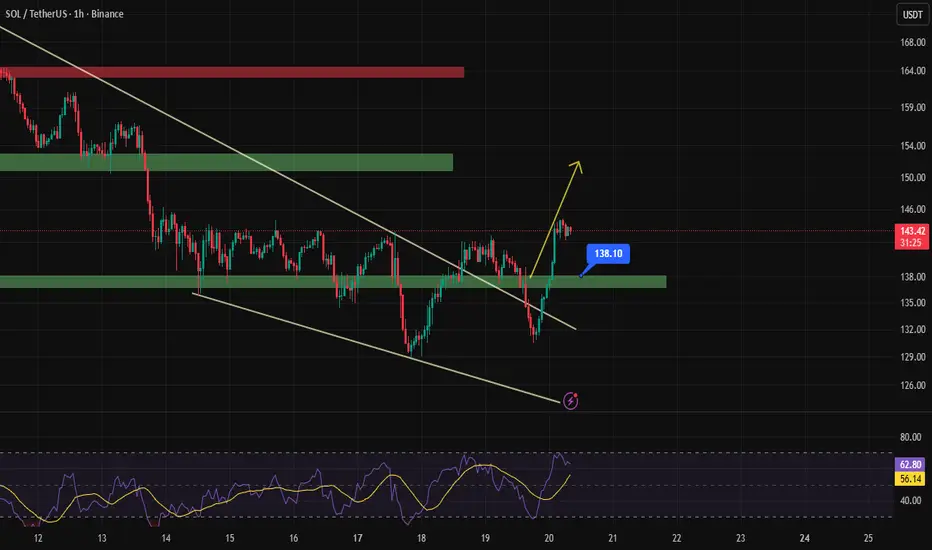
SOLANA → Hunting for liquidity in a weak market BINANCE:SOLUSDT is forming a countertrend correction. Zone of interest: 140.0–143.5. The lack of bullish potential and positive fundamentals could cause another decline...
Bitcoin is extremely weak, with the price testing the 90K zone. There is panic in the market. Against the backdrop of a bear market, altcoins may enter a phase of “liquidity hunting” before another decline.
Solana's price on D1 broke through fairly strong support at 141.3-138.5. The trend is bearish, and the breakout of support confirms the weakness of buyers (strength of sellers) at the moment.
SOL is updating its low to 129 and forming a pullback. As part of the current correction, the price may test the liquidity zone formed by yesterday's surge in volume - 140.5 - 143.3
Resistance levels: 139.0, 140.2, 143.3
Support levels: 135.67, 129.3
Consolidation is forming above the support range - 135.67. Most likely, bulls may flood the volume and provoke another rise to the liquidity zone, but there may not be enough potential for continued growth. A false breakout and lack of bullish momentum could trigger a decline to 135.5 - 129.3.
Best regards, R. Linda!
Structure trainingHello friends
Well, you see that a spike has been made by the sellers and a bearish structure has formed.
So, be careful that after each spike, the price needs to take a break, so it either suffers or pullbacks, spikes again, and continues.
Now the question is, how do we know when our downtrend is over?
You need to be careful and wait for the weakness of sellers and the strength of buyers, the important signs of which I will tell you.
The first sign is the last spike, which requires our bottom to be broken by sharp sellers and the price to be reversed by sharp buyers. Here it is important that we set a higher ceiling and break this spike formed by sellers, which is also called CHOCH in a correction, which means the same change in structure.
Our second sign is the lower lows, which is also very important and of great importance because it shows the advantage of buyers and helps a lot.
And in the price pullback we can enter the trade with risk and capital management.
Our stop loss is placed below the last low or the last spike that you said and the target is double that R/R=2
*The win rate of this strategy is also 60*
*Trade safely with us*

SOL at DemandGiven the recent dump in the entire crypto market, where we saw BTC drop from over $120k to about $90k, SOL also experienced a price decline from $260 to its current market price of about $136. However, amid the market chaos, SOL is showing signs of recovery for these two reasons:
1. The SOL ETF is the only ETF to record a net positive inflow during the period under consideration, mainly due to the Canary ETF listing. This is in contrast to the net outflows seen in both BTC and ETH ETFs over the same period.
2. From a technical analysis standpoint, SOL is at a crucial demand zone on the 1D chart. Therefore, we could expect a rebound above the recent high of $260.

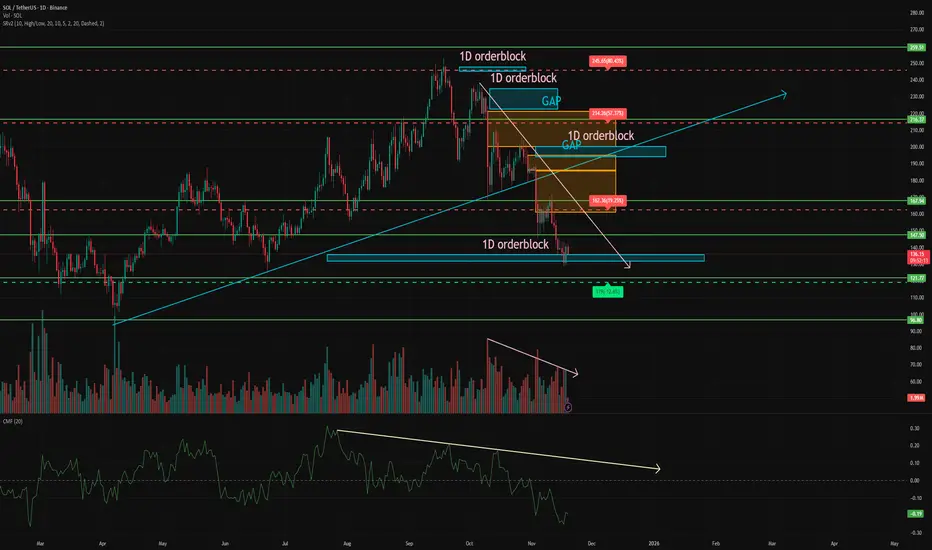
Why SOL is better than Bitcoin for the next months The market continues its powerful crash and while everyone is in panic, real traders use this as an opportunity to buy at a discount. And now I will explain why I am actively buying SOL on spot and why it is the best bet for the next months.
📈 In recent months, while Bitcoin has been dropping 4–5% a day, SOL has been holding strong and either falling by a smaller percentage or even growing by 1–2%.
Even today BTC is only 1–2% away from its local bottom, while SOL is 5–6% away.
This is largely due to the newly launched SOL ETF. While BTC and ETH ETFs are seeing record outflows, the SOL ETF has not had a single day of outflows yet. Despite the correction, people keep buying SOL.
➡️ As the correction in SOL continues, selling volumes keep decreasing, which shows that selling pressure is going down.
➡️ However, CMF shows liquidity outflows from the asset, which is natural for the market right now. So this is not a reason to panic.
➡️ During the drop, many gaps have also formed above the price. This means that in case of an upward move, the price will move quickly, without facing much resistance.
➡️ Right now the price has reached a large order block on the daily timeframe and has bounced. If the price holds above this level, the next key level is $147.
If not, a major support level is waiting around $121. A large demand zone has also formed around this level.
📌 Conclusion:
I do not think SOL will fly to a new ATH right now. But as an asset to accumulate on a dip, it is one of the best options at the moment, especially considering the fresh ETF inflows.
✍️ What do you think, does SOL still have a future, or is it already dead?
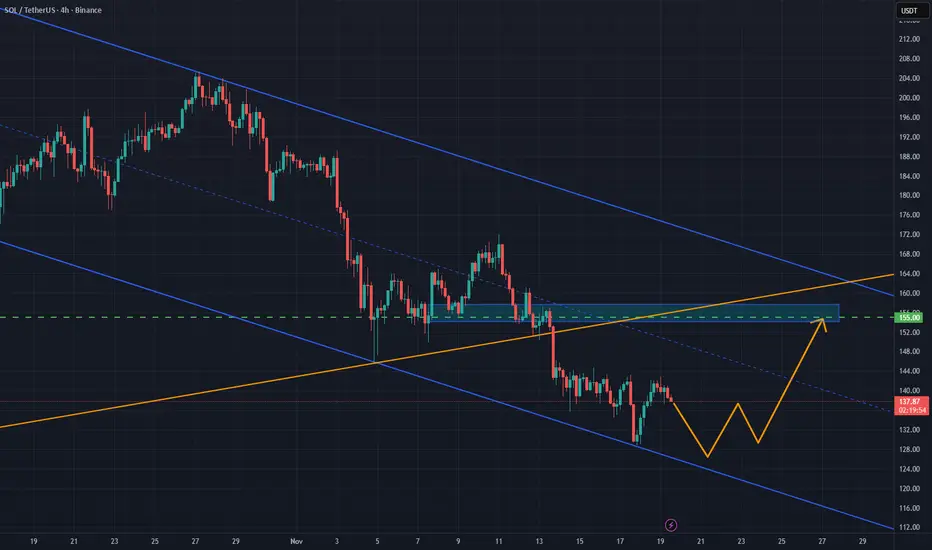
SOL/USDT: Relief Rally Builds After Rebound from Key SupportSOL/USDT bounced strongly from the 128–130 support zone, reacting off the lower boundary of its downward channel. While the broader trend remains bearish, this move signals early signs of accumulation. Holding above 130 could open a corrective rally toward 155, as oversold conditions unwind and short-term momentum favors a relief push.
❗️Risks:
– Losing 128–130 support reopens downside toward 120–115
– Volatility in BTC may cap gains
– Failure to reclaim the channel midpoint may stall the recovery