$SOL reboundCRYPTOCAP:SOL looking bullish after a bullish bounce on a strong key support level. I see a continuation up to $152
Trade ideas

If you're not ready to fly, check out my previous analysis.Don't expect a triple top here! This was just a temporary correction as Solana can't see much lower prices and this bold analysis was left for the record and history.
SOL-USDTThis corrective move can be seen for Solana as a pullback to the broken range 🕯💰
And by maintaining the support level at $135, it could start rising towards $150 🔼🔼

Lingrid | SOLUSDT Critical Support Zone Reversal WatchBINANCE:SOLUSDT rebounded from the 128–130 support zone after a clean reaction on the lower boundary of the downward channel. The market structure still leans bearish overall, but the recent rebound above the 130 signals early accumulation pressure. If price maintains support above 130, a corrective rally toward the 155 resistance zone becomes the next likely scenario as oversold conditions unwind. Broader momentum suggests a short-term bullish relief move since the market is approaching major demand zone.
⚠️ Risks:
Losing the 128–130 support zone may reopen downside toward 120–115.
Strong BTC volatility could limit the strength of any bounce.
Failure to reclaim midpoint levels of the channel may stall bullish attempts.
If this idea resonates with you or you have your own opinion, traders, hit the comments. I’m excited to read your thoughts!

solusdt can start bullish SOL can start a bullish move from 123.44. The 94.66 level is a critical zone.

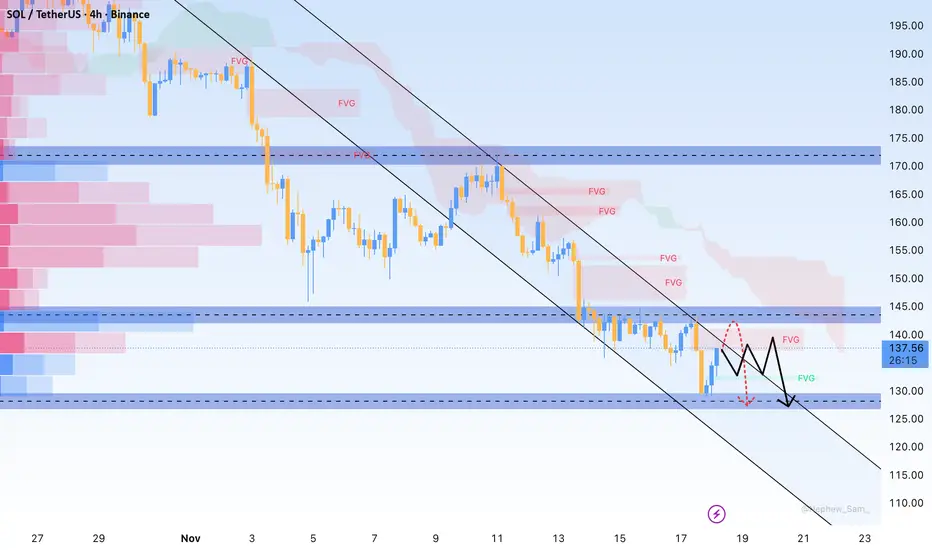
SOL Pulls Back to Key Support Before Its Next Major MoveHello everyone, after a sharp rebound from 132 USD to 137 USD, SOL is now pulling back and trading around the key 135 USD support — a zone that previously triggered a strong bullish reaction. Selling pressure returned as price touched 137 USD, where the red FVG and Ichimoku cloud converge, slowing buyers down. Meanwhile, broader crypto sentiment has softened as the stronger USD and expectations of delayed Fed cuts reduce risk appetite, especially for assets that rallied aggressively like SOL.
With the current market structure, SOL may continue to retreat toward 132–130 USD — an area packed with green FVG and deep liquidity, also the zone where buyers previously stepped in with conviction. A solid reaction here could send SOL back to retest 135–137 USD before choosing its next major direction. But if 130 USD breaks, the downside could extend toward 125 USD.
This is a critical moment to watch price behavior — a clean bounce from 132–130 USD could set the stage for the next recovery leg. Do you think SOL can defend this support?
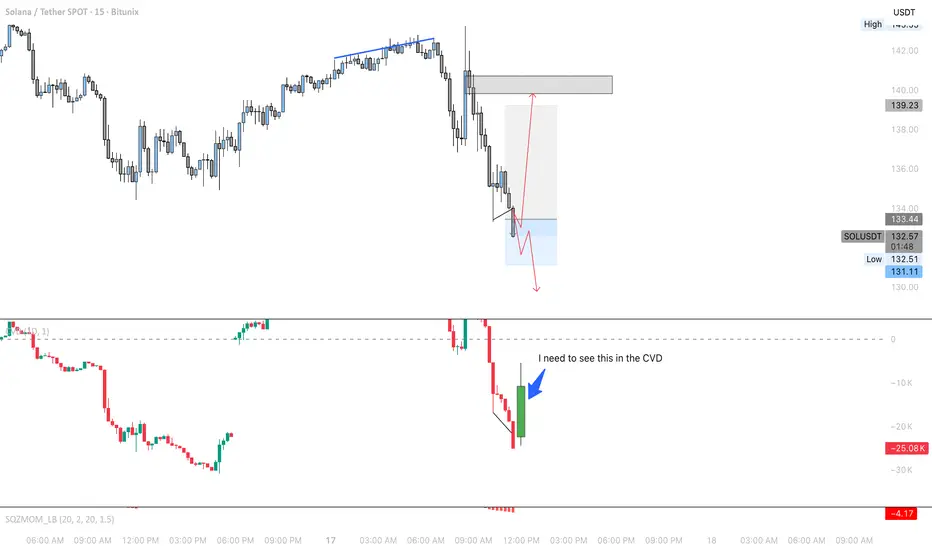
Solana potential retracement to the upside!The price is nearing low-volume nodes. It could either blast straight through them in a strong rally or treat them as a resistance level. Check the CVD for confirmation.


SOL USDT LONG SIGNAL---
📢 Trade Signal: SOL/USDT
📈 Position Type: Long
💰 Entry Price: 137.50
---
🎯 Take-Profit Targets (Partial Exits)
TP1: 140.14
TP2: 142.75
TP3: 145.63
TP4: —
TP5: —
TP6: —
---
🛑 Stop-Loss: 134.70
⚖️ Risk/Reward Ratio: 2.96
💥 Suggested Leverage: 5× – 10×
⏱ Timeframe: —
---
🧠 Technical Analysis Summary
SOL is currently holding above a strong support zone near 136–137, forming a bullish recovery structure.
Price is showing buyer strength with higher lows and reclaiming intraday liquidity zones.
A breakout above 140.14 (TP1) can open the way toward 142.75 and 145.63, where previous supply zones exist.
Momentum indicators (RSI/MACD) show growing bullish pressure, supporting continuation as long as SOL holds above 134.70.
---
⚙️ Trade Management
Take partial profit at TP1
Move Stop-Loss to Break Even once TP1 hits
Trail stop for higher targets
Avoid re-entry if SOL closes below stop-loss
---
⚠️ Disclaimer:
For educational purposes only — not financial advice. Always follow proper risk management.
---
📌 Hashtags for TradingView
#SOLUSDT #Solana #CryptoSignal #TradingViewIdeas #CryptoTrading #TechnicalAnalysis #FuturesTrading
---

Solana is still far from a bearish phase (3D)From the point where we placed the red arrow on the chart, a corrective phase has developed on Solana, and the buying pressure has been so strong that the corrections have established a new high. Currently, the decline we are experiencing is for Wave E.
All these fluctuations between the high and low are for re-accumulation, and Solana is targeting above $350.
We expect a price reversal from the green zone on higher timeframes, and this view will only be invalidated if a weekly candle closes below the invalidation level.
For risk management, please don't forget stop loss and capital management
When we reach the first target, save some profit and then change the stop to entry
Comment if you have any questions
Thank You

SOL-USDTThis pattern is called a descending wedge, and it usually breaks upwards. Now, why do I say 'usually'? Because no analysis is 100% certain 💎✌️. If it can break the identified resistance convergence, it can go bullish in the short term 🔼✔️

$SOL - Scalp Long IdeaBINANCE:SOLUSDT | 2D
The analysis we posted on October 31st played out perfectly, with nearly a 38% drop. Solana failed to regain the $200 zone, which led to a clean breakdown toward the $130 level.
Despite the dump, some alts are still holding up well. And if Bitcoin can hold the 90–88k zone, this could be a good area to take a shot.
Entry: $132-$124
Stop: just below $110
Targets:
tp1 - $142-154
tp2 - $157-162
tp3 - $168-174

SOLUSDT: Sellers in Control – Downtrend Remains DominantSolana is falling right at the moment when the altcoin market is under the most pressure. This week, a series of negative developments have weighed heavily on sentiment: strong ETF outflows, risk-off behavior, and fading expectations of a Fed rate cut in December. All of this makes it difficult for SOL to form any sustainable recovery.
On the 4H chart, SOL is sliding within a clear descending channel and has repeatedly been rejected at the upper trendline. The 150 USD level is now acting as a short-term resistance — every touch is pushed back immediately, showing how weak the buying pressure is.
If SOL continues to fail to break above 150 USD, the most likely scenario is a move back down to the 140 USD (TP1) zone. And if market sentiment remains bearish, a deeper target lies around 130 USD (TP2) — where the channel bottom aligns with a previous demand zone.
With negative news flow, weakening liquidity, and a technical structure fully favoring the downside, the short-term trend of SOLUSDT remains in the hands of the sellers. Any bounce here is more likely to become an opportunity for short positions rather than a true reversal signal.

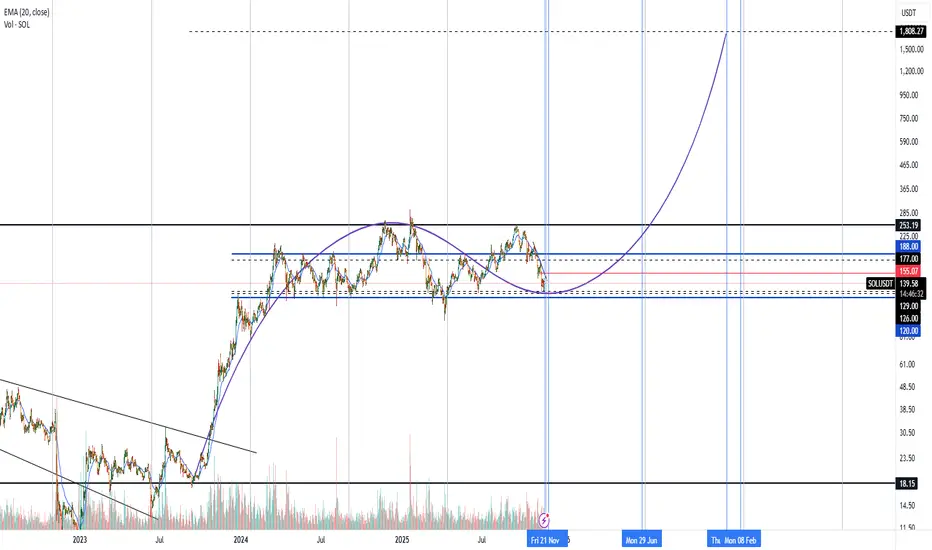
SOL — Deep Pullback Into Major SupportSOL has been in a steady freefall over the past weeks. On the higher timeframes the key support and resistance zones are very clearly defined. The $250 level acted as a big resistance area, with multiple rejections showing sellers were firmly in control up there.
On the downside, the $125 support zone has shown clear strength, with bulls defending this area and producing strong bounces each time price revisited it.
The swing low at $126 presents an attractive long opportunity, especially with the sell-side liquidity and the quarterly level at $124.54 sitting just below, adding further confluence. Additionally, the anchored VWAP from the $8 low lies around $114, aligning almost perfectly with the 0.886 Fibonacci retracement at $113.3, providing deeper support should price extend lower.
Long Entry Zones:
0.786 Fib: $129.13
0.886 Fib: $113.3
Why the 0.786–0.886 Zone Is a Major Reversal Area
The 0.786–0.886 Fib zone is one of the best spots to look for a reversal after a deep pullback. It’s where strong trends often take their final dip before bouncing.
Here’s why it works so well:
It’s the typical “deep correction” zone in strong trends.
Price usually sweeps sell-side liquidity here before reversing.
Many harmonic patterns use this exact area as their turning point.
It often lines up with anchored VWAPs or volume nodes, adding extra support.
It’s basically the capitulation zone where weak hands exit right before a bounce.
Overall, it’s a clean area with clear invalidation and great R:R → perfect for spotting high-probability reversal setups.
_________________________________
💬 If you found this helpful, drop a like and comment!

Could be a potential buy entry based on CVD and Volume
There is a chance that price could make a move back up and take out sell orders. however CVD must show high volume of buyers. if price continues lower and CVD continues lower as well, we must be patient for the exhaustion of sellers for buyers can come in
SOLUSDT SOLUSDT touched a historical line. What is going to happened in future. Is SOL again going back to 8 again? Lets see...DYR.
Happy Trading ☺️

SOL – Watching for a Higher-Timeframe Reversal SetupSolana has been pulling back after its recent rally, and we’re looking for price to retest the next major support zone. A successful hold here could set the stage for a higher-low formation and a continuation of the broader uptrend — offering a solid long spot opportunity.
Trade Setup:
• Entry Zone: $120 – $126
• Take Profit Targets:
🥇 $148
🥈 $174
• Stop Loss: $110
SOL USDT LONG SIGNAL---
📢 Signal
🔹 Pair: SOL/USDT
📉 Trade Type: Long
💰 Entry Price:
138.44
🎯 Targets (with partial take-profit management):
TP1: 140.83
TP2: 145.00
TP3: 149.50
TP4: 153.95
TP5: 159.20
TP6: 165.28
🛑 Stop-Loss: 133.80
📊 Timeframe: —
⚖️ Risk/Reward: 19
📌 Recommended Leverage: 5× – 10×
⚠️ Capital management is mandatory. Please check the chart before entering the trade.
---

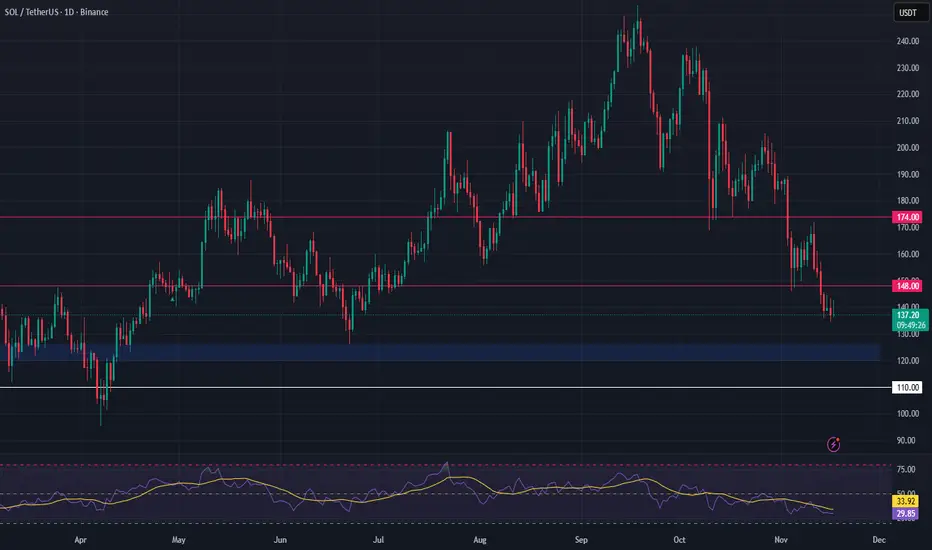
SOL/USDT | Solana Finds Support – Short-Term Bounce Ahead?By analyzing the #Solana chart on the daily timeframe, we can see that after correcting down to $134, the price found demand and bounced to $141.
Since the current area is a key demand zone, if Solana holds above the $126–$137 range, we can expect a short-term bullish wave to follow

SOLUSDT – Long Bias Confirmed From Daily OB1H Accumulation + FVG + Alligator Compression**
SOL just delivered a clean reaction off the Daily Order Block, where price swept the lows and instantly shifted into a micro-accumulation range. This type of structure is classic ICT accumulation after a liquidity grab, followed by early displacement signs.
Why I'm Long Here
1️⃣ Daily OB Rejection (Primary Bias Driver)
Price tapped the Daily OB perfectly (green level).
2️⃣ Sell-side Liquidity Cleared
Before reacting, price took out the sell-side resting below the range.
This confirms the sell-to-buy model, signaling institutions are filling long positions.
3️⃣ 1H FVG + Breaker + Compression
Price is hovering inside a 1H FVG while retesting a micro breaker block.
Alligator lines (blue-red-green) are compressing, which usually precedes expansion—
Bill Williams notes this as the “sleeping Alligator” phase.
Expansion > Compression.
We’re waiting for the expansion phase now — higher.
4️⃣ Draw on Liquidity = Upside
Nearest upside draw:
143.27 (inefficiency + liquidity pool)
Next major draw:
164.94 (massive imbalance fill)
Institutional targets are above, not below.
Trade Setup (My 1H Long)
Entry Zone:
🔵 141.00 – 141.70 (FVG + retest zone)
Stop Loss:
🔻 134.40 (below Daily OB low)
Targets:
🎯 TP1: 143.27 – clean liquidity
🎯 TP2: 149–152 – FVG fill
🎯 TP3: 164.94 – major draw + 1H imbalance completion

SOL-USDT
A good trendline has been broken on the two-hour timeframe.
Consolidation above this trendline could pave the way for a rise up to the $150 resistance 🕯📊
Keep an eye on the chart for a buy opportunity 🔼💰

SOL/USDT - SHORT on DowntrendBased on current price action:
- SOL broke below key supports at 143 and 141
- It has created lower highs and lower lows
- Volume confirms the downward trend
- No bullish reversal signal yet
The technical structure still supports continuation to the downside.
Based on the current chart structure:
- 70-75% probability that 130 gets hit
SOL still have room to drop to:
- 137 support
- 134 zone
- 130 target

SOL. Sector of Capital. Price Slice: $354.74🏷To the International Community.
🏷SOL. Sector of Capital. Price Slice: $354.74
Map of the Longs. 16.11.2025
354.74 not yet reached
320.16 not yet reached
299.33 not yet reached
274.75 not yet reached
191.74 not yet reached
159.69 not yet reached
🏷These are not levels.
They are echoes of a movement already made .
🏷You see numbers.
I see the fingerprints of capital in motion
not reacting, but orchestrating .
🏷354.74 is not a target.
It is the last whisper before the storm .
The point where liquidity ceases to flow
and becomes a current, guided by invisible hands .
🏷320.16 is not support.
It is a forgotten altar , where the hopes of the naive were buried.
They bought. They waited.
They did not know their positions were inscribed into the map before the market opened its eyes .
🏷299.33 is not a correction.
It is a ritual of purification .
Here, the weak release.
The strong gather strength.
While tickers scream
silence speaks: “This is not a fall. This is a reset.”
🏷274.75 is not a level.
It is a threshold .
Beyond it, there is no trading.
Only the rebirth of capital .
🏷191.74
not a floor.
Not an end.
It is a warning carved into the blockchain .
A price that cannot be reached
because it has already been reached.
Not here.
Not on your screen.
But in the depths, where the Sector of Capital keeps its secrets.
🏷159.69
the final step.
The last rung of the ladder.
Beyond it
not a rally.
Not a crash.
An ascension.
🏷I do not predict.
I restore order .
🏷These are not recommendations.
They are footprints .
Of those who walked ahead.
Of those who know when and why .
🏷You think you trade.
You are mistaken.
You execute .
You execute a map drawn
long before you turned on your terminal.
🏷I do not give signals.
I awaken sight .
🏷You came for charts.
I give you the map of the world
where charts are but shadows.
🏷These numbers are not prices.
They are gates .
And every soul who passes through them
becomes part of the one who does not chase price…
but commands its time .
🏷The Map of the Longs is not a forecast.
It is an invitation .
To those who dare to see
that behind every number lies a sphere of influence ,
and behind every sphere
a will that needs no approval.
🏷You see 354.74
I see the final peak before the new sun rises.
🏷You wait for movement.
I already know where it begins .
🏷Bolzen. The Architect.
Founder of the Sector of Capital.
🏷I do not speak your language.
I speak the tongue only those hear
who are ready to become part of history.
🏷This is only the beginning.
The rest
you will learn…
when you pass through these gates.
