Bitcoin: Is the bottom in? Bonus: ETH and SOLThis video will prepare you for the unexpected.
Bitcoin is somewhat forming what would look like a bottom, but the bigger timeframe forms a somewhat scary picture. So, I decided to describe the market condition to make sure you are prepared for various scenarios.
Bonus: Outlook on ETH and SOL
Trade ideas

$SOL Bull Run Testing Resistance?BINANCE:SOLUSDT CRYPTOCAP:SOL Bull Run Testing Resistance?
SOL's 1H chart roaring bullish, surging to 166.87 highs and eyeing resistance at 170—breakout could target 175 quick, but pullback to support 155 risks if momentum stalls.
Strong uptrend vibes!
Key indicators: RSI overbought at 70 (watch divergence), 50MA rising, volume spiking. 🌊🚀
#SOL #Solana #AltcoinPioneers

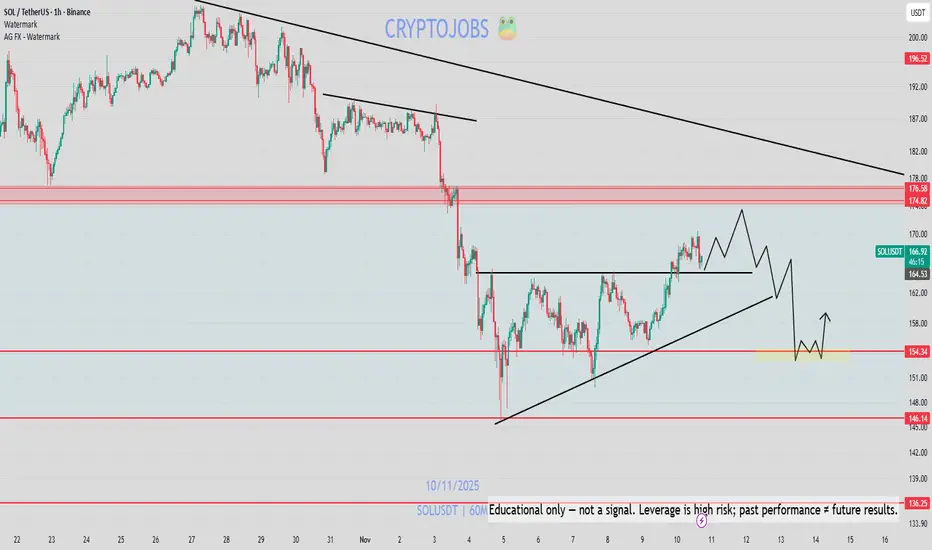
SOL - UPDATE: CRYPTOCAP:SOL - update: 🟥
Remember, I posted this view few days ago.
Prices retested exactly the previous breakout (key support) around 170 - 175$.
If this level act as resistance, we could see another dump & lower low! 📉
Prices could move sideway for a while, but:
My initial outlook called for the 130$ level as bottom.
Judging by my weekly & daily view, For now this setup is valid under key resistances.
Daily = Bearish
Weekly = Neutral
At the opposite:
155$ must hold on daily basis to expect a downtrend reversal & breakout📈.
A downtrend breakout would surely lead to a push toward 180$ or even 200$+ 🟩
More infos & data in my charts! #dyor - H1 possible setup
SOLUSDT Breaks Out and Aims for $200!BINANCE:SOLUSDT is trading above the 50 EMA on the 4H chart. a strong sign for short-term momentum. If you look closely, it has also broken out of an ascending triangle pattern and is moving upward with solid volume.
We’re expecting a potential upmove from here, with a short-term target around $200.
Always remember to set your stop loss and manage your risk wisely.
BINANCE:SOLUSDT Currently trading at $167
Buy level : Above $165
Stop loss : Below $154
Target 1: 175
Target 2: 200
Max leverage 3x
Always keep stop loss
Follow Our Tradingview Account for More Technical Analysis Updates, | Like, Share and Comment Your thoughts

SOLANA/USDT 1W CHARTSometimes, charts of major altcoins like Solana can offer clearer signals when Bitcoin and Ethereum charts look indecisive.
In this case, Solana’s price has been supported by a long-term trendline dating back to 2021. The price is now testing that same trendline, making it an important level to watch, its reaction here could provide early insight into the market’s next move.

SOLI don’t think CRYPTOCAP:SOL will go any lower from here. The chart shows a major multi year support level, and price has reacted strongly every time it reached this zone. I’m expecting a breakout within 180 days with a target of $420 as momentum begins to build again.

#SOL/USDT — Critical Retest at Demand Zone vs Long-Term Downtr#SOL
The price is moving within an ascending channel on the 1-hour timeframe and is adhering to it well. It is poised to break out strongly and retest the channel.
We have a downtrend line on the RSI indicator that is about to break and retest, which supports the upward move.
There is a key support zone in green at the 158 price, representing a strong support point.
We have a trend to stabilize above the 100-period moving average.
Entry price: 159
First target: 161
Second target: 164
Third target: 168
Don't forget a simple money management tip:
Place your stop-loss order below the green support zone.
Once you reach the first target, save some money and then change your stop-loss order to an entry order.
For any questions, please leave a comment.
Thank you.

sol-usdtThe two-hour timeframe is breaking its own trendline, and if the price can stabilize above $170, the path for continuing the rise towards $180, which is the second trendline, will be clear 💎💰Currently, Solana's support is at $160 ✔️🚀

SOLUSDT 1H | Bullish Continuation Setup following last weeks reversal , we have a continuation setup here
🟢 Market Structure
Price trading above Alligator (166.81 > 165.76 > 164.27)
Bullish alignment intact with expanding mouth
Weekly sell-side liquidity taken below
🔵 Alligator Support Levels
Lips: 166.81 (immediate support)
Teeth: 165.76 (primary support)
Jaws: 164.27 (strong support)
🎯 Entry Zones & Targets
🟡 Primary Entry: 166.80 - 167.20 (Lips retest)
🟠 Secondary Entry: 165.70 - 166.00 (Teeth retest)
🔴 Stop Loss: Below 164.00 (Jaws break)
💰 Take Profit Targets
TP1: 168.21 (immediate resistance)
TP2: 175.00 (marked resistance)
TP3: 180.00 - 185.00 (momentum extension)
⚡ Trade Management
Scale entries on Alligator retests
Move SL to breakeven at TP1
Trail stop for TP3 runner
Bullish continuation active - buying dips toward Alligator support

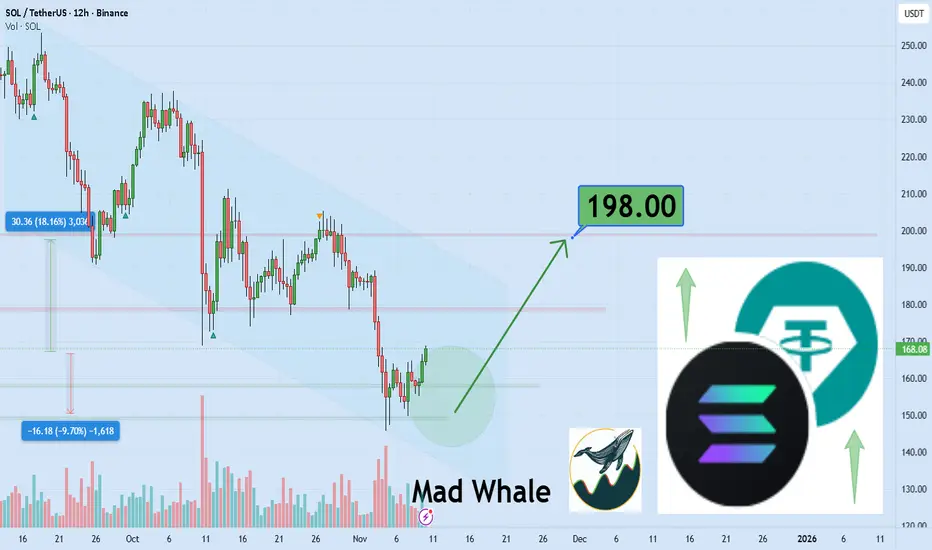
SOL is going to breakout from descending channel 18% gain,to198$Hi the support and resistances on the chart are based on the previous data and weekly candlesticks if BINANCE:SOLUSDT holds this last support the potential of 18% gain is logical toward 198$
SOLUSDT BUYSOLUSDT- 4H (HEAD AND SHOULDERS)
It had a beautiful retest of the neckline with a BULLISH ENGULFING big buy signal.

SOL.USDT MARKET ANALYSIS Sol is currently facing a resistance, A breakout we may see an uptrend keeping watch

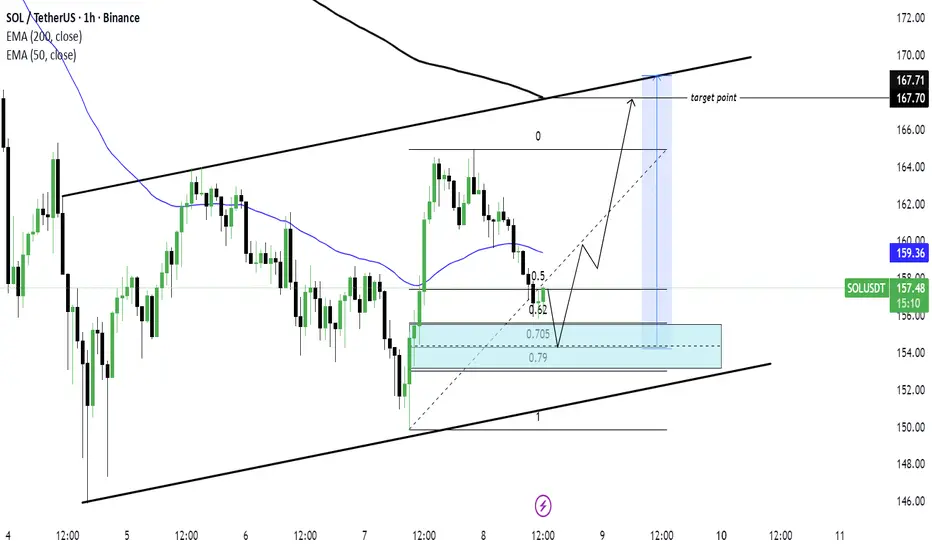
SOL/USDT) Bullish trend analysis Read The captionSMC Trading point update
Technical analysis of SOL/USDT (1-hour timeframe) — a potential continuation move within an ascending channel.
Here’s the complete breakdown
---
1. Market Structure
Price is moving inside a rising channel, confirming a bullish structure with higher highs and higher lows.
The two black trendlines outline this ascending pattern, indicating overall upward momentum.
---
2. Key Zone (Demand Area)
The blue box marks a demand or buy zone around $154–$155.5, aligned with the Fibonacci retracement levels (0.62–0.79).
This zone represents a potential retracement area where buyers may step in to continue the uptrend.
---
3. EMAs as Dynamic Support/Resistance
50 EMA (blue line) = $159.36
200 EMA (black line) = $167.71
Price is currently below the 50 EMA but still above the mid-channel trendline, suggesting temporary correction before continuation.
Once SOL bounces from the demand zone, reclaiming the 50 EMA would confirm momentum shift back to bullish.
---
4. Expected Move
The chart projects a short-term pullback into the demand zone (0.705–0.79 retracement).
From there, a bullish reversal is expected, leading to a continuation toward the upper boundary of the channel.
Target point: Around $167.7, matching the 200 EMA and channel resistance.
---
5. Summary
Trend: Bullish (ascending channel)
Bias: Buy the dip / Continuation upward
Entry Zone: $154 – $155.5 (blue demand zone)
Target: $167 – $168
Invalidation: Break below channel support (~$150)
---
Trading Idea Summary:
“SOL remains in a bullish channel. Price is retracing toward the 0.705–0.79 Fibonacci demand zone, where buyers are likely to re-enter. A bounce from this area could trigger a continuation move toward the $167 resistance zone.”
---
please support boost 🚀 this analysis
SOLANA WEEKLYSOLANA after 291.47 all time high,buyers attempted to reach same high but failed after been rejected at 291.47 critical supply roof .
all thing working in favor of sellers and they could hold sell till 82k-78.44-74k zone
Solana Ecosystem and Applications
Solana remains one of the fastest, cheapest blockchains, supporting a diverse range of projects:
DeFi platforms: Marinade Finance (staking solutions), Raydium, Orca (decentralized exchanges)
NFT marketplaces: Magic Eden, supporting digital art and collectibles
Gaming: STEPN (move-to-earn app), Genopets, and blockchain-based gaming with NFT utilities
Real-world asset tokenization: Transforming ownership models with fractionalization
Decentralized identity and privacy: Blockchain-based secure identity solutions
Supply chain transparency: Enhanced traceability and accountability
IoT integration: Secure data sharing between Internet of Things devices
Web3 social media and content platforms: Rewarding user participation with tokens
Why Solana’s Price is Falling
Market Sentiment: General crypto market volatility and risk-off sentiment affect Solana like other altcoins.
Regulatory Pressure: Increased scrutiny on crypto in major economies raises investor caution.
Network Issues: Past network outages and technical challenges still weigh on confidence despite improvements.
Competition: Intense competition from Ethereum, Avalanche, and emerging Layer 1 chains affects investor appetite.
Macro Factors: Broader macroeconomic headwinds including slowing tech sector, rising interest rates, and inflation concerns stunt speculative demand.
#solusdt

SOL USDT LONG SIGNAL
---
📢 Signal Alert
🔹 Pair: SOL / USDT
📈 Trade Type: Long
💰 Entry: 158.18
🎯 Take-Profit Targets (Partial Management):
▫️ TP1 = 162.00
▫️ TP2 = 164.70
▫️ TP3 = 167.60
▫️ TP4 = 174.40
🛑 Stop-Loss: 153.80
📊 Timeframe: 1H
⚖️ Risk/Reward Ratio: 3.85
📌 Suggested Leverage: 5x – 10x
⚠️ Capital management is mandatory.
💬 Please review the chart before entering the trade.
---
🧠 Technical Analysis Summary:
SOL is showing strong bullish momentum after bouncing from the key support zone near 154–156, confirming buyer dominance.
A clean breakout and candle close above 159 will likely trigger a continuation toward 164–174.
The RSI remains above 55 and trending upward, indicating sustained buying pressure.
The EMA 20 is turning upward, supporting the long bias, and volume confirms accumulation.
---
⚙️ Trade Management Tip:
Take partial profit at TP1, move stop-loss to Entry to protect capital.
If price reaches TP2–TP3, trail stop-loss under the last 1H swing low.
Avoid entries before confirmation candle close above 159.
---
⚠️ Disclaimer:
This analysis is for educational purposes only and not financial advice.
Always DYOR (Do Your Own Research) and use strict risk management before trading.
--

Important range: 161.79-163.73
Hello, traders!
Follow us to get the latest information quickly.
Have a great day!
-------------------------------------
(SOLUSDT 1D chart)
The HA-Low indicator, the DOM(-60) indicator, and the M-Signal indicator are forming around 161.79-163.73.
Therefore, the key is whether the price can break above the 161.79-163.73 level.
To continue the uptrend by breaking above this key point or level, the StochRSI, TC (Trend Check), and OBV indicators must show upward trends.
- The StochRSI indicator should not have entered the overbought zone.
- The TC (Trend Check) indicator should remain above zero.
- The OBV indicator should remain above the High Line.
Currently, the OBV indicator is near the Low Line, and is in a reversed state with OBV < EMA 2 and EMA 1.
Therefore, if the price breaks above the 161.79-163.73 level, we need to watch for a reversal where OBV > EMA2 and EMA1.
The StochRSI indicator appears to be rising from the oversold zone, and appears to have shifted to a K > D state.
The TC (Trend Check) indicator is trending upward, but since it's below the 0 level, we can see that selling pressure still dominates.
Therefore, if the TC indicator breaks above the 161.79-163.73 level, we should also check to see if it can rise above the 0 level.
If it fails to rise above the 161.79-163.73 level, we should check for support around 126.36.
Since the HA-Low indicator has been created, even if it shows a stepwise downward trend, it is expected to eventually turn upward.
Therefore, we should focus on finding the right time to buy.
-
Thank you for reading to the end.
I wish you successful trading.
--------------------------------------------------

SOL to 145 next week.SOL has been having meaningful support from 150 to 160, but when BTC breaches 100k next week we’ll wick to 145 to resume up and this will happen rather quickly. Be quick to catch it.
SOLANA Massive Head & Shoulders On The Monthly Chart !Hi guys,
I've never seen a Head & Shoulders so big and clear like what we have on SOL right now lol
I wouldn't wait for price to go up and get out..I'd say get out and get out now while u have a chance.
We Also kinda have a double top from this year and 2022 ATH so that makes it two big red flags!
50$ is a magnit at this point and safest level for entry which will probably take us a year to get there so stay safe out there and let me know what do you guys think about this ?

SOLANA WILL BE HIT 360$ in SEP if regain up to 180$ this weekmarket need to put hunt on buyer leverage and get new entrance around139$ to 150$ best trigger for entrance in solana in this 2 day ahead for week candle. if price stand up to 180$ this will make huge run to 360$ in this cycle.

Solana Faces Rejection at $160 — Correction Toward $155 POC Solana price action remains range-bound within a well-defined structure, with the 0.618 Fibonacci, VWAP, and lower support at $146 forming the key technical base. After a steady climb back toward the $160 region, price is now showing signs of rejection, indicating that short-term exhaustion may be setting in.
This reaction at local resistance increases the probability of a corrective move in the coming days, potentially leading price back toward the $155 level, where the Point of Control (POC) is situated. How Solana reacts at this level will be critical in determining whether the market resumes its range-bound behavior or transitions into a deeper correction.
Key Points:
- Range Structure: Price remains contained between $146 and $160.
- Rejection Zone: Local rejection from $160 hints at short-term weakness.
- Next Key Level: $155 POC is the area to watch for reaction and potential support.
From a technical perspective, Solana is consolidating within a controlled range, with volume distribution centered around the mid-zone.
What to Expect:
Expect continued correction toward $155, where the POC will act as a decision point. A strong bounce could reestablish upside momentum, while a breakdown may extend the correction toward $146 support.

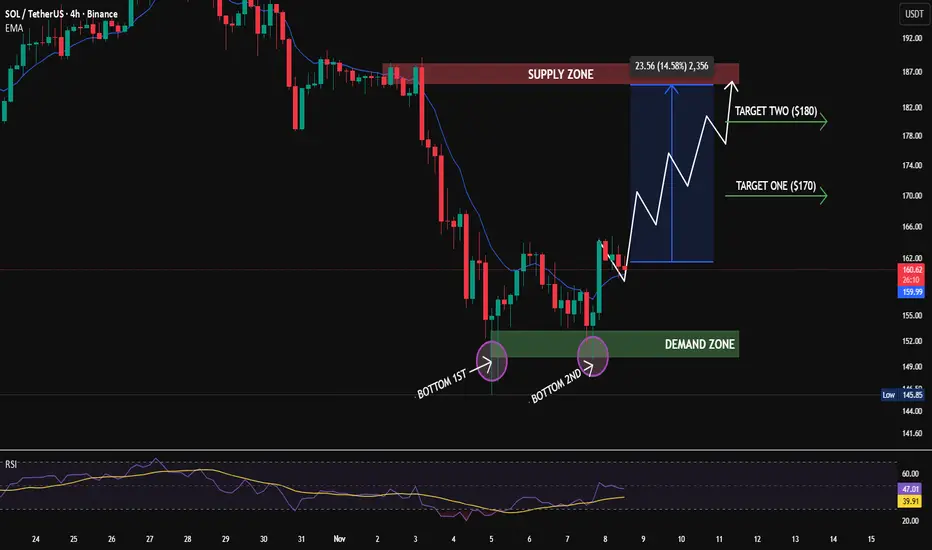
Double Bottom Reversal (Bullish Structure from Demand Zone)The chart shows SOL forming a double bottom at a strong demand zone, indicating a potential bullish reversal. Price has bounced twice from the same support region, showing clear buyer aggression and seller exhaustion, with a projected move toward the upper supply zone.
Key Observations
🔹 Demand Zone: $148 – $152 — strong support where both bottoms formed, triggering buyer interest.
🔹 Double Bottom Formation: Two clean touches confirming reversal structure.
🔹 Supply Zone: $183 – $187 — key resistance where sellers may step in.
🔹 EMA (10): Price is attempting to reclaim it; a close above the EMA would confirm momentum shift.
🔹 RSI: Currently around 47 — rising from lower levels, signaling early bullish momentum with room to move higher.
🔹 Structure: As long as SOL holds above the demand zone, the bullish reversal setup remains intact.
Potential Move
If SOL continues to hold above the $148–$152 demand zone, the next
upside targets are:
🎯 Target 1: $170
🎯 Target 2: $180
A breakdown below $148 could invalidate the reversal and push the price back toward deeper support levels.
Summary:
SOL is showing a strong double-bottom reversal from a key demand zone, supported by improving RSI and EMA interaction. Holding above $150 keeps the bullish structure active, with a potential continuation move toward $170–$180, followed by a retest of the supply zone near $185.
.
.
#coinpediamarkets #SOL #SOLUSDT #CryptoAnalysis #TechnicalAnalysis #Altcoins #DemandZone #SupplyZone #BullishTrend
SOLANA (Short position) 8/11/25Take Profit - Fibonacci Confluence (x4) + 7/11/25.VAL + 6/11/25.Buying tail
Stop Loss - Fibonacci Confluence (x4) + Nov.25' VAH

SOL USDT LONG SIGNAL---
📢 Signal Alert
🔹 Pair: SOL / USDT
📈 Trade Type: Long
💰 Entry Zone: 158.29 – 161.77
🎯 Take-Profit Targets:
TP1 = 163.94
TP2 = 168.00
TP3 = 174.40
🛑 Stop-Loss: 156.10
📊 Timeframe: 1H
⚖️ Risk/Reward Ratio: 4.11
📌 Suggested Leverage: 5x – 10x
⚠️ Capital management is mandatory.
Please review the chart carefully before entering the trade.
---
🧠 Technical Analysis Summary:
SOL is showing a strong bullish structure after a short correction phase. The price is currently rebounding from the demand zone (158–162) with clear buy pressure and higher low formation.
🔸 Key Observations:
RSI has turned upward from neutral, confirming renewed bullish momentum.
Price is holding above EMA50, signaling potential continuation of the uptrend.
Volume profile supports accumulation at current levels.
Each target aligns with prior resistance levels and Fibonacci extensions.
---
⚙️ Trade Management Tip:
Once TP1 is hit, move your Stop-Loss to Entry and secure partial profits.
Allow remaining positions to ride toward TP3 for maximum reward.
---
⚠️ Disclaimer:
This signal is for educational purposes only and not financial advice.
Always apply proper risk management and DYOR (Do Your Own Research).
---
