SOL LONG : Falling Wedge CompleteThink we've seen the last leg down of this falling wedge pattern. Breakout wave up with a target of around $195 first before retracing to $158.
Real long entry begins after retracement with a final year target of above $250
Market insights

$SOL Bearish Channel Squeeze Toward Support TestBINANCE:SOLUSDT CRYPTOCAP:SOL Bearish Channel Squeeze Toward Support Test
SOL in tight downtrend channel, eyeing critical support at $124 after breaking lower.
Potential bounce to $140 if holds, targeting $155 resistance breakout; deeper risk to $110 on failure.
Watching RSI oversold for reversal, MACD crossover bearish, volume thinning. 📉⚠️
#SOL #AltcoinTrading #CryptoAnalysis

sol-usdt🔤🔤🔤
Solana and the correction mainly due to Bitcoin, reaching support at $140 🕯🕯
A relative divergence has formed in the RSI, which could cause at least a short-term price rebound 🚨💰

SOLANA Sell/Short Setup (2H)A bearish pattern has formed on the chart, and it appears that the first wave of wave E has been completed, which was symmetrical. In the second wave of E, we are looking to enter a Sell/Short position to capture the third bearish wave of wave E.
The stop loss, targets, and entry point have been marked on the chart.
Please note that this is a swing setup and will take some time to reach the target.
Add this setup to your watchlist | we’ll enter if it reaches the entry zone.
For risk management, please don't forget stop loss and capital management
When we reach the first target, save some profit and then change the stop to entry
Comment if you have any questions
Thank You

Smart Money footprint in next Days On SolHello team
Sol move better than others to fill LONG FVGs
by the time sol losing dominance
But You should know " Every cycle in Crypto is temporiry pirod time "
In next few hours or days Solana Would reach 120 $ ( Smart money footprint zone )
and sudenly pump more than 5% in few hours
This is not My financial advice
DYOR
But this would be an opportity , One from Milions opportinities in financial market
I GOT STOCKED so Drop a comment bellow to help me show that I am not robot to TrafingView 😁
#TradeWithMky Trade smart

My Dear Solana Given the breakdown of the ascending trend line on the daily time frame and the change in trend structure from ascending to descending, we expect to enter a sell trade when the price returns below the trend line level and reaches the FVG area upon hitting the order block.

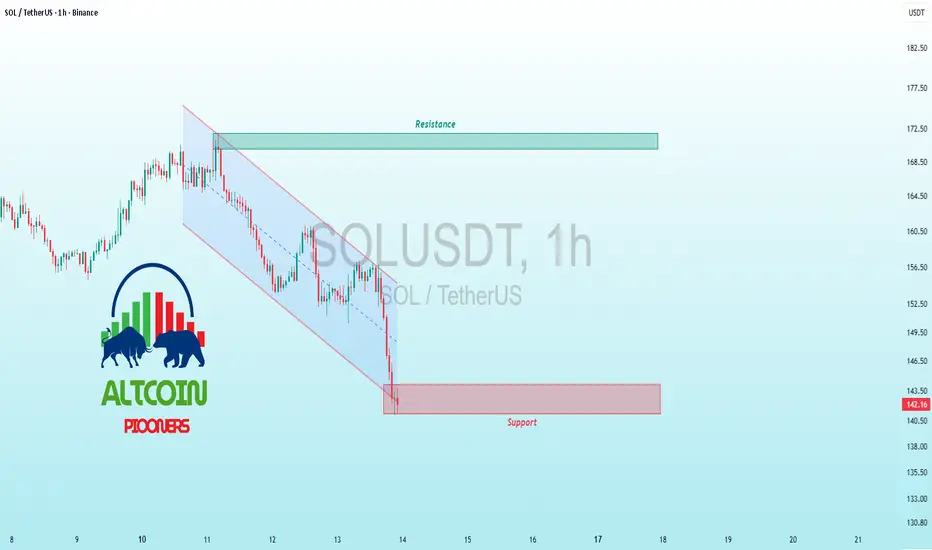
$SOL Channel Test – Bulls Defend or Bears Dominate?BINANCE:SOLUSDT CRYPTOCAP:SOL Channel Test – Bulls Defend or Bears Dominate?
Current trend: SOL's hugging the descending channel lower boundary, dipping to 143.5 support after rejection from 182 highs—classic pressure cooker with thinning red volume signaling possible relief 🛡️.
Hold support? Strong potential yes; hammer candles and prior confluence zone could draw buyers for a squeeze play.
Breakout above resistance? On horizon if 182 flips—igniting 7-10% rally to channel top 🚀.
Dip risk? Moderate to 140 on break, but oversold prevents panic flush.
Target: Upside 160 short-term; downside 138 buffer.
Indicators tracking: RSI (30, oversold bounce), Channel slope, and OBV divergence 📊.
#SOLTrading #CryptoChannel #AltcoinPioneers
#SOLANA is TRADING ON A 1785 DAYS LONG WEEKLY SUPPORT!SOLANA is trading on a 5-year-long weekly trendline support. What happens next will be worth watching.
Best lower entry zone: $125 to $135.
DYOR, NFA

SOLUSDT – Bearish Flag Breakdown in Progress
SOLUSDT on the daily timeframe appears to be confirming a bearish flag breakdown, indicating that the recent consolidation phase may have served as a continuation pattern within a broader downtrend. The price rejected resistance around the flag’s upper boundary and is now extending lower, suggesting renewed seller strength.
The RSI remains below the midline, reflecting persistent bearish momentum without signs of reversal yet. Immediate supports lie around 145.7 and 136.5, where price may look for a temporary pause or reaction.
Should the pair close below this zone with volume, the flag pole projection scenario could play out, opening room for a deeper retracement. Conversely, any sustained move back above 158–161 would negate the bearish continuation outlook and indicate a possible structural recovery.

#SOLANA Bear Market Hello everyone, I hope you're all doing well.
This is my prediction for the price of Solana in the coming weeks and months. I previously shared this idea when the price was $16, and I predicted it would rise to the top. Take a look below
This is not investment advice; please take full responsibility for your buying and selling decisions.
Warning: Be careful not to use this idea with leverage, as you could lose all your money

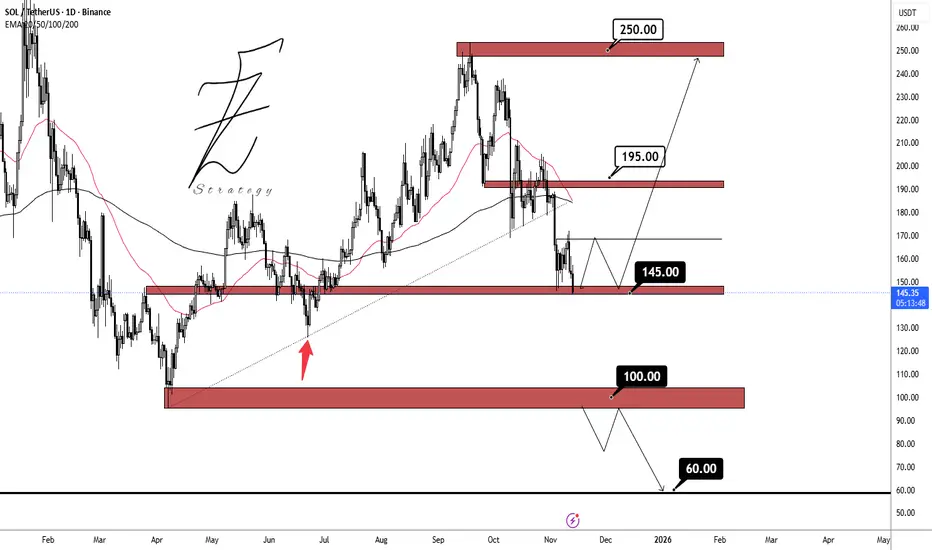
SOLUSDTLast week, the price BINANCE:SOLUSDT showed a positive reaction around the 145.00 dollar support zone, and with weakening bearish momentum, the likelihood of holding above this level has increased. If this support remains intact, the next target will be the 195.00 dollar resistance area.
Support zones: 145.00 dollar, 100.00 dollar, 60.00 dollar
Resistance zones: 195.00 dollar, 250.00 dollar
SOL/USDT: Compression Builds Above $150 as Bulls Eye BreakoutSOL/USDT is testing the lower boundary of structure after repeated failures to break the descending trendline. Price is compressing just above the $150 psychological support, suggesting possible accumulation at this level.
A break above $160 and the trendline could trigger a recovery toward $175 resistance. Momentum favors a bullish bias as long as $150 holds.
❗️ Risks:
– Rejection at $160 may lead to a retest of $147.
– BTC weakness could stall upside.
– Stronger USD or risk-off flows may delay breakout.

SOLUSDT | 30m Bullish SetupAfter the sell-side sweep and SMT divergence, SOL respected the bullish order block (OB) and started structure shift.
Alligator lines have opened upward, showing momentum alignment for a possible continuation.
Setup Details:
🟩 Entry: 155.5 – 156.0
🔻 Stop Loss: below 150.5 (beneath OB)
🎯 Targets:
TP1 → 160.5
TP2 → 164.0
TP3 → 170.0
Looking for continuation higher as long as we hold above the OB.
Bill Williams’ Alligator + SMT confluence = strong bullish bias.
#SOL #SOLUSDT #Crypto #TradingView #ICT #SMC #BillWilliams #PriceAction #SmartMoney

Lingrid | SOLUSDT Buying Opportunity at Psychological LevelThe price perfectly fulfilled my previous idea . BINANCE:SOLUSDT CRYPTOCAP:SOL is testing the lower boundary of market structure after multiple failed attempts to break the descending trendline. Price action shows a clear compression phase above the psychological $150 support, indicating potential accumulation. A bullish breakout above $160 and trendline could open a short-term recovery toward the $175 resistance zone. Overall, momentum hints at a buy bias from a key psychological and structural level.
⚠️ Risks:
Rejection from $160 may lead to a retest of $147 support.
Bitcoin weakness could suppress recovery momentum.
Stronger USD or risk-off sentiment may delay a breakout.
If this idea resonates with you or you have your own opinion, traders, hit the comments. I’m excited to read your thoughts!

SOL-USDTMy view on Solana is still the same: as long as it keeps its support at $150, it can continue to rise towards the static resistance at $165 🔼🔼💲💲

Solana 4H 13/11For Solana on the 4-hour timeframe, I see a bullish flag pattern, and hopefully, it will play out soon. My target is the all-time high. Seeing how ETH and BNB have already reached their all-time highs, I believe Solana will follow next.

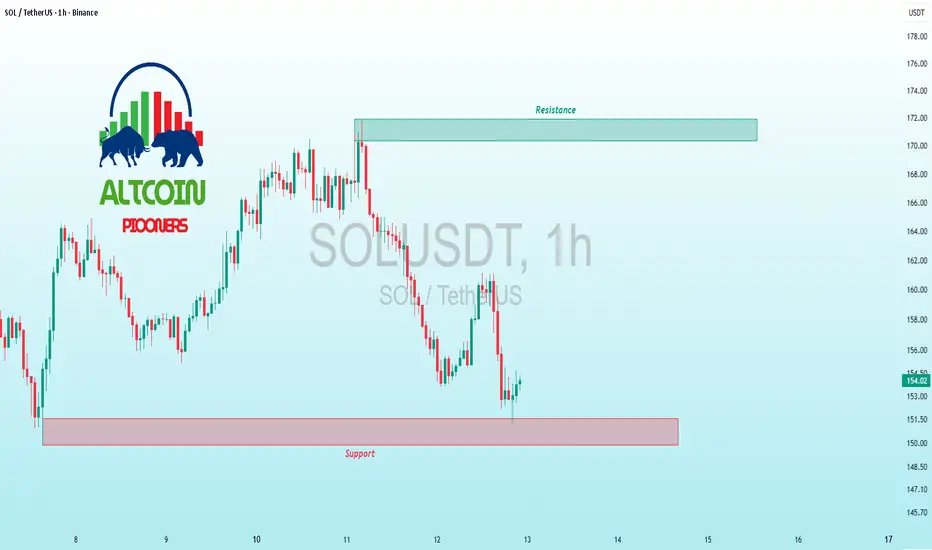
$SOL Support Fortress – Breakout Brewing?BINANCE:SOLUSDT CRYPTOCAP:SOL Support Fortress – Breakout Brewing?
Current trend: SOL's in a resilient base after volatility spike, clinging to 151.5 support amid broader alt weakness—bullish hammers forming, hinting at accumulation phase 🛡️.
Hold support? Very likely; volume clusters below and RSI bounce from 30 scream buyer control.
Breakout above resistance? Eyes on 178 clear for momentum shift—could trigger 8-10% rally if BTC cooperates 🚀.
Dip risk? Capped at 148 if rejection lingers, but low downside conviction.
Target: Initial 180 on flip; extended 190 with conviction.
Indicators tracking: RSI for reversal pops, Volume delta on greens, and Fibonacci 61.8% retrace 📊.
#SOLTrading #AltcoinBase #CryptoRebound
SOLI don’t think CRYPTOCAP:SOL will go any lower from here. It’s sitting on a major support level and looks ready to reverse. In my opinion, this feels like a classic shakeout before the next major uptrend. When everyone least expects it, CRYPTOCAP:SOL will start pushing higher.

SOLANA SHORT : $100 USD Next SOL price now in very evident bearish down trend after rejection at $240 region. Looking at the daily chart next possible support is around $94 - $100 region . Wouldn't expect any bullish action until then

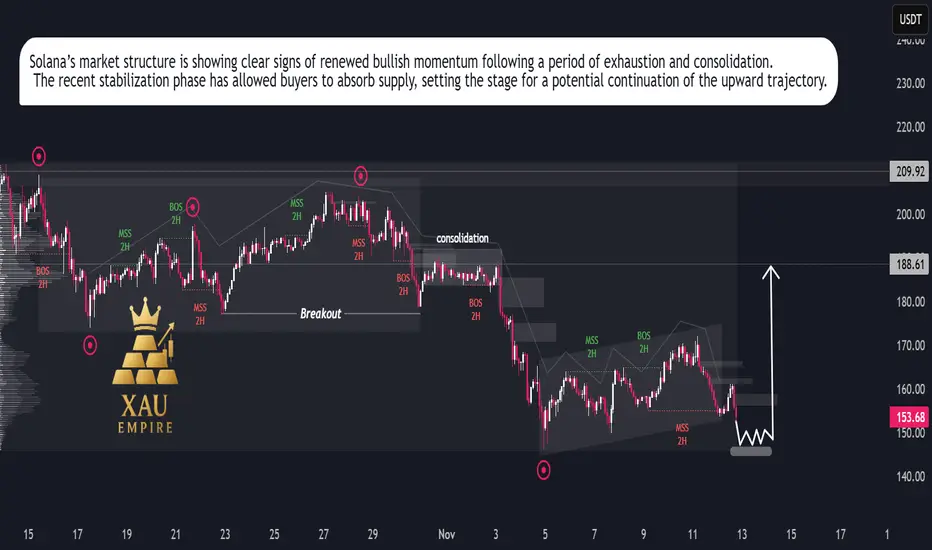
SOL/USDT – Bullish Momentum Rising, Rally Setup in ProgressSolana is showing renewed strength after an extended corrective phase, suggesting that the recent slowdown was a temporary reaccumulation rather than the start of a new downtrend. Price action has begun to stabilize, reflecting growing investor confidence and increasing participation from buyers at discounted levels.
Market flow indicates that selling pressure is fading, while buying volume has started to build up gradually. The recent structure reflects a healthy market rotation, where weaker hands are being replaced by strategic buyers positioning for the next expansion phase.
Momentum appears to be shifting in favor of the bulls, supported by consistent higher reactions after each dip and a clear compression pattern that often precedes strong directional movement. This behavior points toward a potential continuation of the broader uptrend, with expectations for renewed growth as market sentiment strengthens.
Overall, Solana’s current price behavior suggests the market is preparing for another bullish leg. As volatility contracts, the probability of an impulsive upside expansion increases, signaling that the next significant move is likely to unfold in favor of buyers.
SOLANA BOUT TO MOON!Here is some play for you so seems bullish on 1hr time frame as it shows a strong bullish candle and continue to make that bullishness

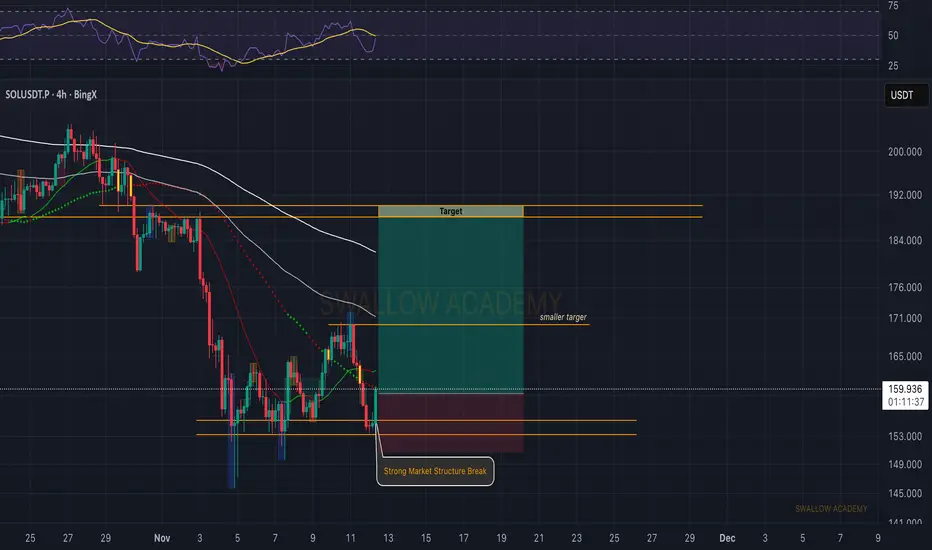
Solana (SOL): Formed Market Structure Break | Bullish TradeSOL showed a strong market structure break near the support area, hinting that buyers might be stepping back in. As long as this zone holds, we could be looking for a short-term bullish movement.
First smaller target sits around the previous minor resistance, while the main target would be the higher zone shown on the chart. Waiting for confirmation from buyers before entering remains key here.
Swallow Academy
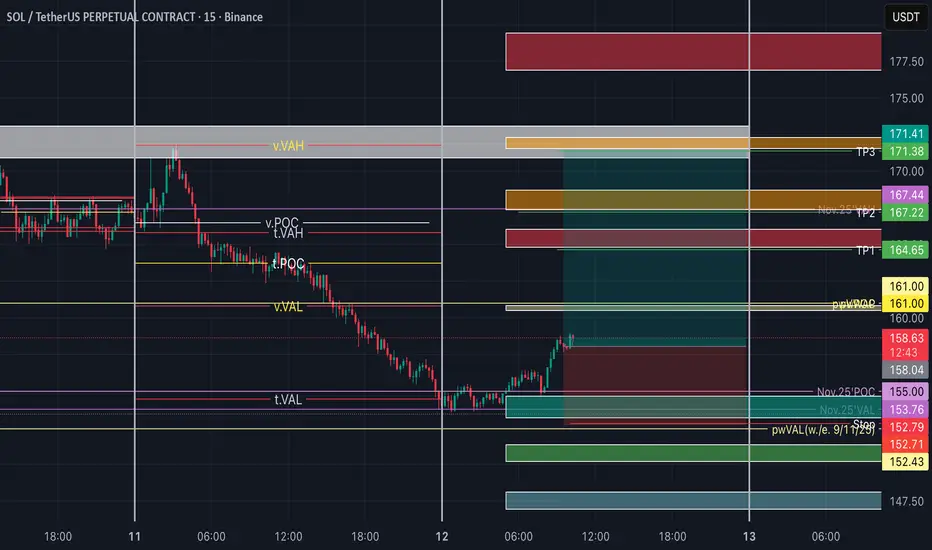
SOL Long position (12/11/25)Take Profit 1 = $164.6
(*Nov11.tVAH + Nov11.vPOC + Nov10.VAL + Fibonacci confluence)
Take Profit 2 = $167.2
(*monthly.VAH + Nov10.POC + Fibonacci confluence)
Close Long (tp3) = $171.4
(*Single Prints from Nov3 + Nov11.tVAH + Fibonacci confluence)
Stop = $152.8 (*monthly.VAL + Nov11.tVAL + Fibonacci confluence)