SOLANA WEEKLYSOLANA after 291.47 all time high,buyers attempted to reach same high but failed after been rejected at 291.47 critical supply roof .
all thing working in favor of sellers and they could hold sell till 82k-78.44-74k zone
Solana Ecosystem and Applications
Solana remains one of the fastest, cheapest blockchains, supporting a diverse range of projects:
DeFi platforms: Marinade Finance (staking solutions), Raydium, Orca (decentralized exchanges)
NFT marketplaces: Magic Eden, supporting digital art and collectibles
Gaming: STEPN (move-to-earn app), Genopets, and blockchain-based gaming with NFT utilities
Real-world asset tokenization: Transforming ownership models with fractionalization
Decentralized identity and privacy: Blockchain-based secure identity solutions
Supply chain transparency: Enhanced traceability and accountability
IoT integration: Secure data sharing between Internet of Things devices
Web3 social media and content platforms: Rewarding user participation with tokens
Why Solana’s Price is Falling
Market Sentiment: General crypto market volatility and risk-off sentiment affect Solana like other altcoins.
Regulatory Pressure: Increased scrutiny on crypto in major economies raises investor caution.
Network Issues: Past network outages and technical challenges still weigh on confidence despite improvements.
Competition: Intense competition from Ethereum, Avalanche, and emerging Layer 1 chains affects investor appetite.
Macro Factors: Broader macroeconomic headwinds including slowing tech sector, rising interest rates, and inflation concerns stunt speculative demand.
#solusdt
Market insights

SOL USDT LONG SIGNAL
---
📢 Signal Alert
🔹 Pair: SOL / USDT
📈 Trade Type: Long
💰 Entry: 158.18
🎯 Take-Profit Targets (Partial Management):
▫️ TP1 = 162.00
▫️ TP2 = 164.70
▫️ TP3 = 167.60
▫️ TP4 = 174.40
🛑 Stop-Loss: 153.80
📊 Timeframe: 1H
⚖️ Risk/Reward Ratio: 3.85
📌 Suggested Leverage: 5x – 10x
⚠️ Capital management is mandatory.
💬 Please review the chart before entering the trade.
---
🧠 Technical Analysis Summary:
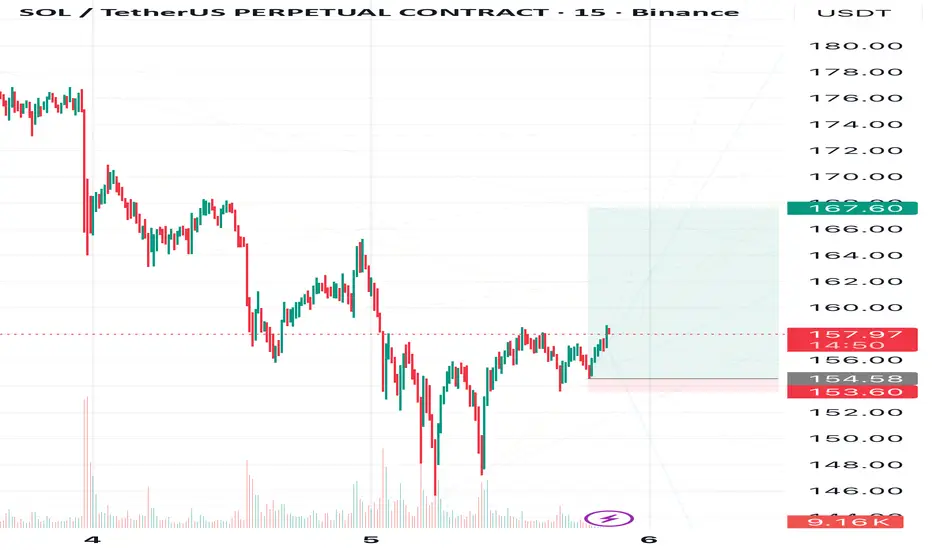
SOL is showing strong bullish momentum after bouncing from the key support zone near 154–156, confirming buyer dominance.
A clean breakout and candle close above 159 will likely trigger a continuation toward 164–174.
The RSI remains above 55 and trending upward, indicating sustained buying pressure.
The EMA 20 is turning upward, supporting the long bias, and volume confirms accumulation.
---
⚙️ Trade Management Tip:
Take partial profit at TP1, move stop-loss to Entry to protect capital.
If price reaches TP2–TP3, trail stop-loss under the last 1H swing low.
Avoid entries before confirmation candle close above 159.
---
⚠️ Disclaimer:
This analysis is for educational purposes only and not financial advice.
Always DYOR (Do Your Own Research) and use strict risk management before trading.
--

Important range: 161.79-163.73
Hello, traders!
Follow us to get the latest information quickly.
Have a great day!
-------------------------------------
(SOLUSDT 1D chart)
The HA-Low indicator, the DOM(-60) indicator, and the M-Signal indicator are forming around 161.79-163.73.
Therefore, the key is whether the price can break above the 161.79-163.73 level.
To continue the uptrend by breaking above this key point or level, the StochRSI, TC (Trend Check), and OBV indicators must show upward trends.
- The StochRSI indicator should not have entered the overbought zone.
- The TC (Trend Check) indicator should remain above zero.
- The OBV indicator should remain above the High Line.
Currently, the OBV indicator is near the Low Line, and is in a reversed state with OBV < EMA 2 and EMA 1.
Therefore, if the price breaks above the 161.79-163.73 level, we need to watch for a reversal where OBV > EMA2 and EMA1.
The StochRSI indicator appears to be rising from the oversold zone, and appears to have shifted to a K > D state.
The TC (Trend Check) indicator is trending upward, but since it's below the 0 level, we can see that selling pressure still dominates.
Therefore, if the TC indicator breaks above the 161.79-163.73 level, we should also check to see if it can rise above the 0 level.
If it fails to rise above the 161.79-163.73 level, we should check for support around 126.36.
Since the HA-Low indicator has been created, even if it shows a stepwise downward trend, it is expected to eventually turn upward.
Therefore, we should focus on finding the right time to buy.
-
Thank you for reading to the end.
I wish you successful trading.
--------------------------------------------------

SOL to 145 next week.SOL has been having meaningful support from 150 to 160, but when BTC breaches 100k next week we’ll wick to 145 to resume up and this will happen rather quickly. Be quick to catch it.
SOLANA Massive Head & Shoulders On The Monthly Chart !Hi guys,
I've never seen a Head & Shoulders so big and clear like what we have on SOL right now lol
I wouldn't wait for price to go up and get out..I'd say get out and get out now while u have a chance.
We Also kinda have a double top from this year and 2022 ATH so that makes it two big red flags!
50$ is a magnit at this point and safest level for entry which will probably take us a year to get there so stay safe out there and let me know what do you guys think about this ?

SOLANA WILL BE HIT 360$ in SEP if regain up to 180$ this weekmarket need to put hunt on buyer leverage and get new entrance around139$ to 150$ best trigger for entrance in solana in this 2 day ahead for week candle. if price stand up to 180$ this will make huge run to 360$ in this cycle.

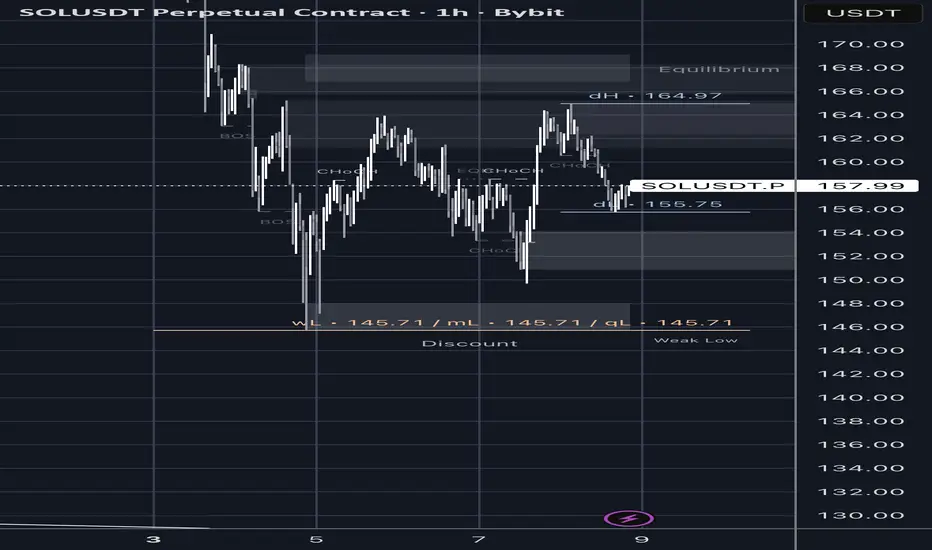
Solana Faces Rejection at $160 — Correction Toward $155 POC Solana price action remains range-bound within a well-defined structure, with the 0.618 Fibonacci, VWAP, and lower support at $146 forming the key technical base. After a steady climb back toward the $160 region, price is now showing signs of rejection, indicating that short-term exhaustion may be setting in.
This reaction at local resistance increases the probability of a corrective move in the coming days, potentially leading price back toward the $155 level, where the Point of Control (POC) is situated. How Solana reacts at this level will be critical in determining whether the market resumes its range-bound behavior or transitions into a deeper correction.
Key Points:
- Range Structure: Price remains contained between $146 and $160.
- Rejection Zone: Local rejection from $160 hints at short-term weakness.
- Next Key Level: $155 POC is the area to watch for reaction and potential support.
From a technical perspective, Solana is consolidating within a controlled range, with volume distribution centered around the mid-zone.
What to Expect:
Expect continued correction toward $155, where the POC will act as a decision point. A strong bounce could reestablish upside momentum, while a breakdown may extend the correction toward $146 support.

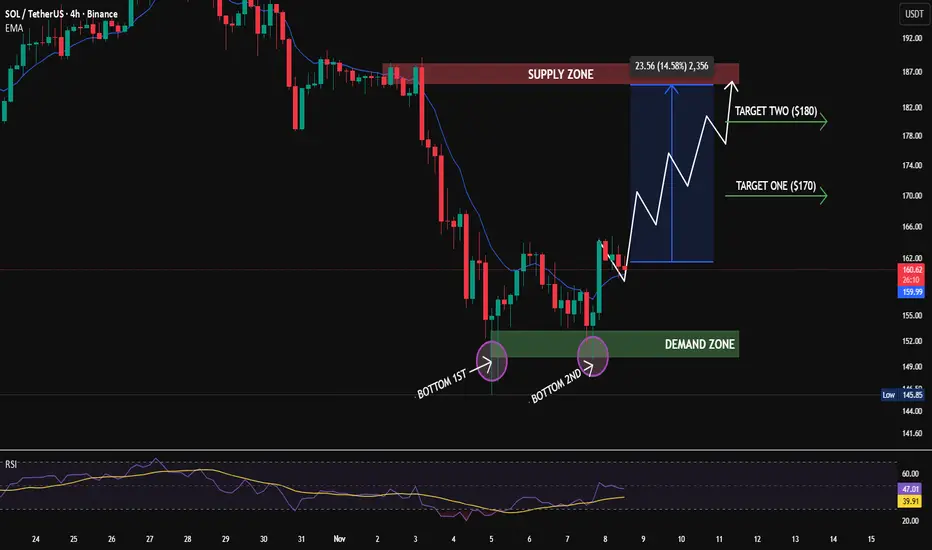
Double Bottom Reversal (Bullish Structure from Demand Zone)The chart shows SOL forming a double bottom at a strong demand zone, indicating a potential bullish reversal. Price has bounced twice from the same support region, showing clear buyer aggression and seller exhaustion, with a projected move toward the upper supply zone.
Key Observations
🔹 Demand Zone: $148 – $152 — strong support where both bottoms formed, triggering buyer interest.
🔹 Double Bottom Formation: Two clean touches confirming reversal structure.
🔹 Supply Zone: $183 – $187 — key resistance where sellers may step in.
🔹 EMA (10): Price is attempting to reclaim it; a close above the EMA would confirm momentum shift.
🔹 RSI: Currently around 47 — rising from lower levels, signaling early bullish momentum with room to move higher.
🔹 Structure: As long as SOL holds above the demand zone, the bullish reversal setup remains intact.
Potential Move
If SOL continues to hold above the $148–$152 demand zone, the next
upside targets are:
🎯 Target 1: $170
🎯 Target 2: $180
A breakdown below $148 could invalidate the reversal and push the price back toward deeper support levels.
Summary:
SOL is showing a strong double-bottom reversal from a key demand zone, supported by improving RSI and EMA interaction. Holding above $150 keeps the bullish structure active, with a potential continuation move toward $170–$180, followed by a retest of the supply zone near $185.
.
.
#coinpediamarkets #SOL #SOLUSDT #CryptoAnalysis #TechnicalAnalysis #Altcoins #DemandZone #SupplyZone #BullishTrend
SOLANA (Short position) 8/11/25Take Profit - Fibonacci Confluence (x4) + 7/11/25.VAL + 6/11/25.Buying tail
Stop Loss - Fibonacci Confluence (x4) + Nov.25' VAH

SOL USDT LONG SIGNAL---
📢 Signal Alert
🔹 Pair: SOL / USDT
📈 Trade Type: Long
💰 Entry Zone: 158.29 – 161.77
🎯 Take-Profit Targets:
TP1 = 163.94
TP2 = 168.00
TP3 = 174.40
🛑 Stop-Loss: 156.10
📊 Timeframe: 1H
⚖️ Risk/Reward Ratio: 4.11
📌 Suggested Leverage: 5x – 10x
⚠️ Capital management is mandatory.
Please review the chart carefully before entering the trade.
---
🧠 Technical Analysis Summary:
SOL is showing a strong bullish structure after a short correction phase. The price is currently rebounding from the demand zone (158–162) with clear buy pressure and higher low formation.
🔸 Key Observations:
RSI has turned upward from neutral, confirming renewed bullish momentum.
Price is holding above EMA50, signaling potential continuation of the uptrend.
Volume profile supports accumulation at current levels.
Each target aligns with prior resistance levels and Fibonacci extensions.
---
⚙️ Trade Management Tip:
Once TP1 is hit, move your Stop-Loss to Entry and secure partial profits.
Allow remaining positions to ride toward TP3 for maximum reward.
---
⚠️ Disclaimer:
This signal is for educational purposes only and not financial advice.
Always apply proper risk management and DYOR (Do Your Own Research).
---

SOL Short SOL Short 📉
In the medium term, I am bearish.
Rebalancing the bearish inefficiency (POI) is likely to lead to continued aggressive markdowns, which can be used to open a short position.

SOL aint looking that goodYes, the market structure isn't really broken and it hasn't lost any major support
Yes, it can go higher, a lot higher,
and yes it's been one of the best performers of this cycle .
Which makes it rather risky to short it. But it doesn't change the fact that it:
- Failed to beat critical levels
- By being one of the best performers, retail is loving it.
- Everyone is too comfy in longs.
The level i had for SOL back in last year happened to be the exact bottom, so I'm being cautious here.

Solana’s 63-Day Cycle: Bullish & Bearish Path ProjectionThis chart examines Solana’s recurring 63-day market rhythm, revealing a consistent pattern of “M-top” formations approximately every nine weeks. Each cycle has historically produced a local high followed by a corrective phase, suggesting that SOL trades within a repeatable momentum structure that alternates between accumulation and exhaustion.
Using Heikin-Ashi candles on the weekly timeframe, the pattern highlights clear bullish and bearish rotations — each forming higher lows within a rising macro trendline (the “possible correction line”). The green projection path represents a potential continuation of this macro uptrend, targeting the $275–$325 range for the next cycle top, and possibly $375–$400 if momentum sustains into early 2026.
Conversely, the red path marks the bearish continuation scenario. A breakdown below the $150–$160 trendline support could trigger a deeper retracement toward $120 or even $100, retesting previous accumulation zones before the next cycle emerges.
External factors (e.g., network congestion, exploit events, liquidity shocks) have previously caused deviations from the rhythm, as noted on the chart. Despite these outliers, the broader 63-day pattern has remained structurally intact since early 2024, suggesting a cyclical behavioral consistency among traders and algorithmic participants.

SOLANA’S SWING — BEARS TAKE WINGHey guys! How was your trading week? Hope you made some great profits!
Solana has completed only half the way to my target at 167 and then reversed — and now I don’t see any signs of continuation to the upside.
In my previous Solana post, I mentioned that my next downside targets are 144 and then 124.
I believe we’ve just finished the correction and are heading toward 144 — at least, that’s what all the signs on the chart are showing me right now.
However, first I expect a dip to 147, as there might be a short-term bounce before further decline.
🎯 Targets:
1️⃣ 147
2️⃣ 144
3️⃣ 124
❌ Invalidation: 158.53
📈 Follow me to stay updated on Solana’s next moves and other crypto setups — don’t miss my updates!
⚠️ Disclaimer:
This is not financial advice. I share my personal market view for educational purposes only. Always do your own research before making trading decisions.

SOLANA - Swing long (7.11.25)TP1 = 7/11/25.VAH + Selling Tail + Fibonacci Confluence x2
TP2 = 6/11/25.VAH + Fibonacci Confluence x3
Stop Loss = Below Buying tail

Solana’s pause after the causeHi friends!
How are you doing after the recent Bitcoin–Solana drop?
I hope you didn’t lose anything — and maybe even managed to make some profit instead! 💪
📉 My next targets on the downside are around $144 and $124, but at the moment, Solana seems to be taking a breather from the fall.
After a long and deep decline, even below my earlier expectations, Solana is finally showing some signs of a small correction to 167,60 📈
🎯Target - 167,60
❌Invalidation zone are marked on the chart - 153,60
💬 What do you think — is this the start of a reversal, or just a short pause before another move down? Share your thoughts in the comments. I always enjoy reading your views!
🔔 Follow me to stay updated on Solana and other crypto market analyses.
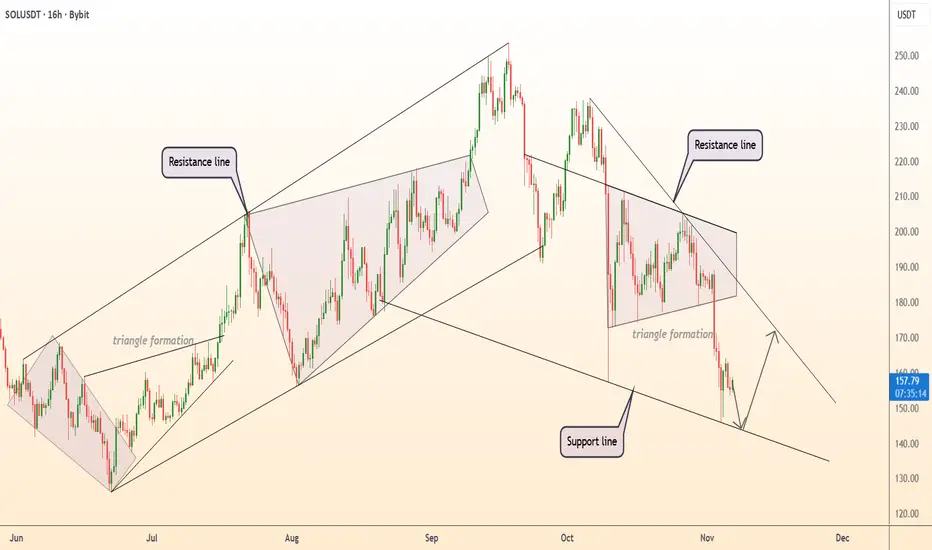
DeGRAM | SOLUSD will test the support line📊 Technical Analysis
● SOL/USD is testing the lower boundary of the descending channel near $150, a key support aligning with the broader bullish trendline from June. The pattern suggests a potential rebound within the channel toward $175–$180 resistance.
● Multiple triangle formations indicate prior consolidation phases before upward moves, reinforcing the likelihood of another medium-term recovery if support holds.
💡 Fundamental Analysis
● Growing institutional activity in Solana’s DeFi and NFT ecosystems continues to support long-term investor confidence, despite short-term volatility.
✨ Summary
● Support: $150. Resistance: $175–$180. A sustained bounce from the lower trendline could trigger a rally toward $190.
-------------------
Share your opinion in the comments and support the idea with a like. Thanks for your support!
SOL-USDTIt reacted again on the same $150 support,
but we can only see a reversal on the chart 🚨📣
if the static resistance at $165 is broken.
That way, the first target will be $175 and then $185.

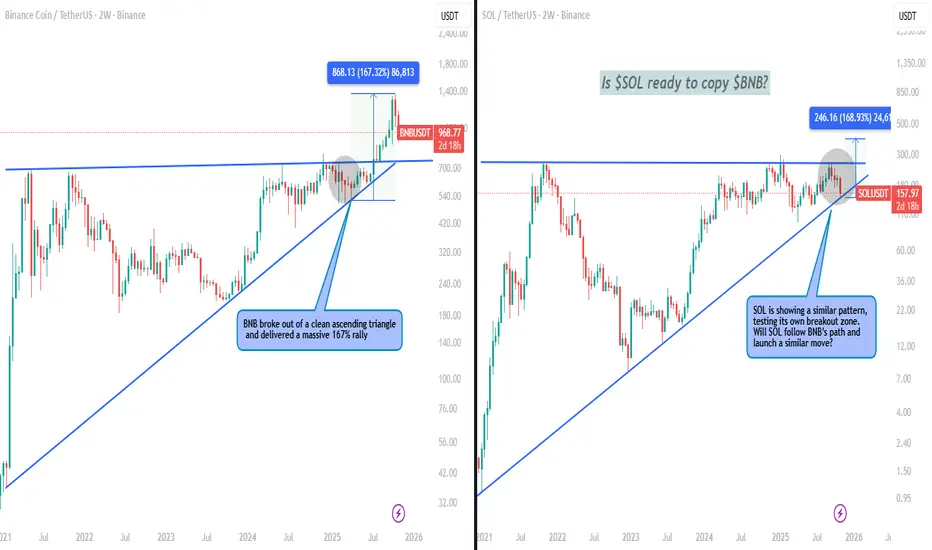
$SOL vs $BNB – History repeating?CRYPTOCAP:BNB broke out of a clean ascending triangle and delivered a massive 167% rally. Right now, CRYPTOCAP:SOL is showing a similar pattern, testing its own breakout zone.
Will SOL follow BNB’s path and launch a similar move? A structure like this could set the stage for a big run if support holds. Share your views—is CRYPTOCAP:SOL ready for its breakout moment?
SOL: One More High… or Goodbye?The Solana bull run that started in December 2022 most likely finished in January 2025. It was a textbook five-wave impulse (extended iii, with i ≈ v). From Jan → Apr 2025 we saw the first leg down (A), and the rally Apr → Sep was merely a corrective (B) move; base case is C down toward $80–50. An alternative allows for one more pop within B (even a small over-throw), but downside resumes after.
Full cycle & proportions
Dec ’22 → Jan ’25: clean 1–2–3–4–5.
Wave 3 shows a classic extension.
Waves 1 and 5 are nearly equal in length.
The run from the bottom is roughly 30–35× (about +3,000%), which statistically argues for a meaningful mid-term correction.
Base correction targets from the whole impulse: 0.382–0.5 Fib → $80–50, aligning with monthly/quarterly imbalances (FVG).
What 2025 looked like
Jan → Apr: first downward leg — wave A.
Apr → Sep 18 (high ~$253): a double zigzag W–X–Y — typical wave B, not a new trend.
Alternative (expanded flat, EFL)
A: Jan → Apr 7 down.
B: Apr → Sep as (A); now forming (B); then (C) up (a minor higher high is possible).
After that, a larger C down into $80–50.
Why I think the rally is done (market context)
TOTAL and BTC likely trace end-phase bull structures (distribution/terminal patterns).
Volume profile on COINBASE:SOLUSD : the heaviest trading sits around $120–200 (HVN/POC) — classic distribution; price often moves below POC afterwards.
Price Action (weekly/monthly): $216–260 is a major resistance that launched the bear market back in Nov 2021. Repeated tests without a weekly/monthly hold above it argue against an immediate breakout.
Fundamentals in two lines
Why a correction now: cycle overextension, liquidity saturation near the top, sensitivity to DXY/real yields and risk-off in US indices.
Why the long-term case survives: high throughput, latency improvements (e.g., Firedancer), growing DeFi/stablecoin/consumer activity. After leverage clears, BINANCE:SOLUSDT historically recovers with high beta.
Levels & invalidation
Base (correction) holds until we get a weekly close > $260–270.
Downside waypoints: $150 → $120 → $95 → $80–50.
Invalidation: sustained hold above $270 with expanding volume — I’d concede an early start of (3) without a deep (2).
Bottom line. With high probability, SOL’s medium-term rally is over; we are in a corrective phase targeting $80–50. The long-term bullish story can resume later — but first the market likely needs to deflate.

SOL - Ranges overview Let's have a look at SOL and its current trading range.
I know a lot of you young traders are still hyped and enjoy trading SOL so I'll give you my take on it.
Personally, I've never had a stake in it and don't plan on getting any merely based on the fact that since its inception a hyped fueled and based crypto - BUT for the sake of trading let's have a look at the chart.
We are currently trading back towards the sellside liquidity sitting around 140$.
IF we fail to hold it expect some more pullback towards 120-100$.
IF we hold the 140$ sellside liquidity range (and BTC manages to reclaim 150K) expect SOL to aggressively retrace towards 216$.
As always PATIENCE...PLAN AND EXECUTE.
Stay safe and never risk more than 1-5% of your capital per trade. The following analysis is merely a price action based analysis and does not constitute financial advice in any form.
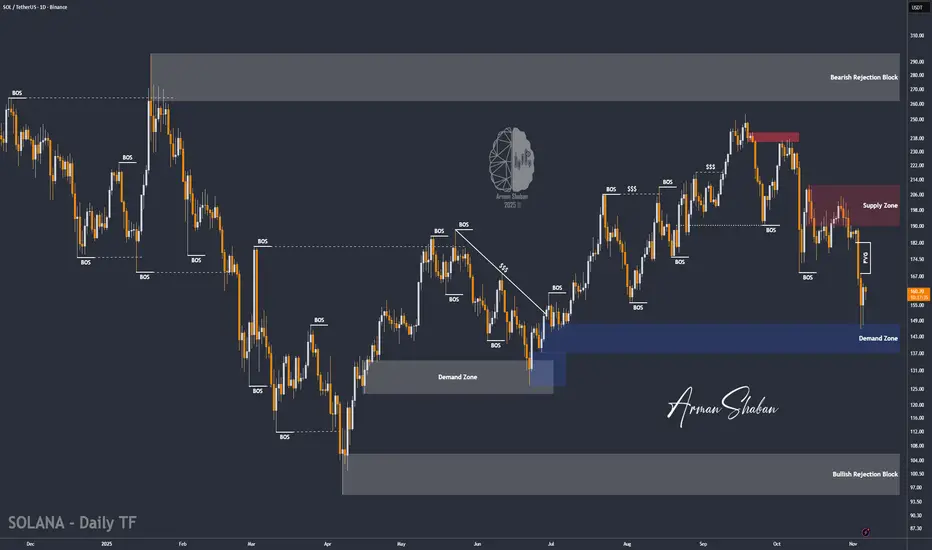
SOL/USDT | Solana Rebounds From $146 – Bulls Back in Control!By analyzing the #Solana chart on the daily timeframe, we can see that after correcting to $146, the price found strong demand and is now trading around $160.
If Solana manages to hold above the key demand zone of $137–$147, we can expect further upside movement. The medium-term targets are $168, $182, and $196. This analysis will be updated soon.
Please support me with your likes and comments to motivate me to share more analysis with you and share your opinion about the possible trend of this chart with me !
Best Regards , Arman Shaban
SOL-USDTThe $156 level is the first support for Solana, and if it breaks, it could move toward $141💰🔽And by holding this support, it could rebound toward $172.
