SOL-USDTIt exactly bounced back from yesterday's support around $129 that I had identified, and it grew about 8% 🚀📣
Currently, the short-term support for today is $135, which, if maintained, could allow it to rise up to $147 🔼💰
🔤🔤🔤
Market insights

SOLUSDT – Up… Finally?Alright traders, I’ll be honest —
a few of my recent trades went south faster than my morning coffee.
So hopefully this one decides to treat us a little better. 😅
We had a small decline during the Asia session,
nothing dramatic, just the usual SOL “I’m bored” dip.
But from this level, I’m expecting a bounce —
maybe not a huge one, but definitely enough to catch a clean move up.
The setup is simple:
👉 small pullback
👉 potential bounce
👉 let’s try to finally win one 😄
Let’s see how it plays out —
trade safe, manage your risk,
and may SOL behave for once! 🚀🔥

SOL-USDTI had an update on support, and the valid Ethereum support is still $130 📊💱
As long as this level isn't broken, it can prevent further correction 🚀
If it stays above this support, it might again move back toward $135 📈
The next Solana support is $123 📣✔️

sol-usdtExactly yesterday at this time I told you Solana is on the rise; the arrow is still on my chart.
And it had a 10% growth without leverage 📈🔴
Currently, for a new and bigger rise, 142 needs to be broken in order to reach 146 again, and if it hits that main resistance, it could rise up to $157 📈💲
The short-term support for Solana is $135 🔼✔️

Beautiful Bullish Divergence appearing.SOLUSDT
CMP 143.04 (09-12-2025)
Beautiful Bullish Divergence appearing.
Crossing 145 - 146 may lead it towards 160+
On the flip side, it should not break 125

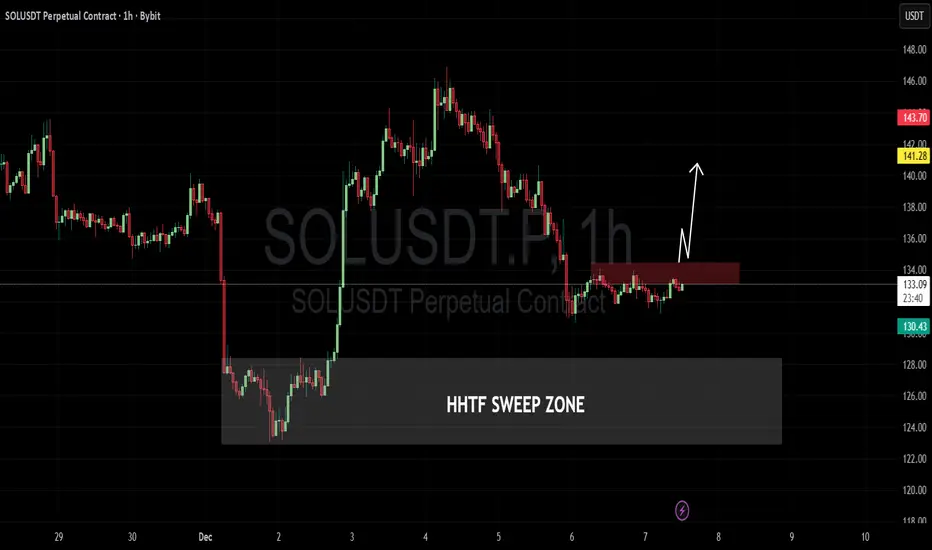
When sol does sol pumps ?The Plan:
Breakout: The price needs to close a 1-hour candle strongly above the Red Box (above ~134.50) to confirm that buyers have absorbed the selling pressure.
Retest (Flip): Ideally, price pulls back slightly to turn the previous resistance (Red Box) into support.
Expansion: Price continues upward toward the next liquidity targets.
The chart shows a potential bullish reversal, but it is currently at a decision point.
Aggressive Entry: Entering now anticipates the breakout but carries the risk of rejection at the Red Box.
Conservative Entry: Waiting for the candle close above 134.50 (as per the white arrow projection) offers higher confirmation but a slightly worse entry price.
The "HHTF Sweep Zone" provides a strong floor, giving this setup a defined risk-to-reward ratio if the breakout occurs.
SOLUSDT – Push Down Again?Alright, are we going down again?
How far?
No clue. You don’t know. I don’t know.
Honestly, even Solana doesn’t know — it’s just vibing at this point. 😄
BUT… what we do know is that this week still looks pretty bearish overall.
Macro = trash.
Fear = extreme.
Traders = crying.
Perfect conditions for SOL to explore some lower real estate before even thinking about a pump.
I’m treating this as a mini swing / big scalp:
• lower RR
• higher win rate
• quick in, quick out
• don’t overthink it
🔎 What’s the plan?
We can easily push deeper this week, grab some liquidity, scare everybody, and then maybe — maybe — give us a bounce.
Or… we pump straight from here and make everyone who shorted feel pain.
Classic crypto.
And that’s exactly why:
⸻
⚠️ RISK MANAGEMENT > EGO
No predictions, no hopium, no copium — just proper risk.
Trade safe, enjoy the ride, and don’t let SOL send you to liquidation island. 😄🚀

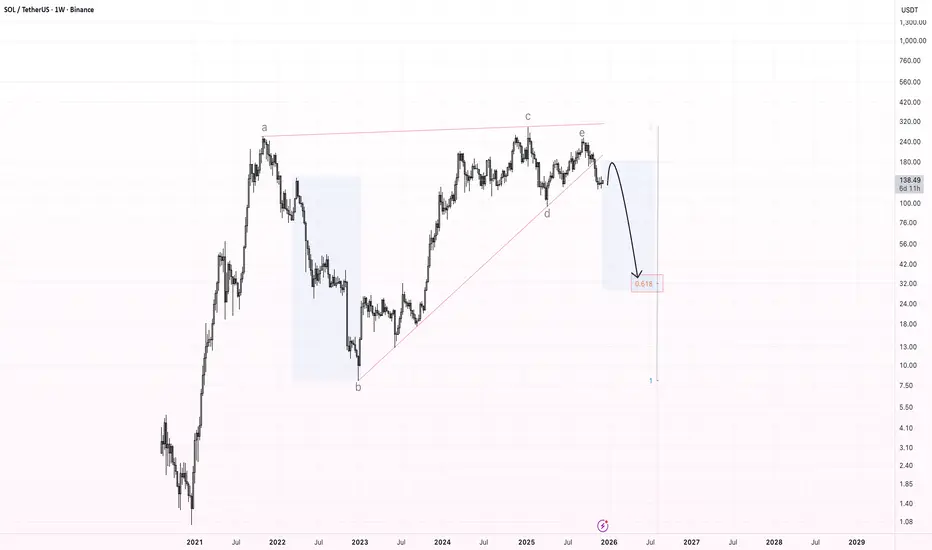
SOL – Bearish Rising Wedge Breakdown (Weekly Chart)The chart shows a large multi-year bearish rising wedge , which has now been broken to the downside. This wedge has been forming since the 2022 bottom and consists of clear wave structure (a–b–c–d–e), with the final wave e rejecting at the upper boundary and triggering the breakdown.
After this kind of pattern, the market often provides a relief bounce back into the broken support , which should now act as resistance . For SOL, the expected retest zone is located around $170–$190.
If price confirms resistance there, I expect the beginning of a larger downward wave , targeting the main Fibonacci zone near the 0.618 retracement, which aligns with a long-term target around $30–$40.
This zone marks the primary downside target for a full wedge breakdown.
Key Points:
Multi-year bearish rising wedge has broken.
Expected retest: $170–$190.
Major downside target: $30–$40 (0.618 zone).
Potential start of a macro corrective wave.
Solona right channel & Angle of movementFinally solana gave us the right channel and Angle Movement . that shows us we probably go up from this point and This point (126 ) was the local bottom. (I hope!)
My main target about 170 and final target is about 185.

#SOL/USDT Final Liquidity Zone Before Expansion?#SOL
The price is moving in a descending channel on the 1-hour timeframe. It has reached the lower boundary and is heading towards a breakout, with a retest of the upper boundary expected.
We are seeing a bearish bias in the Relative Strength Index (RSI), which has reached near the lower boundary, and an upward bounce is expected.
There is a key support zone in green at 130, and the price has bounced from this level several times. Another bounce is expected.
We are seeing a trend towards stabilizing above the 100-period moving average, which we are approaching, supporting the upward trend.
Entry Price: 132
First Target: 134
Second Target: 137
Third Target: 140
Remember a simple principle: Money Management.
Place your stop-loss order below the green support zone.
For any questions, please leave a comment.
Thank you.

Sol trade idea
Solana is currently moving inside a bearish ascending channel.
I’m targeting a 50% retracement, which aligns with the Monday high and a fair value gap.
I’m waiting for confirmation, meaning I want price to break the channel, then retest from the MSS level.
If that retest shows weakness, I’ll look to enter the short setup.

SOL at a Major Turning Point — Big Move Ahead#SOL
SOL is sitting right on its major weekly support, a zone that has held the chart together multiple times. This area is still acting as the main foundation for the current structure 🧱
If SOL can bounce from here and push back into the resistance zone above, the chart opens the door for a larger continuation toward the upper distribution area 🚀
We can already see how clean the structure becomes once price reclaims that mid-zone.
But if this major support fails to hold, SOL could slide into the deeper accumulation zone — a long-term area where strong buyers usually step in 👀
Right now, SOL is at a critical point. How it reacts here will shape the next big weekly move. Stay patient and follow the reaction, not the prediction ⚡
#SOLUSDT

SOLUSDT – Swing Trade in Play Alright traders, we’re trying another swing trade on SOL —
counting on a rally in the next few days/weeks.
Why? Because the macro picture is finally starting to look a bit less depressing.
Sure…
today’s Jobless Claims weren’t great,
but overall macros are improving slowly,
and that gives the market some space to breathe.
So what do I expect?
👉 Small push down first (because crypto can’t ever go straight up)
👉 followed by a move upward — hopefully the real swing leg we’re waiting for
It’s not guaranteed (nothing ever is),
but the setup looks solid and worth taking with proper discipline.
⸻
⚠️ Trade safely, legends
Use proper risk management,
don’t overleverage,
and let SOL do the heavy lifting. 😄
Good luck! 🚀🔥

sol-usdtOnce, from 130 to 140, it gave us a good 6% gain 📣💲💲
Now the price is back at the $130 support. As long as this level isn’t broken, the price could bounce back towards $135 🔼✔️
🔤🔤🔤

SOLANA – Key Support Retest, Watching HTF Structure CloselySOL is interacting with one of the most important HTF zones on the chart — the multi-year support level that has repeatedly defined trend transitions. This zone has served as structural support during expansion phases, a breakout base during the run toward all-time highs, and later as a liquidity pool during corrective cycles. Every major deviation from this line has led to a significant move in the opposite direction, making this retest highly meaningful.
Earlier in the chart, support broke and produced a full liquidity sweep, clearing long-position stop clusters before price reclaimed the level and initiated a multi-month advance. The presence of an order block just above this zone adds additional structure: it acted as a redistribution area during the breakdown, and later as the origin of re-accumulation. The recent taps into this region suggest the market is again probing for resting liquidity and responsive buy orders.
Price is now compressing between HTF support and declining 50/100 EMAs, creating a classic higher-timeframe squeeze. EMAs continue to slope downward, signaling a bearish macro trend, but candles remain supported at the long-term horizontal level. This type of compression typically resolves with a decisive expansion once liquidity is absorbed from one side.
The FVG Reaction Zone earlier in the trend shows how SOL tends to return to inefficiencies before choosing direction. The current circled region may represent the same behavior on a larger scale — an attempt to rebalance price before either reclaiming the EMAs or continuing displacement lower.
Momentum indicators add another layer: Stoch RSI is turning upward from deeply oversold territory, suggesting momentum exhaustion on the downside but not yet confirming a trend reversal. Historically on this timeframe, these rotations have preceded multi-week expansions when aligned with structural reclaim, but have also failed when EMAs continued to reject price.
Overall, SOL is positioned at a pivotal HTF decision point:
Hold support → potential base formation and EMA reclaim attempts
Lose support → opens the door to a fresh liquidity sweep into prior structural lows
Until a break in structure or EMA reclaim occurs, this remains a compression zone with elevated importance for trend continuation or reversal.

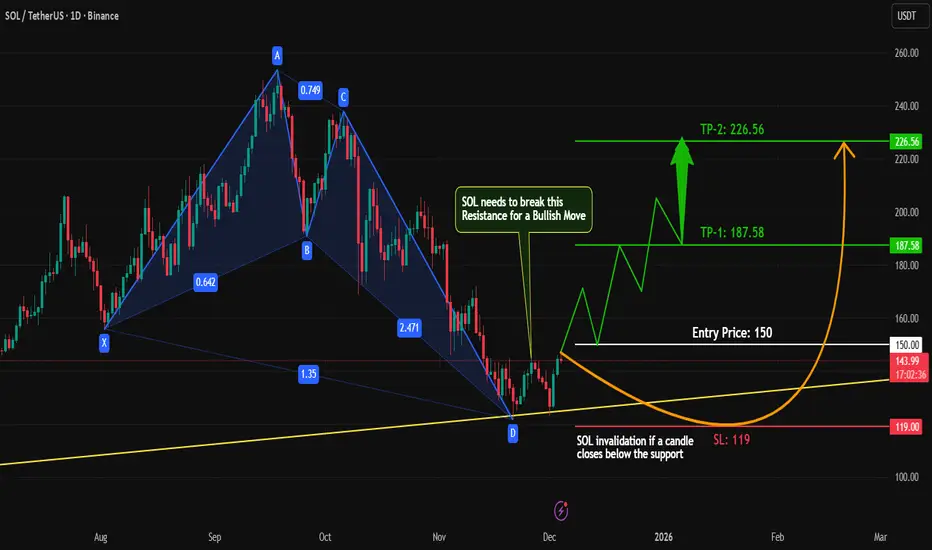
SOL (Solana) – High-Probability Reversal Setup FormingSOL (Solana) – Advanced Harmonic Completion + Trendline Confluence | Break & Retest Strategy
#SOL remains within a broader downtrend on the higher timeframe, but the recent 1D structure is showing an important technical development. Price has completed a harmonic pattern directly on a major multi-touch trendline, creating a strong confluence zone with potential for a reversal.
Despite the existing downtrend, there is no confirmed bearish continuation signal. Momentum is slowing down, suggesting that sellers may be losing strength.
Technical Breakdown
Harmonic Completion Zone (HCZ)
Price has tapped a harmonic completion area aligning with a Fibonacci cluster, prior demand, and trendline support. This makes it a high-value level for reaction.
Trendline Confluence
#SOL continues to respect the ascending trendline. Current candles show corrective movement rather than impulsive sell pressure.
Trading Strategy
Bullish Plan:
Wait for a clean breakout above resistance.
Look for a retest into the breakout zone.
Confirm long entries through bullish rejection or engulfing structure.
Stop loss below structural lows.
Target next liquidity pools with a minimum 1:2 R:R.
This ensures entries are backed by confirmation rather than anticipation.
Bearish Consideration:
As long as resistance holds, the overall market remains in a downtrend. Failure to break the level may result in continuation to the downside.
Summary
Harmonic pattern completed at a strong confluence area.
Trendline support remains respected.
No bearish continuation signal at current levels.
Bullish scenario only valid after breakout and retest.
Structure confirmation is essential to avoid premature entries.
#SOL #Solana #CryptoAnalysis #TechnicalAnalysis #HarmonicPattern #Trendline #MarketStructure #BreakAndRetest #PriceAction #CryptoTrading #TradingStrategy #Altcoins #CryptoChart #TradingView
SOL-USDT
I just analyzed it for you last night 🕯
I said Solana would rise, and exactly from last night until now it has gained around 4% without leverage 😍
For today, if it manages to break $136, it could go up to $141 🚀📊
Solana's support is still at $130 🔼💲

Big Money Is Pouring Into SOL – Is a Breakout Coming?When large capital starts flowing into Solana , SOLUSDT is no longer just another altcoin — it’s becoming a new safe haven for risk-on liquidity. Forward Industries recently announced that it now holds over 6.9 million SOL , making it one of the largest Solana treasuries in the world — a clear sign that institutional players are not just talking, but actually deploying capital.
On the technical side, the chart shows that SOL has broken away from its bottom structure and is now holding beautifully above the Ichimoku cloud. The area around 138 USDT has emerged as a new support zone: price has retested it multiple times without breaking, turning it into a solid base for accumulation. The current structure of higher lows confirms that buyers are still in control of the trend.
The most bullish scenario: SOLUSDT continues to consolidate above 138, compressing like a spring, before making a push toward the 153 USDT resistance area — exactly as projected on the chart. As long as price stays above 138 and the Ichimoku cloud remains below, the priority remains to buy dips, not to fight the trend.
In short, institutional inflows combined with a strong technical structure suggest that SOLUSDT is in a healthy, sustainable uptrend , and the current pullback looks more like an opportunity to enter, rather than a sign of weakness.

SOLUSDT – Long Setup Forming After Exhaustion
Price swept the lows and is now stabilizing below structure, showing early signs of seller exhaustion.
If buyers reclaim momentum, this becomes a clean continuation-reversal long setup.
• Direction: Long
• Entry Zone: 132.40 – 133.00
• Stop Loss: 127.99
• Target: 156.13
• R/R: High-quality expansion setup if price pushes back above the EMAs
Bias remains bullish as long as price holds above the recent liquidity sweep and does not break back below 128.
Watching for a clean break and close above the short-term EMA cluster to confirm the move.

SOLCRYPTOCAP:SOL is back on major support and price continues to respect the level as it has historically. Each prior defense led to trend continuation. From this base, the projected upside toward target implies up to 250 percent potential if structure holds.

SOL for $79?Greetings to all 😊
Many people in their personal messages asked about the possible further movement of the SOL coin, after it reached the previously designated goals (see the last review)
💡 I can say one thing: while the asset is trading under the important level of $189.31 , it is not worth considering purchases for a long time, since the context is short
◾️ The global picture looks like this: we have a 12M chart that shows the reaction from the zone of interest and the price moving below the support level
◾️ I would like to note that we also have the min of last year, which has accumulated liquidity - 79$
⚡️ All timeframes are in a descending structure
▫️ If the price does not recover its values > 180$ this month, then I will expect a decrease to low (79$)
▫️ on the chart of the month , the price is trading sideways
▫️ We have removed the nearest liquidity on the weekly chart and are showing a corrective movement
▫️ On the daily timeframe, the price came to trend support and is trading sideways
Here we are interested in two zones between which the price is squeezed:
resistance of $ 145 - $ 151
and support of $133.74 - $ 137.76
📌 While the price is in uncertainty between sellers and buyers, it is better to wait for the manifestation of one side and then make a decision.
📍 And remember: not every deal is your deal.
Good luck to all ☘️

SOLANA: Bullish Breakout Awaits Above 145SOLANA: Bullish Breakout Awaits Above 145
Solana is currently testing the upper boundary of its range-trading structure. A clean breakout above the 145 level would significantly increase the probability of a sustained bullish continuation.
For now, the price is still developing inside the pattern. However, with BTC showing signs of preparing for an upward move, SOLANA may follow the same bullish momentum in the near term.
If the price fails to break above 145, the corrective structure could extend, opening the possibility for a deeper pullback toward the 123 support zone before buyers attempt another push.
Key Upside Targets:
170
188
204
You may find more details in the chart!
Thank you and Good Luck!
❤️PS: Please support with a like or comment if you find this analysis useful for your trading day❤️

SOL reversal⚡ SOL/USDT – 1H Reversal Heating Up
BYBIT:SOLUSDT.P holding strong above $136–$138 support — EMA ribbon flipped green and momentum’s curling up.
If bulls defend this level, next leg targets $150 → $160+.
Break below $132 invalidates short-term setup.
“Golden pocket bounce. Calm before the breakout.” ⚙️
