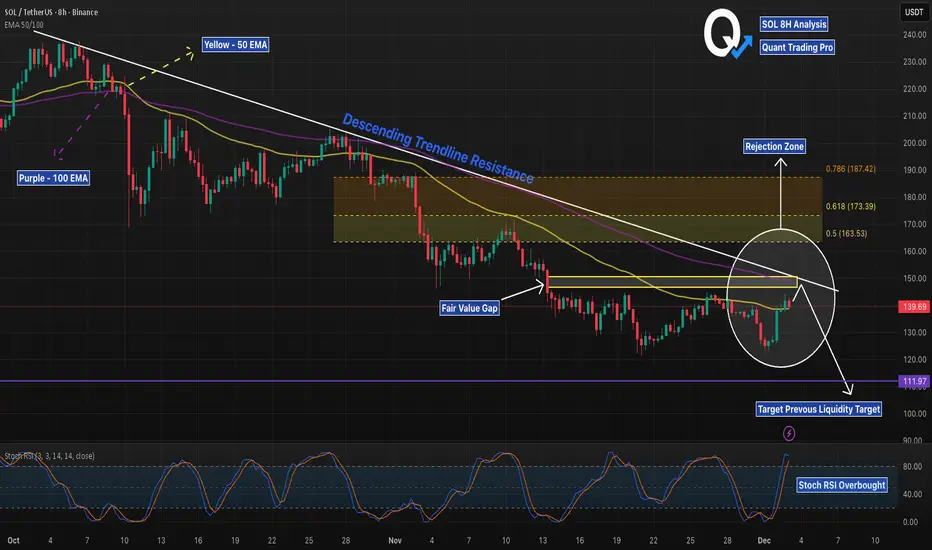
SOL 8H – FVG + EMA Rejection, Liquidity Next?SOL has tapped a clean multi-confluence rejection zone: the descending trendline, the 50/100 EMA cluster, and a filled Fair Value Gap all stack at the same price level. This area has acted as a strong pivot throughout November, and today’s reaction is consistent with prior trendline rejections.
The Stoch RSI is already in overbought territory on the 8H, adding momentum exhaustion to the setup. Bears will watch for continuation toward the major liquidity level around $111.97, which remains untested below.
For bulls to regain control, price must break and hold above the EMA cluster and FVG, flipping the trendline into support. Until then, the path of least resistance remains down toward liquidity.
Market insights
SOL/USDT : LIVE TRADEHello friends
considering the downtrend we have and the power of the sellers, we know that we should trade with the trend and be on the side of the one who has the market power.
So, at this stage, when we understand that our trend is down, we are now looking for the entry point that we have identified for you. This area that we have identified is the source of the price drop, which is full of sell orders. If the price pulls back to this area, when the sell orders are activated, they will cause the price to fall again.
This analysis is purely technically reviewed and is not a buy or sell offer, so do not be emotional and follow capital management.
*Trade safely with us*

Solana 4H analysisOverall Market Context
SOL is trading around $126.50 after a brutal correction from the all-time high zone (~$200+ visible on the left). The 4H chart shows a clear downtrend since late November, with lower highs and lower lows. Current bar down -1.80 (-1.40%), continuing the bearish momentum with price grinding along the lower part of the range.
Indicator Key Insights
Higher Timeframe Bias
Bearish (no green background visible — red HTF bias confirmed)
Strongly favors shorts or waiting for reversal signals. Longs remain high-risk counter-trend.
Anchored VWAP & SD Bands
Current AVWAP: 146.58
Price is -13.72% below VWAP — extreme bearish deviation, one of the largest in recent memory for SOL.
SD Bands (from current downswing):
±1σ: ~128.05 – 165.12
±2σ: ~109.51 – 183.66
±3σ: ~90.69 – 202.20
Price is hugging the lower ±1σ band (~128), indicating strong selling pressure. In downtrends, price often rides lower bands until exhaustion.
Volume Profile (Fixed Range from Recent Downswing)
POC (Point of Control): 137.62 — highest volume node acting as overhead resistance.
Value Area: Wide yellow/blue shading on the left — previous high-volume consolidation ~$135–$160.
Current price well below Value Area low → distribution phase complete, weak hands flushed.
Low-volume nodes below suggest potential for fast drops if support breaks.
Fibonacci Levels
From swing high (~202) to low.
Price rejecting repeatedly around 0.382–0.5 retracement zone (common in downtrends).
Golden Pocket (0.618–0.65) likely near $160–$170 — major resistance on any bounce.
Signals & Confluence
Last signal: Score 2 (weak/medium bearish) — lower confluence, but still triggered on AVWAP cross down.
No recent strong (4–5) signals visible — market in "grind lower" mode rather than sharp reversals.
Score 2 suggests AVWAP cross + one other factor (likely proximity), but missing full confluence.
Current Setup & Trade Ideas
Bearish Bias (Primary Scenario)
Continuation short or fade rallies:
Best entry: On bounce to POC (137.62) or AVWAP (146.58) with new sell signal (score ≥3).
Targets: Lower ±2σ (~109.50) or ±3σ stretch (~90.69).
Stop: Above recent swing high or upper ±1σ.
RR: Strong 3:1+ in trend.
Why strong: Extreme deviation below VWAP + bearish HTF bias + price below Value Area.
Bullish Reversal (Lower Probability – Counter-Trend)
Only on capitulation bounce with green triangle score ≥4.
Potential long if price holds lower ±1σ (~128) and shows strong reversal (e.g., volume spike + buy signal).
Target: POC (137) or VWAP retest.
High risk — against HTF bias and momentum.
Risks & Notes
Oversold/extreme deviation: -13.7% below VWAP is rare — watch for short squeeze or dead-cat bounce.
Solana-specific: Network news, meme coin flows, or BTC correlation can override technicals.
Best trades: Wait for higher-confluence sell signals on rally to POC/VWAP — classic "fade the rip" in downtrend.
If HTF bias flips green, reassess for potential bottom.
The indicator shows strong bearish control: massive deviation below VWAP, price rejected from POC repeatedly, and weak confluence signals still pointing down. The recent score-2 sell remains valid.
Primary play: Fade strength into POC/VWAP zone for continuation lower.
Trend is your friend until proven otherwise — stay patient.
Trade safe!

DeGRAM | SOLUSD is below $130📊 Technical Analysis
● SOL/USD remains locked in a broader descending channel after a sharp breakdown from the prior consolidation range. Price continues to respect the dynamic resistance line, while each rebound forms lower highs, confirming bearish market structure.
● The recent flag and consolidation patterns developed below resistance suggest continuation rather than reversal. A loss of the current consolidation floor exposes the major support zone near 115–110 as the next downside objective.
💡 Fundamental Analysis
● The broader crypto market remains pressured by risk-off sentiment and reduced liquidity, limiting upside momentum for high-beta assets like Solana.
✨ Summary
● Bearish trend intact below descending resistance. Key resistance: 135–140. Targets: 115–110. Invalidation above channel resistance.
-------------------
Share your opinion in the comments and support the idea with a like. Thanks for your support!

Chapter III: Treasure MapsThe mentor stood behind the apprentice, arms crossed, watching the kid flip through charts like he was scanning blueprints for a V8 rebuild. Terry had once stared at those same charts like they were ancient hieroglyphs. This kid? He was already mapping out trades with the confidence of someone who’d been doing it for years.
“Alright,” the mentor said, tapping the screen. “You’ve learned mirrors. You’ve learned reflections. You’ve learned candlesticks. Now it’s time for the real stuff.”
The apprentice raised an eyebrow. “Real stuff? I thought candlesticks *were* the real stuff.”
The mentor chuckled. “Candlesticks are like spark plugs... important, but they don’t tell you where the car’s going. Today, we talk treasure maps.”
The apprentice leaned in. “Treasure maps?”
“Charts,” the mentor said, “are treasure maps. Every line, every level, every pattern — it’s a clue. But here’s the trick: the treasure isn’t gold. It’s survival.”
The Mechanic, who had been pretending not to listen while sorting sockets, snorted. “Survival is right. I’ve seen more traders blow up accounts than engines.”
The apprentice nodded slowly. “So… what’s the treasure?”
“Consistency,” the mentor said. “The only treasure worth chasing.”
He pulled up a blank chart. No indicators. No colors. Just price.
“This,” he said, “is the map before you draw on it. Most people panic when they see this. They want indicators, signals, alarms, flashing lights. But a real trader learns to see the map underneath the noise.”
The apprentice studied the empty chart. “Looks like a desert.”
“Exactly,” the mentor said. “And in a desert, you don’t wander. You plan.”
He drew a single horizontal line.
“This is support. The ground beneath your feet.”
Another line above it.
“This is resistance. The ceiling above your head.”
The apprentice squinted. “So the treasure is between the lines?”
“Sometimes,” the mentor said. “Sometimes the treasure is knowing when to walk away from the map entirely.”
The Mechanic chimed in again. “Like when a customer brings in a car with three different noises and says ‘it only happens when it rains on Tuesdays.’ That’s when you walk away.”
The apprentice laughed, but the mentor stayed serious.
“Listen. Anyone can read a chart. But only a few can navigate one. You’re not looking for magic. You’re looking for structure. You’re looking for behavior. You’re looking for the path that makes sense.”
He zoomed out, revealing months of price action.
“This,” he said, “is the whole map. The coastline. The mountains. The valleys. The storms. Every trader who came before you left footprints here. Every panic, every rally, every mistake — it’s all recorded.”
The apprentice’s eyes widened. “So the map is alive.”
“Exactly,” the mentor said. “And your job is to follow it without losing yourself.”
The apprentice nodded slowly, absorbing the weight of it.
“So what’s my first task?” he asked.
The mentor smiled. “Simple. Draw your map. Mark your levels. Plan your route. And tomorrow, you’ll tell me where the treasure is.”
The apprentice grinned. “And if I’m wrong?”
The mentor shrugged. “Then you learn. Every wrong map teaches you how to draw the next one.”
The Mechanic tossed a rag over his shoulder. “And if you get lost, don’t worry. Terry got lost so many times we almost put a GPS on him.”
The mentor laughed. “True. But he found his treasure eventually.”
The apprentice looked back at the chart — the blank desert waiting to be explored.
“Alright,” he said. “Let’s find the map.”
And as he began drawing his first lines, the mentor felt something he hadn’t felt since Terry’s early days — that spark, that promise, that quiet thrill of watching someone discover their own path.
The treasure wasn’t gold.
It wasn’t profit.
It wasn’t even mastery.
The treasure was the journey.
And the apprentice had just taken his first step.
#SOLUSDT 6H ChartPrice has tested an extreme demand zone at around $124 where it bounced from and showed bullish reaction. It is expected to keep pushing upwards and liquidate the high at $146.87 before filling the imbalance above it.

SOL-USDTIt has reached its reliable bottom at $123. It has bounced off this level several times, so it can be counted on📊✔️
If it stays above this level, it could rise up to the upward trend line🔼💲

[LONG] SOLUSDT - I Think We Will See Pullback in LTFThis trade is using technical only
Before enter the trade, we must wait for confirmation Bullish Engulfing on OB / FVG Area then Enter.
1. Target Profit is 300++ pips
2. Set Stoploss on LL or under OB

SOL SHORT : CONSOLIDATION OVERSOL price breaks below lower channel of symmetrical triangle. Bearish continuation confirmed? Price in favour of shorts now with next support around $85-97

SOL 4H – Golden Pocket Rejection, Trend Pressure Still DownSOL continues to trade within a clearly defined bearish structure, with both the daily and 4H trendlines acting as dynamic resistance. The recent push into the 0.618–0.65 Fibonacci golden pocket was rejected cleanly, aligning with prior horizontal resistance near the 144 level — reinforcing this zone as a high-probability supply area.
Price remains capped below the 50 and 100 EMAs, which are now compressing and sloping downward, suggesting downside continuation unless structure is reclaimed. As long as SOL holds below the descending trendlines, rallies are best viewed as corrective rather than impulsive.
On the downside, range support near 123–124 remains the key level to watch. A clean break below this zone would open the door for expansion lower, while any bullish scenario requires a reclaim and hold above the golden pocket and trend resistance — something price has failed to achieve so far.
Momentum shows short-term relief attempts, but trend control remains firmly bearish until proven otherwise.

SHORT IDEA SOL is showing weak momentum after a failed push higher.
Price got rejected from resistance, and sellers are stepping in.
RSI is rolling over, showing bearish divergence and loss of strength.
As long as SOL stays below resistance, I’m expecting a move lower toward support.
Bias remains bearish until we see a strong reclaim.
Not financial advice. Trade with confirmation.

SOL-USDTSolana needs to break its downward trend line to rise 📌
The trend line coincides with a static resistance, so the condition for an upward move is breaking the $134 range 🕯📈
On the other hand, the important static support for Solana is still around $129 🚀, which is considered a key support level for it 🔼🚨

$SOL(SOLANA)⚜️ CRYPTOCAP:SOL / USDT — LONG
Currently holding a strong support zone at 120–130.
If this level holds, a potential pullback toward 160–170 is in play.

NLDN | SOLANA RANGING | NON-TRENDSOLANA stay daily range
accumulation or going down.
price in the middle.

SolanZoDear Traders
Solana on daily looks like it want to make a fakeout but theese are my targets if btc drop it will follow lets see

SOL LONG : CONSOLIDATION BREAK OUT?Feds cut rates and from the chart I count 7 waves inside the symmetrical triangle. Break out imminent ?

SOLusdt Binance 1Month Head and ShoulderSolusdt Binance 1M chart pattern created Head and Shoulder, Its not a financial advise


US Federal Reserve Policy and Global Interest Rates1. What Is the Federal Reserve’s Monetary Policy?
The Fed’s primary goals, set by Congress, are:
Price stability (keeping inflation in control)
Maximum employment
Moderate long-term interest rates
To achieve these goals, the Fed uses policy tools such as:
Federal Funds Rate (short-term interest rate at which banks lend to each other)
Open Market Operations (buying or selling government securities)
Quantitative Easing (QE) (large-scale bond purchases)
Quantitative Tightening (QT) (reducing bond holdings)
Forward Guidance (communicating expected future actions)
When inflation is high, the Fed raises interest rates. When growth slows or unemployment rises, it cuts interest rates.
Because the US dollar dominates global reserves, trade, and debt markets, these decisions extend far beyond American borders.
2. Why the Fed Influences Global Interest Rates
Several unique factors make Fed policy globally powerful:
a) The US Dollar as the World’s Reserve Currency
Around 60% of global foreign-exchange reserves are held in USD. Many commodities—including oil—are priced in dollars. Thus, changes in US interest rates influence global liquidity and trade.
b) Dollar-Denominated Debt
Many emerging economies, corporations, and banks borrow in dollars. When the Fed raises rates, it becomes costlier to repay these loans.
c) Global Capital Flows
US Treasury bonds are seen as the safest assets in the world. Higher US interest rates attract global investors toward US assets, draining capital from other countries.
d) Synchronization of Financial Cycles
When the Fed changes policy, other central banks often adjust their own rates to prevent currency volatility or capital flight.
These mechanisms explain why the Fed is sometimes referred to as the world’s central bank.
3. How Fed Rate Hikes Affect Global Interest Rates
When the Fed raises the Federal Funds Rate, the effects spread across the world in multiple ways.
a) Strengthening of the US Dollar
Higher US rates mean higher returns for investors holding US securities. As capital flows in, the dollar strengthens.
A stronger dollar puts pressure on other currencies, particularly in emerging markets such as India, Brazil, or Indonesia. Their central banks may raise local interest rates to defend their currency, control inflation, or stabilize capital flows.
b) Rising Global Borrowing Costs
Because global finance heavily relies on USD:
Dollar loans become costlier.
International trade financing becomes expensive.
Countries with large external debt face repayment challenges.
This can trigger slowdowns in emerging markets.
c) Decline in Global Liquidity
When the Fed raises rates or conducts QT, it reduces the amount of money circulating globally. As a result:
Risky assets decline
Global stock markets fall
Investments shift from emerging markets to US Treasuries
Financial tightening spreads internationally even if local central banks do not change policy.
d) Pressure on Other Central Banks
To avoid currency depreciation or capital flight, central banks worldwide often follow the Fed by raising their own interest rates. This phenomenon is known as interest rate contagion.
Even strong economies like the EU, UK, and Japan face pressure to respond—although Japan often operates independently due to its unique monetary policies.
4. How Fed Rate Cuts Impact the World
When the Fed cuts interest rates, the international effects reverse.
a) Weaker Dollar and Stronger Global Currencies
Lower US yields reduce the attractiveness of dollar assets. Investors move money to faster-growing markets, causing the dollar to weaken.
Emerging market currencies strengthen, reducing inflationary pressures.
b) Increase in Global Liquidity
Lower US rates inject more capital into the global system. This increases:
Stock market growth
Investment in emerging markets
Commodity demand
This environment often benefits economies seeking foreign investment.
c) Cheaper Dollar-Denominated Debt
Countries holding USD debt find repayments easier. Capital becomes accessible for expansion, infrastructure, and corporate investment.
d) Monetary Easing Worldwide
Lower Fed rates give other central banks room to cut their own rates without risking capital outflows or currency depreciation.
Thus, Fed easing stimulates global growth.
5. Case Studies Illustrating Fed Impact
a) 2008 Global Financial Crisis – QE Era
After the 2008 crisis, the Fed launched massive Quantitative Easing, buying trillions of dollars in bonds.
Effects included:
Record-low global interest rates
Huge capital flows to emerging markets
Commodity boom
Global stock market recovery
Central banks worldwide followed with their own easing programs.
b) 2013 Taper Tantrum
When the Fed hinted at reducing QE:
Bond yields spiked
Global markets fell
Currencies like INR, BRL, TRY depreciated sharply
EM central banks raised rates to defend currencies
This demonstrated how sensitive global markets are to Fed communication alone.
c) 2022–2023 Inflation Cycle – Rapid Rate Hikes
To control post-pandemic inflation, the Fed raised rates at the fastest pace in decades.
Consequences:
Dollar surged to multi-decade highs
Global interest rates rose
Many countries experienced currency depreciation
Debt burdens increased
Capital fled to US markets
This period highlights the Fed’s power over global monetary tightening.
6. Why Some Countries Are More Affected Than Others
Highly Affected Countries:
Emerging markets with high dollar-denominated debt
Nations heavily reliant on foreign investment
Economies with weaker currencies
Countries running current account deficits
Examples: Turkey, Argentina, India (moderate), Indonesia, Brazil.
Less Affected Countries:
Economies with strong reserves
Countries with low dollar exposure
Export-driven economies benefiting from a weak local currency
Examples: China (to some extent), Japan, Switzerland.
7. Fed Forward Guidance and Global Markets
Even before changing actual interest rates, the Fed influences global markets through forward guidance—signals about future policy.
Markets price in:
Rate hike expectations
Economic outlook
Inflation forecasts
This anticipation affects bond yields, stock markets, and currency valuations globally.
A single line from the Fed Chair can shift billions of dollars across borders within minutes.
8. The Bottom Line – Why Fed Policy Shapes the Global Economy
The Federal Reserve influences global interest rates because:
The US dollar anchors global finance.
Global trade and debt depend on USD.
Investors react instantly to US yields.
Other central banks adjust policy to protect stability.
Financial markets are highly interconnected.
In essence, Fed policy changes set off a chain reaction across global markets—impacting foreign exchange rates, capital flows, inflation, borrowing costs, and overall economic growth.
Conclusion
The Federal Reserve’s monetary policy is not just an American concern—it is a global variable. Whether raising, cutting, or maintaining interest rates, the Fed influences global economic conditions more than any other central bank on earth. Countries adapt their policies based on Fed decisions to protect currencies, control inflation, and maintain financial stability. As long as the US dollar remains the world’s dominant reserve currency, the Fed will continue to shape global interest rates and the broader financial landscape.
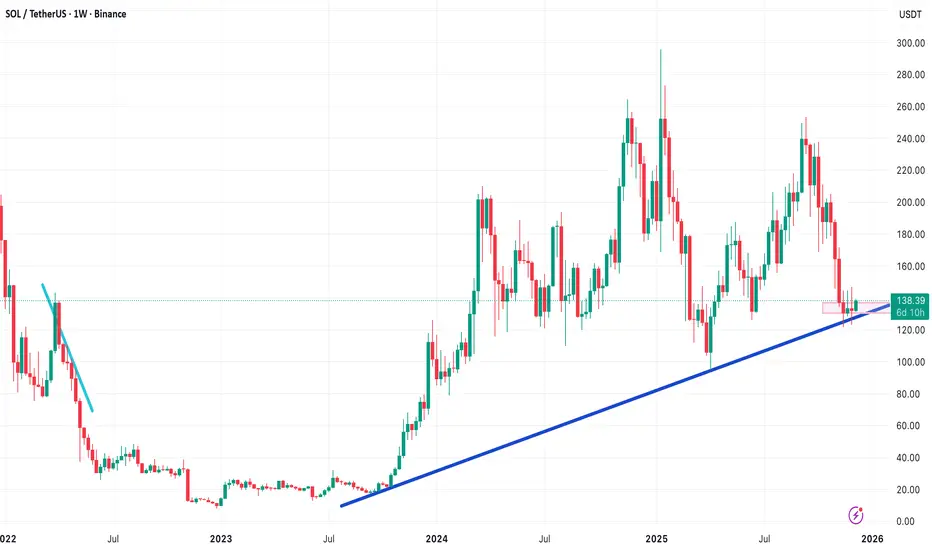
Solana (SOL) Technical Analysis – Critical Weekly Support ZoneSolana is currently trading at a high-stakes technical level, sitting directly on its major weekly ascending trendline. This area is extremely important and could determine the next mid-term direction of the market.
📉 Bearish Scenario
If the ascending trendline and the key support at $130 break down with a strong confirmation candle and price closes below this level, a deeper correction becomes likely.
Potential downside targets:
$120
$112
$99
These levels may act as important support zones where buyers could re-enter.
📈 Bullish Scenario
If Solana manages to break above the $137 resistance with a strong bullish candle, we may see the beginning of another upward move.
In this case, the pullback to $137 could offer a valid long entry.
Upside targets:
$150
$162
$171
These levels represent key mid-term resistances.
✅ Summary
Solana is positioned at a decision point on the chart.
A confirmed breakout or breakdown from this zone will likely set the trend for the coming weeks. Traders should closely monitor price action and candle confirmations around $130–$137.
How Trade Shapes Global Currency1. The Basic Mechanism: Supply and Demand in Currency Markets
At its core, currency value is influenced by supply and demand. International trade directly affects this supply-demand dynamic. When a country exports goods and services, foreign buyers need to purchase its currency to pay for these exports. For instance, if the United States exports machinery to Germany, German importers must buy U.S. dollars (USD) to complete the transaction. This demand for USD increases its value relative to the euro (EUR). Conversely, when a country imports goods and services, it needs foreign currency to pay overseas suppliers, which can increase the supply of its own currency in the global market, potentially causing depreciation.
Trade, therefore, is a continuous flow of currency exchange. Countries with strong export-oriented economies often see their currencies strengthen, whereas nations with large import bills may experience downward pressure on their currency unless offset by foreign investment or other capital inflows.
2. Trade Balances: Surplus and Deficit
A critical concept in understanding currency dynamics is the trade balance — the difference between a country’s exports and imports. A trade surplus occurs when exports exceed imports, meaning foreign buyers are consistently demanding more of the country’s currency. This sustained demand strengthens the domestic currency. For example, China has historically maintained trade surpluses, contributing to the upward pressure on the yuan.
Conversely, a trade deficit happens when a country imports more than it exports. This scenario increases the domestic currency supply in the foreign exchange market, potentially weakening it. The United States, which often runs trade deficits, relies on capital inflows and investment from abroad to offset this pressure. Persistent trade deficits can lead to concerns about a currency’s long-term value, influencing both foreign exchange markets and domestic economic policy.
3. Currency and Competitiveness
Trade also affects currencies through competitiveness. A weaker currency makes a country’s exports cheaper and more attractive to foreign buyers, stimulating export growth. Conversely, a stronger currency can make imports cheaper, benefiting consumers but potentially harming domestic exporters. Central banks sometimes intervene in currency markets to maintain trade competitiveness. For instance, Japan has historically intervened to prevent excessive appreciation of the yen, which could harm its export-driven economy.
4. Capital Flows and Trade-Related Investment
Trade flows often create parallel capital flows. Companies engaged in international trade may invest in foreign markets to streamline supply chains, leading to cross-border investments. These capital movements can reinforce currency trends created by trade. For example, if a European company invests heavily in the United States, it must convert euros into dollars, creating additional demand for USD and supporting its value. Therefore, trade indirectly stimulates currency movement through associated foreign direct investment (FDI) and portfolio flows.
5. Global Reserve Currencies
Trade patterns also shape the global status of currencies. The U.S. dollar, euro, and Japanese yen are widely used as reserve currencies, largely due to historical trade dominance and economic stability. Countries conducting significant trade in dollars tend to hold large USD reserves to facilitate international payments. This demand for reserve currencies reinforces their global value and liquidity. The dominance of reserve currencies can influence global trade, as nations often price commodities like oil and metals in major currencies, creating a feedback loop between trade and currency value.
6. Trade Policies and Currency Volatility
Trade policies such as tariffs, quotas, and trade agreements can directly impact currency values. Protectionist measures, like high tariffs on imports, can reduce trade volumes, affecting currency demand. For example, if the U.S. imposes tariffs on Chinese goods, demand for Chinese yuan may decline because fewer U.S. businesses need it to pay for imports. Similarly, trade agreements that boost cross-border commerce can enhance currency stability by creating predictable demand patterns. Investors monitor trade negotiations closely because even rumors can trigger significant currency volatility.
7. Exchange Rates and Global Competitiveness
Currencies are also shaped by the relative strength of trading partners. A country’s trade performance depends not just on domestic policies but also on the economic health and currency strength of its partners. For instance, a slowdown in the European economy can reduce demand for Asian exports, weakening the currencies of export-dependent Asian nations. Moreover, countries sometimes engage in competitive devaluation, deliberately weakening their currency to boost export competitiveness, which can trigger a cycle of trade-related currency adjustments globally.
8. The Role of Speculation
Finally, trade expectations drive currency speculation. Traders in the foreign exchange market closely monitor trade data, such as import/export volumes, trade deficits, and agreements, to anticipate currency movements. If a nation reports a record trade surplus, traders may buy its currency in anticipation of appreciation. Conversely, unexpected trade deficits or disruptions can trigger rapid selling, causing currency depreciation. Speculation based on trade data can amplify currency swings beyond what actual trade flows would dictate, illustrating the psychological dimension of trade-driven currency movements.
9. Long-Term Implications
Over the long term, sustained trade patterns shape economic strategy and currency policy. Export-oriented economies often maintain strong currencies, invest in industrial capacity, and manage reserves to stabilize exchange rates. Import-reliant nations may adopt measures to attract foreign investment to support their currency. Global trade imbalances can also lead to currency realignments, with under- or overvalued currencies influencing global competitiveness and economic growth. For instance, the rise of China as a global exporter has significantly influenced the valuation of the yuan, affecting trade flows worldwide.
Conclusion
In essence, trade shapes global currencies through a complex interplay of supply-demand dynamics, trade balances, competitiveness, capital flows, policy decisions, and market expectations. Exports drive demand for a country’s currency, imports increase its supply, and trade policies and agreements can amplify or moderate these effects. The interconnected nature of the global economy means that a change in trade patterns in one region can reverberate across multiple currencies. As global trade continues to evolve, currencies will remain both indicators and drivers of economic performance, reflecting the intricate relationship between commerce and financial markets. Understanding this relationship is crucial for governments, businesses, and investors seeking to navigate the ever-changing landscape of global trade and currency markets.

SOL 1W – FVG Cleared/Fib Reset Tagged, Is the Reversal Starting?SOL has reached a major confluence area on the weekly chart, tagging the broader Fib Reset Zone and reacting directly from long-term Trendline Support. This is the same structural level that launched previous multi-month rallies, making this an important point for potential reversal.
Price is also sitting just above the 0.618 retracement — historically one of SOL's strongest reaction levels — while the weekly Stoch RSI is emerging from oversold conditions, a signal often seen near macro turning points.
The declining 50/100 EMAs still create overhead pressure, but reclaiming these EMAs would confirm a shift in weekly trend structure and open the door for a broader recovery leg.
If the trendline fails, the lower demand zone becomes the next logical retest. But as long as SOL continues to defend this diagonal and build higher closes inside the Fib Reset Zone, the case for reversing the multi-month downtrend strengthens.
This is one of the most important weekly levels SOL has approached all year.

SOL-USDT
The 2-hour chart is still stuck around $145. Here, we should wait for either a break of resistance and continuation of the trend up to $157 🔼🔼 or a consolidation below resistance and the start of a corrective phase down to $138 🔽🔽
You can take the consolidations I mentioned for positions on the hourly chart 📣✔️
