Solana Eyes Short-Term Bounce as Technical Setup StrengthenBINANCE:SOLUSDT 's price has come under pressure in recent days, falling nearly 10% from its local high. But despite the pullback, a rare technical pattern and steady institutional demand suggest the trend could be gearing up for a reversal.
On the daily chart, BINANCE:SOLUSDT is on the verge of a golden crossover, a bullish signal that occurs when the 100-day EMA crosses above the 200-day EMA. Historically, this setup has preceded short-term rallies. BINANCE:SOLUSDT is currently holding just above the $160 support level, and a move above $176 could confirm bullish momentum.
If price extends past $188, the next psychological target sits at $200. However, if BINANCE:SOLUSDT breaks below $155, downside pressure may build. A full invalidation occurs if the EMAs flip bearish, where the 200-day EMA overtakes the 100-day, forming a potential death crossover.
SOL’s balance on centralized exchanges has dropped nearly 10% since July 23, falling from 33.06 million to 30.78 million tokens. This reduction in available supply has coincided with a repeat of a historical crossover pattern, where price moves above the exchange balance trendline.
In past instances, such as on July 16 and July 24, this crossover preceded multi-day rallies. The latest crossover happened near $169. Although the price has pulled back, the trend remains valid as long as supply stays low and price holds above the $160 zone.
While SOL’s spot price corrected over the past week, CME futures open interest held steady. This divergence often suggests that larger players are maintaining their long exposure, waiting for weaker hands to exit.
A similar divergence in late July saw price rebound from $184 to $188 once open interest stabilized. As long as CME activity remains steady or rises, institutional sentiment will likely continue to act as a support buffer beneath current BINANCE:SOLUSDT price levels.
Market insights

double Top patterntrend still bearish we have another Lower lower and i see Double Top pattern in 4 hour Time Frame i could say maybe we reach 160
SOL LONG Price respecting golden area demand zone . If bulls manage to defend this area next target is 240 resistance zone.
MACD also looking bullish on 1hr and 4hr chart.

SOLUSDT Potential targetsIf SOL aims for higher targets, these could be achievable by late August or early September.
Let's wait and see what unfolds next.
We're keeping our hopes high for these targets and aiming to secure a strong position in the market.
SOL | Solana Game Plan - Swing Long IdeaSOL | Solana Game Plan - Swing Long Idea
📊 Market Sentiment
Market sentiment remains bullish, supported by expectations of a 0.25% rate cut at the upcoming FOMC meeting. The weakening USD and rising risk appetite across global markets continue to favor crypto assets.
We’re currently seeing a minor retracement, primarily driven by the Nasdaq’s pullback — but the overall outlook for the crypto market remains bullish in the weeks ahead.
📈 Technical Analysis
Price was rejected from the HTF bearish trendline near $207 and is now retracing.
The retracement aligns with a HTF bullish trendline, which I believe could spark a strong move to the upside.
This area also aligns with the 0.5 Fibonacci retracement level (discount zone) and a HTF demand zone — forming a strong confluence for a potential bounce.
📌 Game Plan
I want to see price hit the HTF demand zone at $152 (purple box).
It should also tap the bullish trendline.
The zone aligns with the 0.5 Fibonacci level — my key discount area.
🎯 Setup Trigger
After these levels are tagged, I’ll be looking for a 4H bullish break of structure, which should also form a new 4H demand zone for confirmation.
📋 Trade Management
Stoploss: Below swing low of the 4H demand zone
Targets:
• TP1: $188
• TP2: $207
• TP3: $297
I’ll trail my stop to lock in profits aggressively as price moves in my favor.
💬 Like, follow, and comment if this breakdown supports your trading!
More setups and market insights coming soon — stay connected!

SOL's Golden Pocket: Is This the Bottom?SOL just tapped into the golden pocket zone and swept sell-side liquidity. Creating a high-probability long opportunity.
🟢 Long Setup:
Entry Zone: $156.67 – $151.50
Stop Loss: Below $150 (clear invalidation)
Target: $172
Risk:Reward: solid R:R setup
Why This Zone? Confluence Breakdown:
Golden Pocket retracement (0.618–0.666)
1.272 Trend-Based Fib Extension
Monthly Order Block
0.5 Fib Speed Fan support
Key Level at $154.81
Anchored VWAP support layer
Pitchfork 0.618/0.666 alignment
SSL (Sell-Side Liquidity) swept
nPOC at ~$152 offers a prime entry if we see another leg down
💡 Tip: Ladder in entries within the zone and size up near nPOC if price dips further. Manage risk carefully and watch how price reacts at the zone.
🧠 Educational Insight
Golden pockets (the 0.618–0.666 Fibonacci zone) are some of the most respected levels in trading often acting as key reversal zones, especially when stacked with other tools. In this case, we’ve got a rare confluence: anchored VWAP, nPOC, monthly OB, SSL sweep etc. all lining up with the golden pocket.
When multiple technical factors align, they don’t just increase probability, they give you a tighter invalidation and a better risk-to-reward setup. That’s how professional traders spot sniper entries.
_________________________________
💬 If you found this helpful, drop a like and comment!


SOL 1H – Demand Zone Bounce Brewing, Can Bulls Reach $205 Again?Solana is once again testing its high-volume demand zone near $155–$160 — a level that previously launched it toward local highs near $210. With price dipping back into this area and Stoch RSI bottoming out, the stage is set for a potential bounce play.
🔹 Structure & Key Zones
The blue box marks a clear price memory zone — tested multiple times throughout late July and early August.
Each bounce from this zone has led to significant rallies — suggesting strong underlying demand.
Two major resistance levels remain overhead: ~$195 (lower high supply) and ~$210 (range high).
🔹 Momentum Context
Stoch RSI is once again in the oversold zone, hinting at possible short-term reversal momentum.
A clean reaction from this demand area could lead to a strong leg higher — especially if the $170–$175 zone is reclaimed.
🔹 Trade Scenario
Potential setup: price tags demand → forms a local higher low → pushes through short-term resistance toward the upper range.
If this bounce plays out, bulls may target the $195–$205 zone — creating a potential 30%+ move.
Is SOL ready to bounce — or will this demand zone finally give way?
Comment below and share your setup 👇

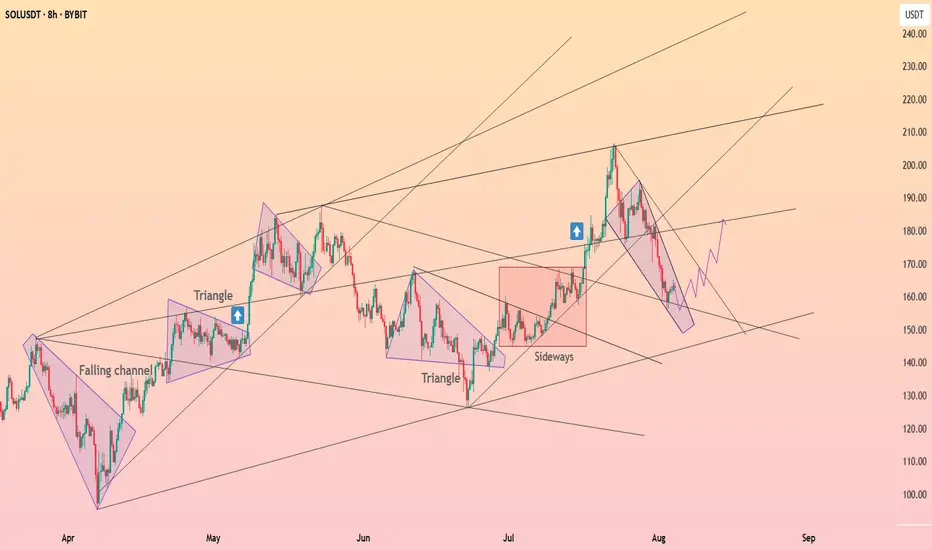
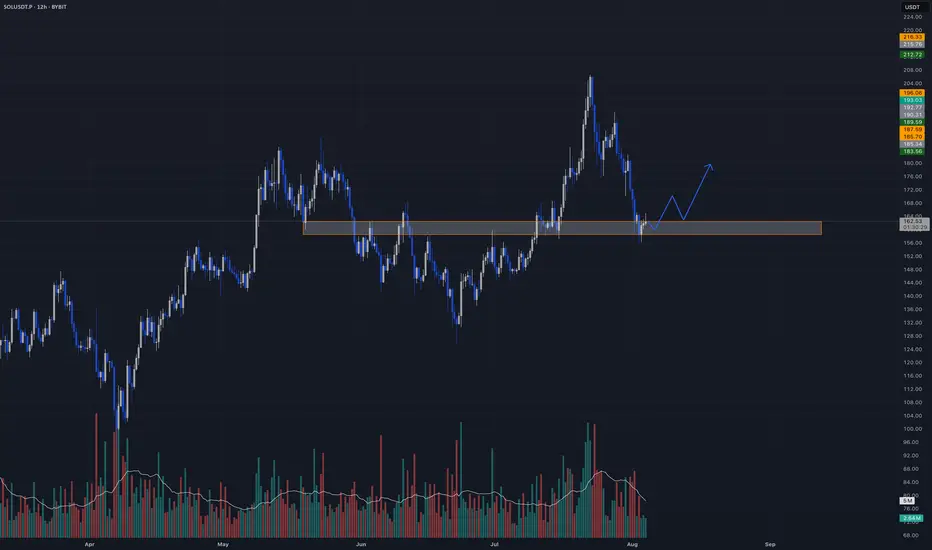
Solana is forming the falling wedge ┆ HolderStatBYBIT:SOLUSDT is moving within a falling channel after the recent drop from $200. Previous triangle breakouts led to rallies, and the current setup resembles earlier accumulation zones. A break above the channel could lead to $180 upside.
next important Supportif the support break in 160 price its become resistance and i think next and strong support is 151

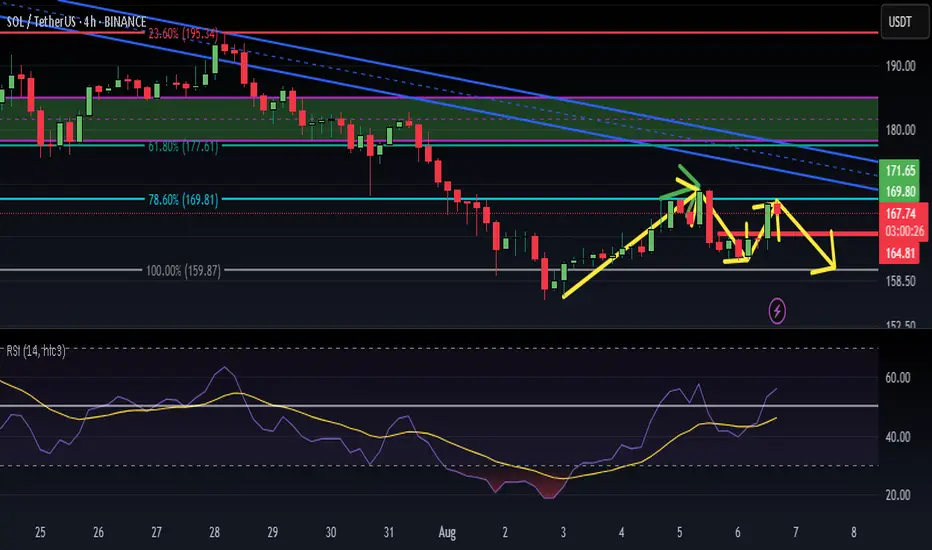
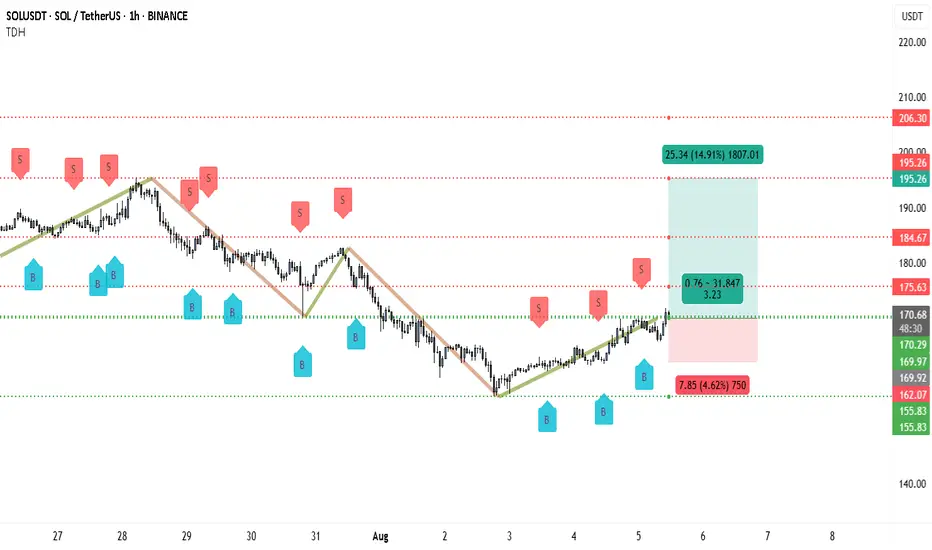
From $162 to $195 — Solana’s Next Big Move Could Be StartingSolana has recently rebounded from a strong demand zone around $162.07–$155.83 after an extended downtrend. This support has held multiple times over the past few sessions, showing that buyers are defending it aggressively. The “B” buy signals near these lows further support the case for an upward move.
Price has now broken above the $170.29–$169.97 resistance area, which has flipped into immediate support. Holding above this zone strengthens the probability of continuation toward the next key resistance levels.
The first resistance to watch is $175.63, followed by $184.67. If price sustains above these zones, the major bullish target lies near $195.26, aligning with the top of the projected profit zone in your chart.
From a structure perspective, the pattern suggests a potential short-term trend reversal, with higher lows forming since August 3. This change in market structure, combined with the break above the recent consolidation, indicates renewed bullish momentum.
Trading Setup
• Entry: Around $170.80–$171.00 (above breakout confirmation)
• Stop-loss: Below $169.90 or deeper at $162.00 for wider protection
• Take-profit 1: $175.63
• Take-profit 2: $184.67
• Final Target: $195.26
• Risk-Reward: Approximately 3.2:1
Risk Caution
Solana is known for sharp intraday swings. Traders should consider locking partial gains once the price moves 2–3% in their favor (about +3–5 USDT from entry) to protect capital while still holding for the larger target.
Weekly trading plan for SolanaPrice is currently testing the weekly pivot point, but significant resistance remains overhead. We could see a fake breakout of the descending channel before a true downside move materializes.
Key Levels & Scenarios:
Primary Target: $136-146 range
Bullish Invalidation: A confirmed break & hold above $182 would shift bias, opening path to $200
Until we clear $182 decisively, the structure remains bearish. Trade the ranges carefully.

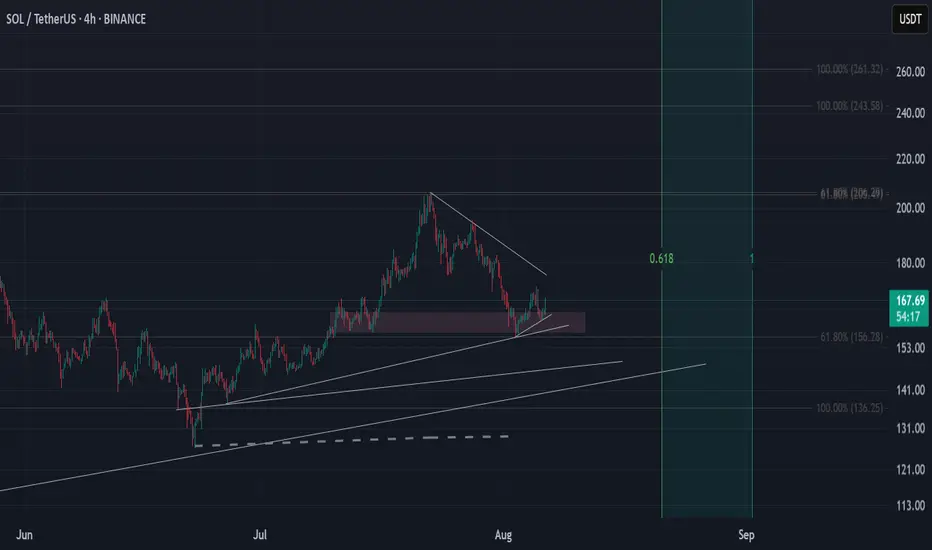
Lingrid | SOLUSDT Corrective Move Completed ? Long OpportunityBINANCE:SOLUSDT is forming a bullish higher low just above the 158.47 support after a corrective pullback from the recent higher high. Price structure remains within the upward channel, and the rebound from key horizontal support signals a continuation setup. As long as the 158.47–160.00 zone holds, price is likely to target the 192.00 resistance near the channel's top. The ascending structure supports a bullish continuation toward the upper resistance band.
📉 Key Levels
Buy trigger: Break above 172.00
Buy zone: 158.47 – 160.00
Target: 192.00
Invalidation: Drop below 150.00
💡 Risks
Breakdown of the ascending structure below 150.00
Rejection near 172.00 without momentum confirmation
Broader market weakness could suppress breakout potential
If this idea resonates with you or you have your own opinion, traders, hit the comments. I’m excited to read your thoughts!

SOLUSDT📊 #SOLUSDT
⏱ TIME: 1D
⭕️risk: mid
📍The initial buying market: 168-169
📌TP1: 192$
📌TP2: 224$
⛔️SL: 144$
❌These analyzes are just to give a better perspective for you dear ones
Do not base on buying and selling❌

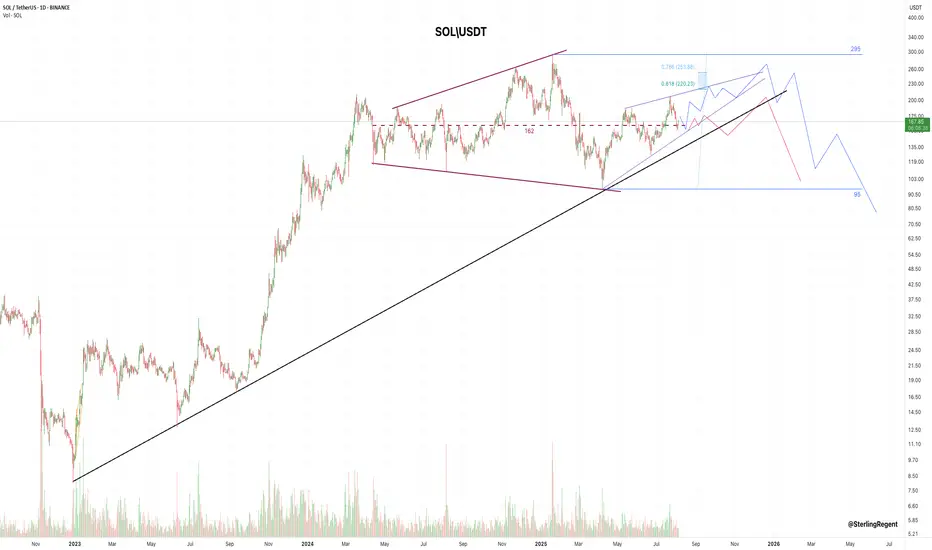
SOLUSDT- Golden Pocket Bounce: Bullish Phase or Another Fakeout?🔍 In-Depth Technical Analysis (1D Timeframe)
The SOL/USDT pair is currently showing a highly significant technical reaction as price bounces from the Fibonacci Retracement 0.5 - 0.618 zone (also known as the Golden Pocket), located between $166.63 - $157.13.
This level also aligns perfectly with a historical demand zone that has previously acted as a strong support during high-volume selloffs, creating a powerful confluence area.
---
🧩 Market Structure & Pattern
✅ Golden Pocket + Demand Zone: This overlap strengthens the probability of a valid bullish reversal.
🟠 Previous Movement: Price dropped from the recent swing high near $188 after failing to break through major resistance.
📉 Short-Term Downtrend: Currently in a corrective phase after an earlier bullish run.
---
🟢 Bullish Scenario (Rebound Confirmed from Golden Pocket)
If the price manages to hold above the $157 - $166 range and prints a bullish candle with volume confirmation:
1. A bullish breakout above $179 and more importantly $187.80 could open the door to further upside.
2. Potential midterm bullish targets:
🎯 Target 1: $205.69 (key psychological + structural level)
🎯 Target 2: $218.13 (previous reaction zone)
🎯 Target 3: $257.10
🎯 Target 4 (macro): $295.14
> The current zone offers an attractive risk-to-reward opportunity for swing traders, as long as the higher low structure is maintained.
---
🔴 Bearish Scenario (Breakdown from Key Support Zone)
Should the price break below $157 with strong selling volume:
1. That would invalidate the bullish setup and suggest a shift in structure.
2. Potential deeper correction targets include:
⚠️ Support 1: $140 (minor support from past structure)
⚠️ Support 2: $122 - $110 (major support zone from March–April 2025)
> A confirmed breakdown here would likely initiate a lower high – lower low structure, signaling a possible shift into a bearish medium-term trend.
---
📌 Additional Key Indicators to Watch
🔄 Volume Spike: Essential for validating any breakout or breakdown.
📉 Daily RSI: If RSI shows bullish divergence or bounces from oversold territory, that would strengthen the bullish case.
⏳ Daily Candle Close: Monitor the next 2–3 daily candle closes around this key zone for directional confirmation.
---
💡 Conclusion
SOL is at a crucial inflection point. The reaction around the $157 - $166 support confluence will likely determine the medium-term trend:
Bullish: If price reclaims $179–$188 zone with strong momentum
Bearish: If price breaks below $157 and closes with volume
This could be a high-reward opportunity for technical traders if confirmed properly.
---
🧠 Suggested Strategy:
🔹 Entry: Upon bullish confirmation in current demand zone
🔹 Stop Loss: Below $155 (for swing setups)
🔹 Take Profit Zones: $179 → $205 → $218 → $257+
#SOLUSDT #Solana #CryptoTechnicalAnalysis #FibonacciLevels #GoldenPocket #PriceAction #CryptoReversal #SwingTradeSetup #Altcoins #CryptoChart

Solana Technical AnalysisBINANCE:SOLUSDT
Solana ( CRYPTOCAP:SOL ) Technical Analysis:
Last week, #Solana closed below its daily resistance level of $184.13 on Monday and subsequently declined by 13.44% over the next five days. The decline found support around the 200-day Exponential Moving Average (EMA) at $162.75 on Sunday. Notably, this EMA level aligns closely with the 61.8% Fibonacci retracement at $163.40, establishing a key support zone.
At the start of this week, SOL rebounded by 4.68% on Monday, and as of Tuesday, it is trading near $168.67.
If the 200-day EMA at $162.75 continues to hold as a support level, there is potential for SOL to extend its rally toward the daily resistance at $184.13.

Another formation of head and shoulderSolano possibly forming a head and shoulder weekly pattern. Watching the support is critical which confirms the head and shoulder pattern and a reversal opportunity to a lower target such as the trendline support or even lower. An invalidation of the left shoulder open opportunity to break out the ATH and target higher. The weekly moving average holding a support at the moment and price didn't dip lower. Keeping major economics in mind the higher highs and expectation of cutting interest rate could invalidate the head and shoulder pattern.

Smart Money Dip Buy Setup🚨 SOLUSDT – Smart Money Dip Buy Setup 🚨
Hey Candle Fam,
Solana just did what it does best — scared retail out of their positions, grabbed liquidity like it was on sale, and now it’s chilling in the weekly demand zone like nothing happened. Classic.
🎯 LONG Setup
Entry: $162.5–$158.5
Stop Loss: $155.0
Targets: $175 / $190 / $210
📊 Strategy: HTF Demand + Liquidity Grab
– Weekly: Still bullish — engulfing setup into strong OB zone ($160–$180)
– Daily: Healthy correction from $205 top; now testing major support
– 1H: Accumulation signs brewing (equal lows + seller fatigue)
– Footprint: Delta flipping, low-volume cluster forming around $160
⚠️ Below $155 = full structure break. No mercy.
This ain’t hopium — it’s planned structure.
Respect the zone. Let them overleverage.
We execute with patience and calm.
Candle Craft | Signal. Structure. Execution.
SOL may test 170 before fallingThe SOL structure is quite weak. The price previously broke the upward trend and entered the range of 170-157 as part of a downward movement.
The market is reacting to Bitcoin's rebound, and in this case, SOL may test resistance at 169-170 before falling.
The upward trend has been broken by a H&S reversal pattern. The potential is temporarily changing, and before the long-term bullish trend continues, the market may test deep areas of interest from the support side.

is trend bullish or bearish?look at this canal we are in lower low and lower high trend is bearish !!but know i think trend is still bearish why becuase we havnt reach the upper band the canal it must break the upper band
to sure bullish trend is start again its take a time maybe 1 or 2 month but now we are in another Lower low again in 170 price after touch it and reject it maybe market goes down just remmember this post for now i think a long and exit in 170 maybe good .ijust wana trust myself again i wait for its will be happen

my emotion ruin my tradei understand the market after 3 years watching learning thinking i reach a level i could predict the future price in 70 % come true but my emotion destroy every think i analized my fear my greed make my patient low i dont know what should i do ?a lot of adrenalin come to my body fear greed if you see my post please help me to do some thing next post i talk about trend

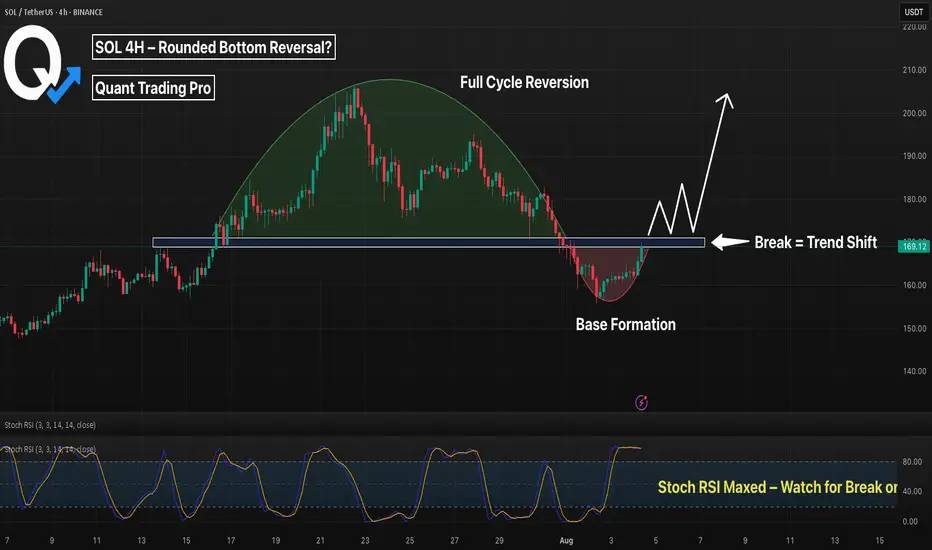
SOL 4H – Rounded Bottom Forming, But Will It Break the Neckline?Solana may be completing a rounded bottom formation on the 4H chart — a classic reversal pattern that often signals a shift from distribution to accumulation. After a deep pullback from July highs, SOL has carved out a smooth base with clear curvature, now pressing into the neckline resistance around $169–$171.
The structure resembles a full cycle: a rounded top leading into a rounded bottom — a potential "cup" formation. With Stochastic RSI pushing into overbought territory, we’re approaching a key decision point.
🔍 Key Factors:
– Rounded bottom structure shows controlled re-accumulation
– Neckline acting as current resistance (watch for breakout)
– Break + retest could trigger the next leg toward $185–$190
– Failure to break may lead to chop or retrace toward $158–$160
This pattern often precedes explosive continuation if volume confirms the breakout.
Will SOL confirm the reversal — or is this just another trap?
👇 Comment your thoughts below.