SOL/USDT: Bearish Structure Intact Below 155 Confluence ZoneSOL/USDT is approaching the 150–155 resistance cluster, where key technical levels—including the descending trendline, horizontal supply, and local upward trendline—converge. Despite a sharp rebound, the overall trend remains bearish, with lower highs dominating the structure. Recent price action appears corrective, not impulsive, suggesting this move may be a retracement rather than a true reversal.
If price gets rejected from this confluence zone, the bearish continuation toward 133 becomes the base case. Deeper downside could follow toward the mid-channel support unless bulls reclaim ground decisively.
➡️ Primary scenario: Rejection from 150–155 → drop toward 133
❗️ Risk scenario: Break and close above 155 would flip bias short-term bullish.
Market insights

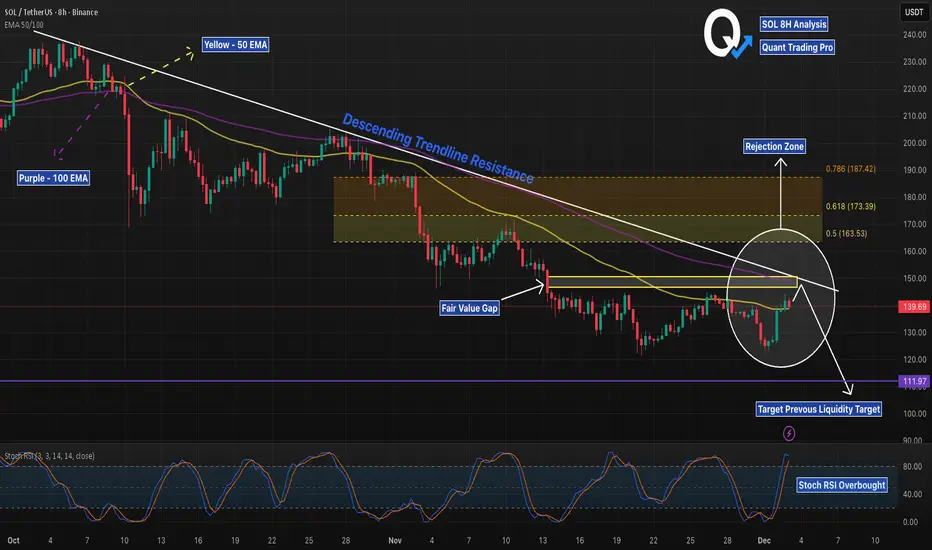
SOL 8H – FVG + EMA Rejection, Liquidity Next?SOL has tapped a clean multi-confluence rejection zone: the descending trendline, the 50/100 EMA cluster, and a filled Fair Value Gap all stack at the same price level. This area has acted as a strong pivot throughout November, and today’s reaction is consistent with prior trendline rejections.
The Stoch RSI is already in overbought territory on the 8H, adding momentum exhaustion to the setup. Bears will watch for continuation toward the major liquidity level around $111.97, which remains untested below.
For bulls to regain control, price must break and hold above the EMA cluster and FVG, flipping the trendline into support. Until then, the path of least resistance remains down toward liquidity.
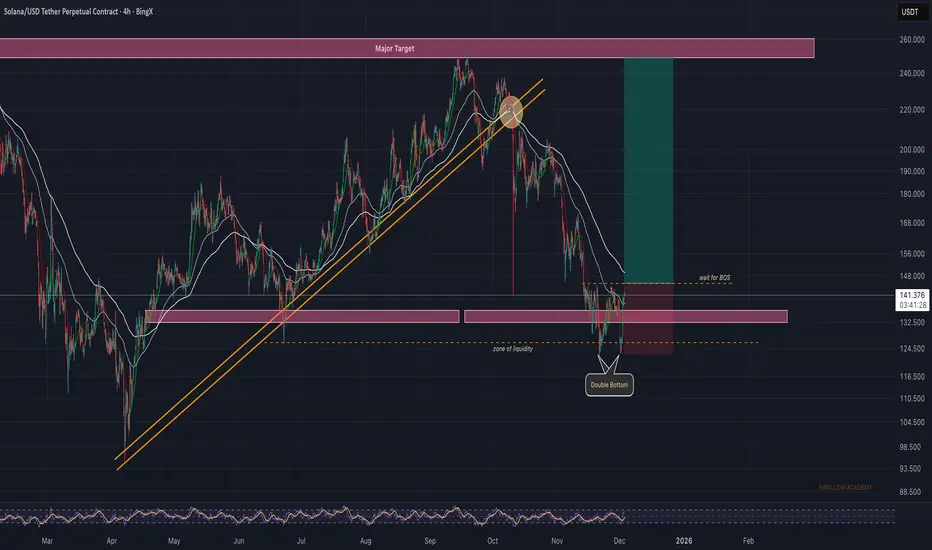
Solana (SOL): Expecting the Break of Structure Here | Bullish AFSOL printed a clean double bottom right inside the higher-timeframe support zone, which shows buyers are defending this area well. Now we need to see a proper BOS above the local structure to confirm that momentum is shifting back to buyers.
If that happens, the path toward the higher targets opens up, and this whole region becomes a solid long setup to work with.
Swallow Academy
DeGRAM | SOLUSD is preparing to reach the $160 level📊 Technical Analysis
● SOL rebounded sharply from the major support zone near 130, breaking the inner falling channel and signaling a shift in short-term structure. Price is now forming a bullish continuation pattern beneath dynamic resistance, with room to extend toward the 160 level once the breakout is confirmed.
● Prior triangle, consolidation, and flag formations all resolved downward but now price is rejecting lows more aggressively, indicating accumulation.
💡 Fundamental Analysis
● SOL benefits from rising network activity and renewed inflows into high-performance L1 ecosystems, while broader risk sentiment improves across crypto majors.
✨ Summary
● Bullish bias above 130. Targets: 150 → 160. Support: 130. Resistance: 160.
-------------------
Share your opinion in the comments and support the idea with a like. Thanks for your support!

#SOL/USDT Final Liquidity Zone Before Expansion?#SOL
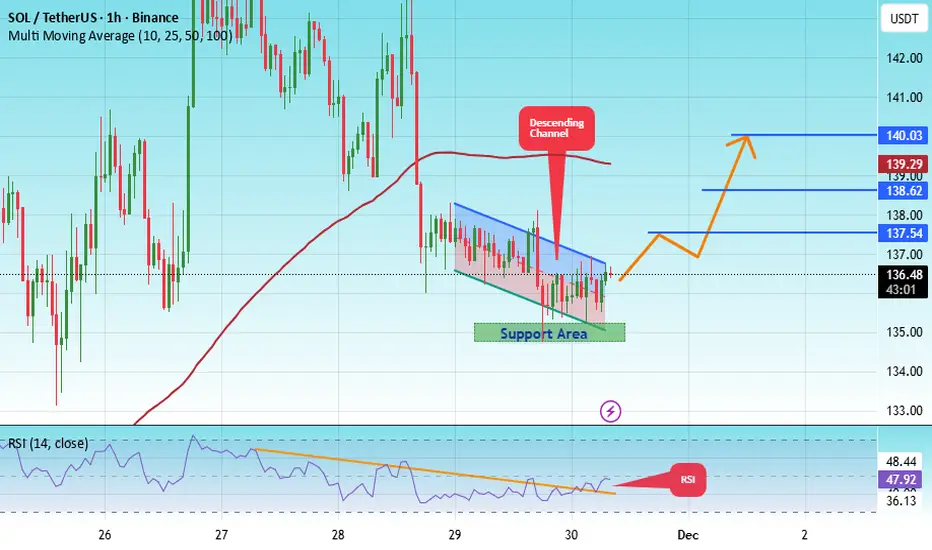
The price is moving in a descending channel on the 1-hour timeframe. It has reached the lower boundary and is heading towards breaking above it, with a retest of the upper boundary expected.
We have a downtrend on the RSI indicator, which has reached near the lower boundary, and an upward rebound is expected.
There is a key support zone in green at 135. The price has bounced from this zone multiple times and is expected to bounce again.
We have a trend towards stability above the 100-period moving average, as we are moving close to it, which supports the upward movement.
Entry price: 136.60
First target: 137
Second target: 138
Third target: 140
Don't forget a simple principle: money management.
Place your stop-loss below the green support zone.
For any questions, please leave a comment.
Thank you.
SOL Confirms Bearish PatternSOL Confirms Bearish Pattern
On Friday, Solana confirmed a larger bearish pattern following Trump’s comments.
So far, the pattern remains valid, showing signs of a larger decline. Whether that happens remains to be seen in the coming days or weeks.
But given that BTC has started to correct further, it is possible that SOL could fall back to at least the 170 price zone, which was also tested on Friday.
The main targets I am considering if the price moves below this clear bearish pattern:
170
135
104
You may find more details in the chart!
Thank you and Good Luck!
❤️PS: Please support with a like or comment if you find this analysis useful for your trading day❤️

SOL-USDT
The two-hour timeframe has reacted to the 144 resistance. It has had good growth since yesterday 🔼✔️💲
I think, considering the RSI, this is a natural correction. In case of a correction, Solana's first support will be around $135 🔽🚨
If 144 is broken, I will update you 📣📊

SOLUSDT 12HSOLUSDT 12H
A double bottom pattern has formed at the end of the downtrend. If it can break the neckline, an entry can be taken on the pullback after confirmation.👌

SOLUSDT to $420 ? - harmonic butterfly/crab/deep crab
Extremely clean XABCD harmonic pattern spotted on solusdt. Please read the entire post for education, target entry and TP zones. I put a lot of research in it. Hope you enjoy the read. Not a financial advice, just for education purpose. :)
To summarize the post, the most likely harmonic completion is the BUTTERFLY/Crab into $350–$410 ( first TP).
Here’s why:
- Fits the macro Solana channel
- Fits Elliott Wave 5 target
- Fits the center of the yearly momentum projection
- Fits market cycle timing (BTC topping 2026 → ALTs explode late)
- Matches confluence on trendlines
- fear and greed factor - extreme fear ( usually expect a bounce)
- SOL historically performs deep harmonic extensions in cycles
--------------------------------------------------------------
DETAILS:
----------------------------------------------------------------
ENTRY ZONE (now to $118)
BEST entries are:
✔ $142 – $132 (current accumulation)
✔ $128 – $118 (golden entry zone) → this is ideal
✔ $110 – $100 (max fear entry if BTC dips)
Why these?
Because they form the C-to-D inflection, where harmonics begin their strongest rallies.
🟢 TAKE PROFIT LADDER (precision)
🎯 TP1 – $348–$417
Scale out 20–25%
(Butterfly/Crab PRZ + first alt rally)
🎯 TP2 – $540–$615
Scale out 40–50%
(The primary Deep Crab completion)
🎯 TP3 – $720–$820
Scale out 25–40%
(Extended mania phase)
🔻 STOP LOSS & INVALIDATION
You need two levels, not one.
🔻 Soft SL (Pattern Risk)
$110
If broken, pattern might retest deeper liquidity, but still intact.
🔻 Hard SL (Harmonic Invalidation)
$95 – $90
A weekly close below $95 breaks:
- XA structure
- Trend geometry
- Harmonic ratios
- Crab + Butterfly tolerance
________________________________________________________________
Here are details of the HARMONIC PATTERN AND MY NOTES....
_______________________________________________________________
X → A → B → C → D progression is valid:
X = $294
A = $95
B = $255–268 zone
C = $122
D (Projected) = $300–$400 zone depending on harmonic type
Key points:
XA retracement at B ≈ 0.786 – 0.88 zone
This is what defines the pattern:
If B is ~ 0.886 → Deep Crab / Butterfly
B is around 0.788–0.92 area, so this makes it: A DEEP HARMONIC PATTERN → most likely a Butterfly or Deep Crab
(depending on how far D will extend)
Final D target depends on which pattern completes first
IF Butterfly →
⭕ D = $348–$416
IF Crab →
⭕ D = $540–$630 >>> my target zone.
If Extended crab... $750–$830
Most Probable Outcome (based on structure)
The most likely harmonic completion is the BUTTERFLY/Crab into $350–$410.
Here’s why:
- Fits the macro Solana channel
- Fits Elliott Wave 5 target
- Fits the center of the yearly momentum projection
- Fits market cycle timing (BTC topping 2026 → ALTs explode late)
- Matches confluence on trendlines
- fear and greed factor - extreme fear ( usually expect a bounce)
- SOL historically performs deep harmonic extensions in cycles
For your education... MOST COMMON PATTERN RULES
1. Gartley Pattern
🔸 B = 61.8% of XA
🔸 D = 78.6% retracement of XA
🔸 BC = 1.27 or 1.618 extension
2. Bat Pattern
🔸 B = 38.2–50% of XA
🔸 D = 88.6% retracement of XA
🔸 BC = 1.618–2.618 extension
3. Crab Pattern
🔸 B = 38.2–61.8% of XA
🔸 D = 161.8% extension of XA
🔸 BC = 2.618–3.618 extension
4. Butterfly Pattern
🔸 B = 78.6% of XA
🔸 D = 127.2–161.8% extension of XA

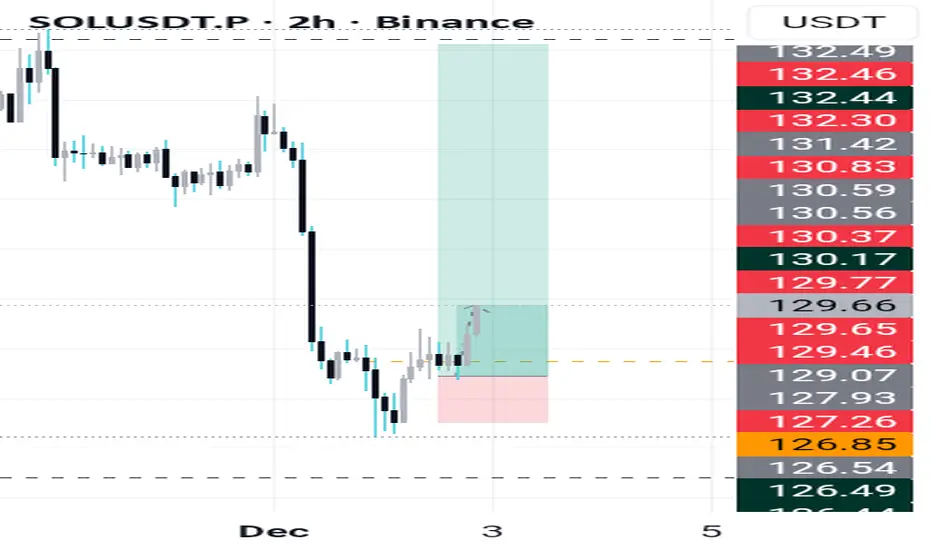
Sol dropping ?Im in a small short
Might book partial at the white zone but expecting it to break and drop move
I will move to breakeven if it comes to white zone and let the setup play

Lingrid | SOLUSDT Initial Major Resistance Zone After Price DropBINANCE:SOLUSDT is climbing toward the 150–155 resistance cluster, where the downward channel’s trendline, horizontal supply, and the local upward trendline all converge. Despite the recent bounce, the broader structure remains bearish, with multiple lower highs and no confirmed reversal—suggesting the move up is more corrective than structural. The compression seen before the breakout and the sharp recovery both reflect liquidity-driven retracements rather than a trend change.
If price stalls at this confluence zone, sellers may regain control and drive the market back toward 133, followed by the deeper support pocket, which aligns with the mid-channel and the established buying area. Until CRYPTOCAP:SOL breaks and sustains above the channel, bullish continuation remains unconfirmed.
➡️ Primary scenario: rejection from 150–155 → continuation toward 133.
⚠️ Risk scenario: a clean break and close above 155 invalidates the short thesis.
If this idea resonates with you or you have your own opinion, traders, hit the comments. I’m excited to read your thoughts!

$SOL/USDT ANALYSISOn the **1-day chart**, BINANCE:SOLUSDT is currently rebounding strongly from a well-defined horizontal support zone around **$131–$137**, which has acted as a major demand area multiple times in the past. Buyers stepped in again from this zone with rising volume, showing accumulation interest after an extended downtrend. The price has now pushed back above the short-term daily lows and is testing the descending trendline drawn from the November swing highs, indicating that the market is trying to shift momentum.
The candlesticks are forming higher lows while rejecting deeper downside, suggesting short-term strength. However, the overall structure still remains under the broader bearish trendline and below the daily Ichimoku cloud, so this recovery phase will only confirm a reversal if SOL manages a **daily close above $150–$155**, which would break the trendline resistance and open room toward $170 and $190. If the price fails to close above the trendline and faces rejection near $145–$150, it may retest the $135–$131 support zone again.
In short, SOL is currently in a **corrective bullish bounce within a larger downtrend**, holding key support and attempting to break structure. A sustained breakout and close above $150 will mark a possible shift to medium-term bullish momentum, while failure to do so keeps it in a consolidating range between $131 and $150.

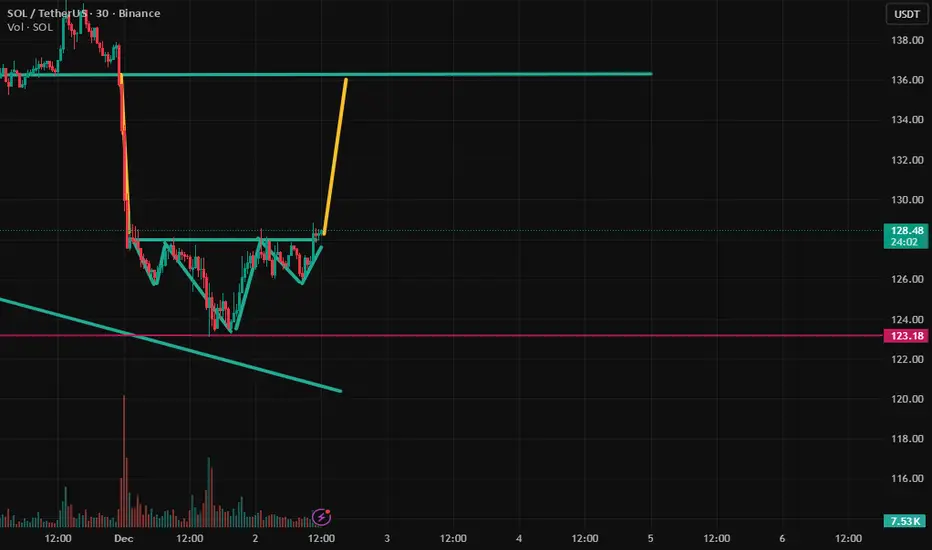
FireHoseReel | All Eyes on Solana at This Critical Level🔥 Welcome to FireHoseReel!
Let’s jump into the Solana (SOL) market structure.
👀 SOL – 4H Overview
After breaking its descending curve structure, SOL faced strong resistance at $144 but failed to break it, leading to a sharp rejection.
Price then formed a double bottom and pushed back toward the same resistance. SOL is now trading near this critical zone once again.
📊 Volume Analysis
Volume increased significantly during the formation of the double bottom, driving a sharp move back toward resistance.
If buy volume remains sustained, the probability of a breakout above $144 increases.
✍️ SOL Trading Scenarios
You can use the following scenarios alongside your own trading strategy:
🟢 Long Scenario (Breakout Setup)
A confirmed breakout above $144, supported by a strong increase in buy volume, could provide a solid long opportunity on SOL.
🟢 Long Scenario (Aggressive Risk Setup)
Wait for price to consolidate, then enter during the pullback with decreasing volume, followed by the first signs of renewed buying pressure.
This setup allows for a tighter stop-loss and faster R:R, suitable for higher-risk traders.
🔴 Short Scenario
A loss of the key support at $124, accompanied by strong sell pressure, could activate a valid short setup for SOL.
❤️ Risk Management & Emotional Discipline
Crypto trading is highly risky. Without proper risk management and emotional control, trading is no different from gambling.
Logic must always come before emotions. Learn to manage your trades, and enjoy the process of trading with control and discipline.

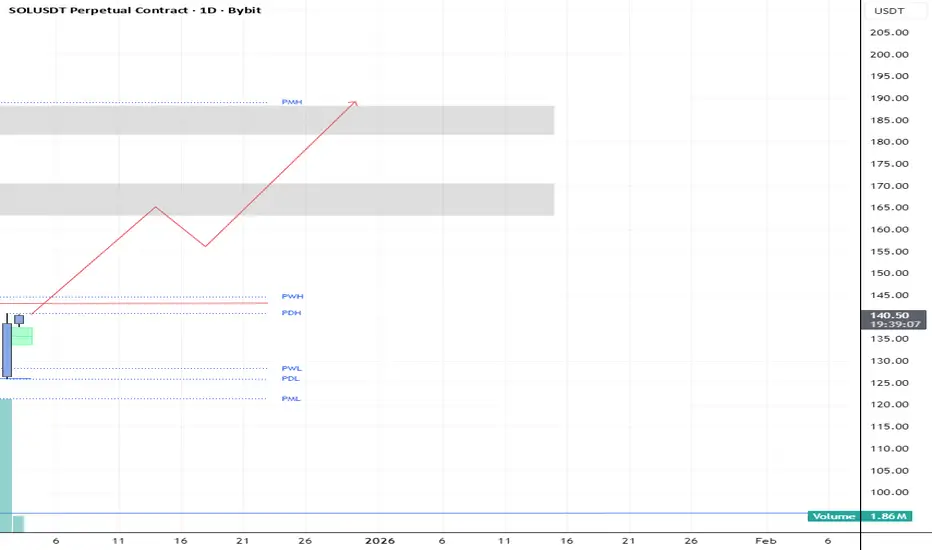
SOLUSDT-1D Bullish Outlook/RiskyChartechnical Overview:
Timeframe: 1 Day
Pair: SOL/USDT
Bias: Bullish (Reversal / Expansion Phase)
Context:
Price swept the previous weekly low (PWL) and daily low (PDL) liquidity before showing a strong bullish rejection candle from the discount zone.
The reaction suggests accumulation and potential for a bullish expansion phase targeting premium liquidity levels.
Structure Breakdown:
Liquidity Sweep: Price cleared downside liquidity below 130–135 zone before rebounding sharply.
BOS: A break of short-term structure to the upside signals shift in order flow.
Imbalance Zone: Small FVG (green box) is being mitigated, confirming strength from buyers.
Target Zones:
PDH / PWH: Near 150–155 USDT – short-term liquidity targets.
PWH / PMH: Around 175–185 USDT – long-term bullish objective.
Invalidation: Daily close below 128–130 would invalidate the bullish outlook.
SOL Up to 190 then down to 150Technical analysis. This is what it's all about man. Forecasting price.
So, I predict it's going to $190 because that's where my stop is, as I just entered short for no good reason in this sideways choppy market. Now price is guaranteed to hit my stop loss before actually making a huge move in my initial direction.
If I get stopped out, I'll lose $1000.
But I dont know, I haven't looked at metal commodities in the last few days, but those were coming down recently, so maybe people will start selling these kind of risky gold/crypto assets.
I'd also be curious about a possible gold-btc rotation thing. Has anyone looked into that? Let me know.

SOLI have been telling you for a while to buy CRYPTOCAP:SOL at these levels and I am telling you again. This is major support. Yes, it could break down, but doing so would destroy a very clean structure that I do not think the market or the market makers will allow. This is a strong entry zone.

Complementary Head and Shoulders PatternIt looks like the price could complete the Head and Shoulders pattern and move higher.
Solana - Bullish Divergence Solana is showing bullish divergence on the daily chart. A clear signal that a reversal is imminent. A number of other major crypto are showing the same signal. I now look for confirmation of a reversal via a trend line break. Wedge break, volume or bullish pattern on lower timeframe.

SOL-USDTI updated the support box and the range 🕯
Solana is currently between a support box and a range, with prices between $123 and $128, which is an extremely important support, and the RSI is also in oversold territory 💰💲
If this support holds and the top of the box, meaning $128, is broken 📣
The first rise would be towards $135 🔼🚨


Market Technical Break Down For 1st to 5th December SessionGet ready to uncover mind-blowing trading secrets in this technical analysis video! From Forex forecast to Bitcoin trading, we've got you covered. Discover the latest trends and insights in the world of trading.
This secret is revealed in this video clip in straightforward terms and you can do it just by following the instructions in the video.
VISIT OUR LINK TREE on our profile: /tonyfx

DeGRAM | SOLUSD will test the strength of the $150 resistance📊 Technical Analysis
● SOL/USD remains inside a broad descending structure with repeated rejections from the dynamic resistance line, preserving bearish dominance.
● Price is approaching the $150 zone, where previous flag and consolidation tops failed, making a reversal toward the $135–$130 support area highly probable.
💡 Fundamental Analysis
● Market rotation out of high-beta altcoins continues as investors reduce exposure amid rising volatility, limiting SOL’s upside potential.
✨ Summary
● Bearish bias below $150. Targets: $135 → $130. Resistance: $150.
-------------------
Share your opinion in the comments and support the idea with a like. Thanks for your support!
