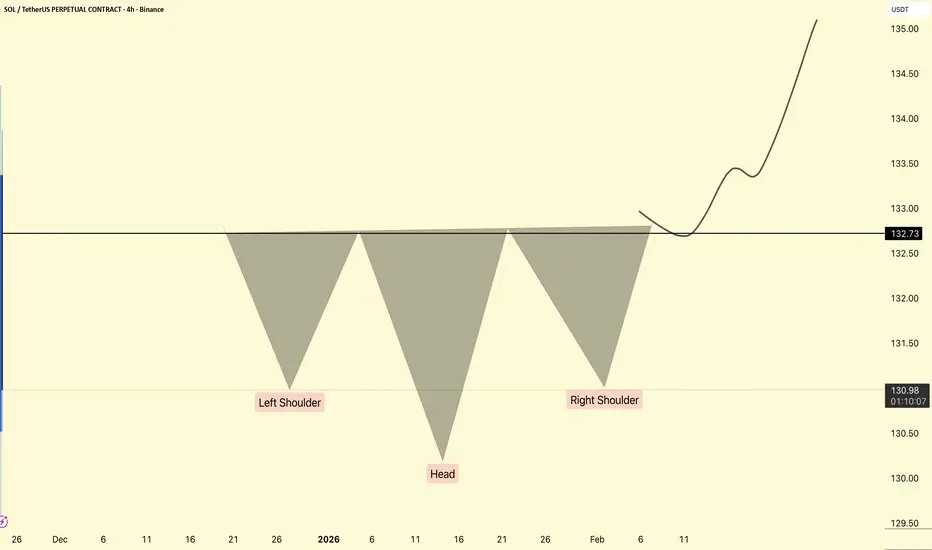
Inverse Head and Shoulders PatternThe inverse head and shoulders pattern is a technical analysis tool used to signal a potential trend reversal from a downtrend to an uptrend.
The inverse head and shoulders pattern is characterized by three consecutive troughs, with the middle trough (head) being the lowest and the two outer troughs (shoulders) being higher and nearly equal. This formation indicates that the downtrend is nearing its end, and a reversal to an uptrend may occur soon. Identifying this pattern can provide traders with a valuable signal to enter a new long position or exit a bearish trade, making it an essential part of technical analysis.
The inverse head and shoulders pattern is the opposite of the head and shoulders pattern. Technical traders widely follow both formations due to their distinct shapes and clear signals as trend reversal patterns.
Market insights
Solana is forming a bullish flagSOL has formed a bullish flag, with movement in a local uptrend being established. The high in the purple areas is highly likely to be broken
Two 4H imbalances are located above. This is where sellers are most likely to react

My plan to next mov of SOLMy outlook for SOL’s next move is that it will bounce hard, but heavy selling will likely come in during that move. In other words, a sudden sell-off might hit in the middle of the upward move; something that may look like a normal correction at first but turns out deeper than expected. After that, the price might climb a bit again, but we should wait and stay cautious until things become clearer.

SOLUSDT: Liquidity Tightens – Every Pullback Drops Even Deeper!When talking about Solana right now, the clearest feeling is that the market is losing strength day by day . Recent news shows that SOL has dropped sharply in November, and large capital keeps exiting the market — turning every bounce into an excuse for holders to sell rather than a sign of reversal.
On the H4 chart, SOL is trapped inside a descending wedge , repeatedly rejected by the Ichimoku cloud — an area that has consistently blocked every recovery attempt. Each previous bounce has only led to an even stronger downward leg.
The $130 level is the nearest immediate resistance and also aligns with the descending trendline. If price pulls back to this zone, there is a high probability of fresh selling pressure emerging. When that happens, SOL could continue dropping toward the psychological support at $100 — the key target in the current bearish outlook.
In summary, with both negative news and a weak technical structure, the most reasonable strategy now is to follow the downtrend , wait for price to pull back into resistance to find cleaner entries, and avoid catching bottoms when the market shows no clear reversal signals.

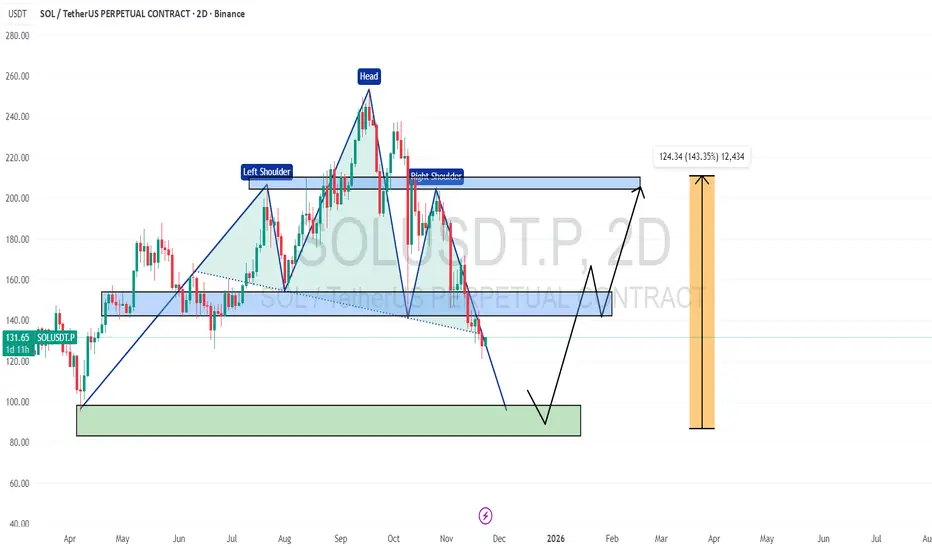
SOL USDT 2D CHART UPDATE 📌 CRYPTOCAP:SOL 2D Chart shows a head & shoulder pattern✅
📌 If this continues, the price may continue to decline ✅
📌 However, a bullish reversal is expected from the support zone below ✅
If this happens, the price may go back to the $150, $200+ range 🔥🚀
Head and Shoulders forming for SOLHead and Shoulders forming for SOL
Possible bounce from here to 195$

SOL-USDT🔤🔤🔤
Solana is in a downtrend channel 💰💰
which has shown a good reaction at the channel's bottom.
Two important support levels for Solana are the $127 range and then $121 🔽📊
On the other hand, the first resistance is the top of this channel at $137, and if this is broken, the next target will be $143 📣🔼

#SOLUSDT – Harmonic C-Leg Hit | Bullish Expansion Zone
SOL has finally tapped the 0.844–0.886 retracement, completing the harmonic C-leg exactly as projected in the previous analysis.
This zone acts as a strong structural support, and holding above it keeps the bullish scenario intact.
🔹 Targets
• $230–$260
• $345 (Harmonic D)
• $410+ (Major Resistance Zone)
🔹 Invalidation
Weekly close below $100.
✨ Clean reaction. Harmonic structure still valid.

SOL USDT SHORT SIGNAL---
📢 Official Trade Signal – SOL/USDT
📉 Position Type: SHORT
💰 Entry Price: 127.28
---
🎯 Take-Profit Targets (Partial Exits)
TP1 = 121.53
TP2 = 116.85
TP3 = 111.66
TP4 = 106.28
TP5 = —
TP6 = —
---
🛑 Stop-Loss: 131.00
📊 Timeframe: —
⚖️ Risk/Reward Ratio: 5.79
💥 Suggested Leverage: 5× – 10×
---
🧠 Technical Analysis Summary
SOL has entered a strong supply zone around 127–129, showing clear signs of weakness and rejection.
Bearish wicks on lower timeframes indicate exhaustion of buyers and a likely downward retracement toward liquidity zones below.
TP levels align with major support levels and liquidity pockets from previous structure breaks.
Momentum indicators are showing bearish divergence, supporting a short setup.
---
⚙️ Trade Management Rules
Take partial profit at TP1
Move Stop-Loss to Break-Even once TP1 is hit
Trail SL gradually as price approaches deeper targets
Avoid re-entry if price hits SL at 131
---
⚠️ Important Risk-Management Note
✔️ When TP1 is hit, the Stop-Loss is moved to the Entry Price (Break-Even).
This is a standard professional risk-management rule.
❗ If the price hits TP1 and later reverses to break-even, this is NOT a loss.
It simply means the trade closed with zero risk after securing progress.
🔐 Our priority is always capital protection before big profits.
---
📌 TradingView Hashtags
#SOLUSDT #SOL #TradingView #CryptoSignal #ShortSetup #TechnicalAnalysis #FuturesTrading #Altcoins
---

The SOL Fractal That Called the April Bottom Is BackSOL – 63-Day Fractal Breakdown, Macro Liquidity Compression, and a Projected Structural Low at 109 (Dec 8)
Advanced Technical Analysis • Liquidity Cycle Modeling • HTF Structural Projection
This analysis examines Solana’s repeating 63-day distribution and decline cycle, visible across all major swing tops in 2024–2025. The current cycle aligns with the time and structural rhythm of the March–April decline, despite originating from different catalyst categories. A deeper extension is now projected, with a structurally valid new low at 109 around December 8, based on cycle symmetry and volume profile displacement.
1. Macro Structure: 63-Day M-Top → 63-Day Decline → Liquidity Exhaustion
Solana has produced three consecutive cycles with nearly identical structural components:
1. Distribution Phase (63 days)
A pronounced M-top forms with weakening momentum, lower-timeframe volatility expansion, and diminishing trend strength. Across all three cycles, this distribution top lasted approximately 63 days before breakdown.
2. Decline Phase (63 days)
Following the M-top, each cycle transitions into a multi-week decline of similar duration:
Lower highs on weekly structure
Gradual liquidity withdrawal
Volume profile thinning
Mean reversion into prior accumulation regions
These two phases together form a repeating HTF liquidity cycle, not random noise.
Cycles:
Dec 2024 → Mar/Apr 2025
May 2025 → Jul/Aug 2025
Sept 2025 → Current decline (ending projected Dec 2025)
The timing and structure of the current decline match the earlier two cycles.
2. Catalyst Comparison: Different Causes, Same Liquidity Behavior
Even though the bearish catalysts differ, the market reaction is identical.
March/April Decline (Internal SOL Catalysts)
Large exploit events
Validation congestion
Finality delays
On-chain liquidations
Current Decline (Macro-Driven Catalysts)
Inflation uncertainty
Government shutdown risk
Liquidity compression across risk assets
Declining altcoin participation
Buyer hesitation despite strong fundamentals
In both cases, liquidity exits the market at the same rate and in the same structural pattern. Price responds to liquidity, not narrative, validating the use of Fractal Structure Analysis.
3. Revised Support Projection: Structural Low at 109 by December 8
While previous cycles bottomed at 128–132, the current cycle shows:
Deeper volume displacement
Increased macro drag
Long-wicked bearish weekly closes
A more aggressive liquidity unwind
A declining mid-range reclaim rate
These factors support an extended deviation beneath the standard fractal floor.
**Projected Bottom: 109 ± 2
Projected Date: December 8**
This 109 target aligns with:
HTF liquidity sweep logic
The lower boundary of the volume imbalance left from the prior bullish expansion
Completion of the 63-day decline window
Equal-range extension from the M-top measured move
The long-term ascending trendline from the November 2023 breakout
This deeper retracement does not break the bullish macro structure—it simply represents a more aggressive liquidity purge due to macro pressure rather than internal network issues.
4. Forward Outlook: Accumulation (Dec) → Reversal (Jan) → Trend Expansion (Feb)
If Solana completes the projected liquidation down to the 109 level:
December
HTF accumulation
Seller exhaustion
Low-volatility compression
Volume profile stabilization
January
First structural higher low
Demand reentry
Reclaim attempts toward the 150–155 micro-structure band
February
Break in HTF market structure
Trend continuation
Full momentum expansion targeting prior resistance levels
Upside targets once the reversal begins:
240 (HTF breaker and mid-range)
280 (HTF supply region)
300+ (cycle extension if macro improves)
This trajectory mirrors the post-April recovery phase, with a shifted timeline due to extended macro drag.
5. Invalidation Criteria
The bullish fractal thesis is invalid under the following conditions:
Sustained weekly close below 105
BTC losing key support with high-volume follow-through
Breakdown of the long-term ascending structure from Q4 2023
Failure to reclaim 150–155 during the January recovery attempt
A breakdown beneath these thresholds would indicate deviation from the multi-cycle rhythm.
6. Conclusion
Solana remains in a well-defined 63-day distribution and decline cycle, consistent across all major tops in 2024–2025. Liquidity behavior remains identical to prior cycles, even though catalyst categories differ.
The cycle now projects a deeper structural low at 109 around December 8, driven by macroeconomic headwinds rather than Solana-specific issues.
A January–February recovery remains the highest-probability outcome, provided structural levels hold and macro conditions stabilize.

Solana and ab=cd Solana has been performing very well and has started to decline after reaching the price ceiling it had repeated. After breaking the dynamic trend line on the daily timeframe, it is currently in a bearish trend. The probability of completing the ab=cd pattern at the drawn support area is high.

SOLI do not think we will go lower then this, the support is huge and the setup is too clean. This is one of the best accumulation zones you will ever get.

SOL - Time for a pullback SOL - Time for a pullback
Before we take a new short we need a pullback and range
only after we can take a new short trade
Key resistance 171

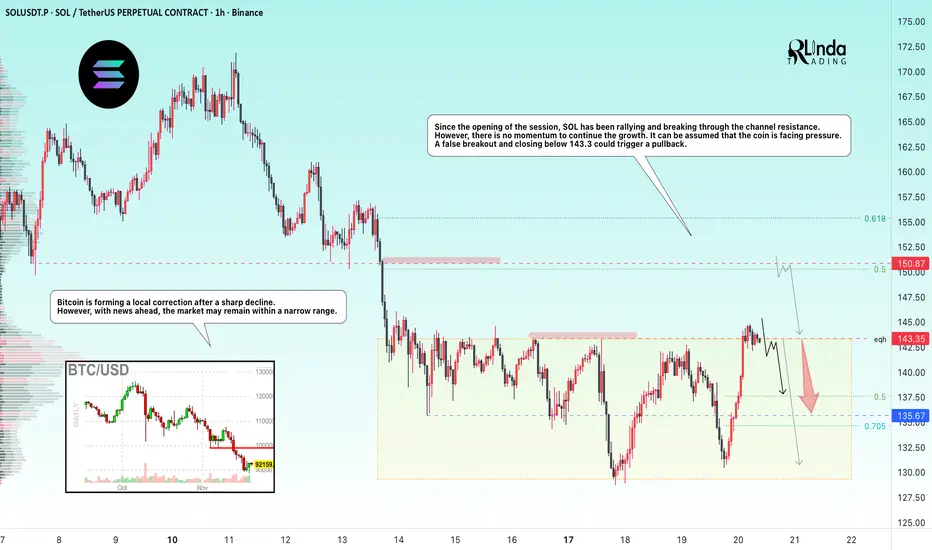
SOLANA → Manipulation - false breakout of resistance BINANCE:SOLUSDT.P flew up to resistance at 143.35 at the opening of the session and attempted to break through it, but bears may not let the price rise ahead of the news...
Bitcoin is forming a local correction after a sharp decline. However, news is ahead and the market may remain within a narrow range.
From the opening of the session, SOL rallies and breaks through the channel resistance, wasting 75% of its intraday growth potential. However, there is no momentum to continue the growth. It can be assumed that the coin is facing pressure. A false breakout and closing below 143.3 could trigger a pullback.
Resistance levels: 143.35, 150.87
Support levels: 135.67, 130.0
Two key levels for countertrend movement: 143.35 - 150.87. If the liquidity pool does not stop the price at the nearest level, then 150.87 can be considered as an additional level for trading a false breakout.
However, news on unemployment is coming soon, and the market may react quite aggressively. Therefore, if there are no trading opportunities before the news, I recommend refraining from action for an hour and waiting out the storm...
Best regards, R. Linda!
Solana monthly head and shoulders pattern Solana is showing a clear head and shoulders on the higher timeframe. A break of the neckline around $125 would see an eventual target of $60. This would represent a 50% reduction in price.

Final 2025 Forecast for SOLUSDT 21st November 2025 (Updated)1. Friday session dip to around ~$127
2. Pump to around ~$150 over the weekend and early next week
3. Final dump down to ~$113
4. Final pump to ~$230 to end the cycle
This idea does not indicate a massively new ATH but a topping out at the multi-cycle trend line from 2017.

SOLANA RETRACEMENT INCOMINGFollowing that impressive downward surge, a true force of momentum, we can reasonably anticipate a retracement upward to address those overlooked volume nodes left behind. Stay vigilant on the overall market structure; hold for a confirmed break, and cross-reference with the Cumulative Volume Delta (CVD) to time that short term pullback effectively. it's been a solid week so far, packed with solid setups, and the horizon promises even more to come.

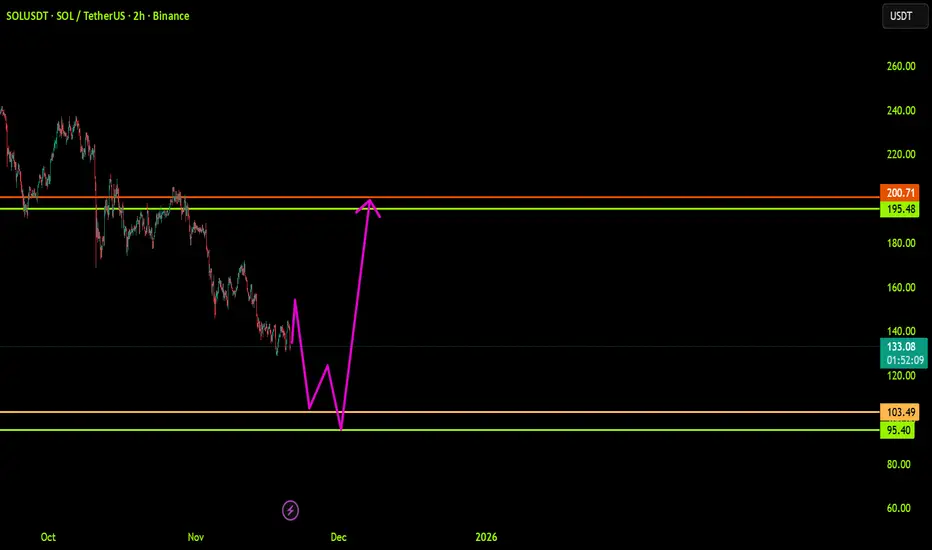
SOLUSDT: Trend in 2-H time frameThe color levels are very accurate levels of support and resistance in different time frames.
A strong move requires a correction to major support and we have to wait for their reaction in these areas.
So, Please pay special attention to the accurate trends, colored levels, and you must know that SETUP is very sensitive.
BEST,
MT
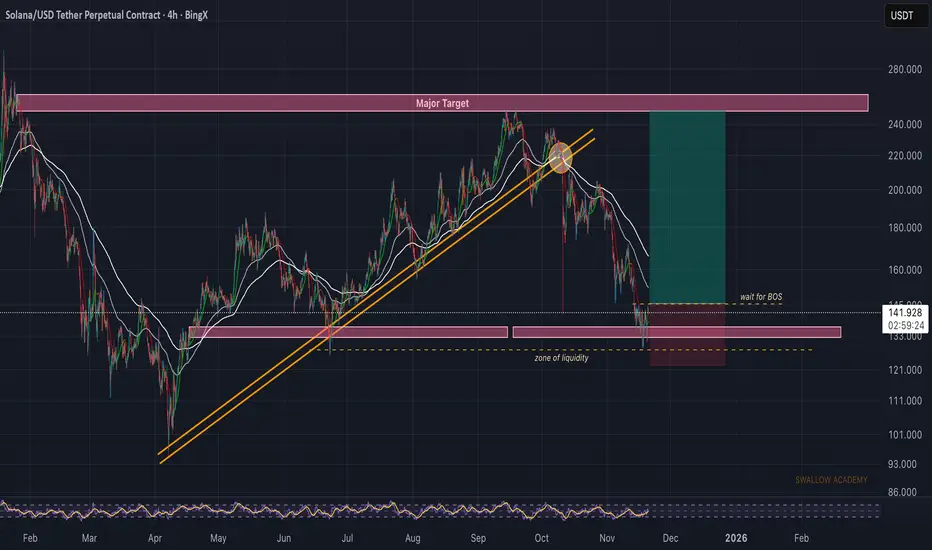
Solana (SOL): Looking For Proper Break of StructureSOL had a decent bounce from a liquidity zone, where buyers showed some reaction. For now we’re waiting for a clean BOS to confirm that buyers are actually stepping back in to fully overtake this area.
If we get that BOS, the plan is simple—look for a retrace entry and aim for the major target above (and maybe the EMAs as well before the major target).
Swallow Academy
SOL USDT LONG SIGNALSir📢 Signal
🔹 Currency pair:SOL.USDT
📉 Trade type:long
💰 Entry point:. Market
🎯 Targets (with withdrawal management):
▫️ TP1=145.60
▫️ TP2=150.20
▫️ TP3 =155.70
TP4=
TP5=
TP6=
🛑 Stop loss= 137.90
📊 Time frame:
⚖️ R/R:3.62
📌 Recommended leverage:.5 or 10
⚠️ Money management is required
Please log in after checking the chart

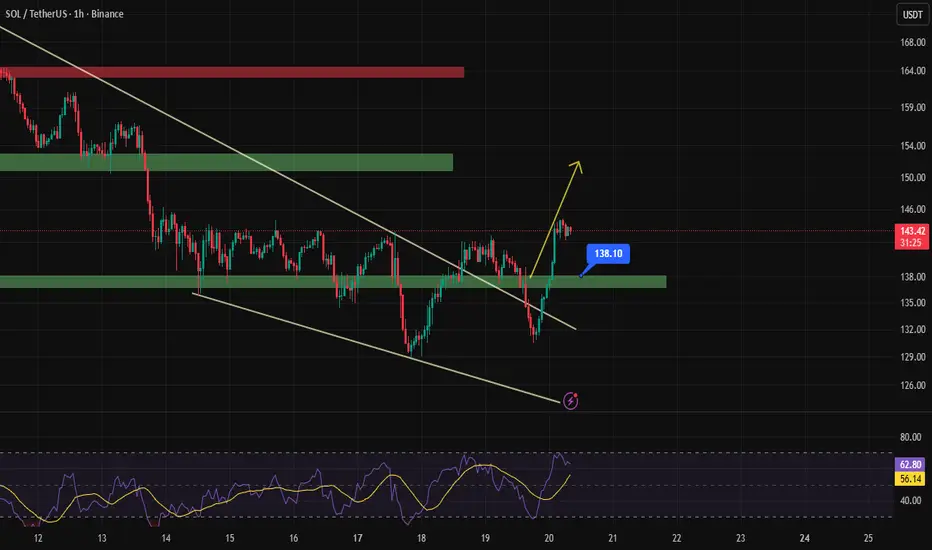
SOL-USDTIt was really tough 💰💰
But well, half of the path I was waiting for has gone up so far 📊
Today there's a resistance around 145 to 146 dollars, and if it breaks this, it could rise up to 154 🔼
The short-term support for Solana is at 138 dollars 🚀
SOLANA, November 15 Two Possible Correction Scenarios — One Outcome
In my view, Solana is currently forming a corrective structure.
At this moment, there are two scenarios:
🟧 Orange Scenario
The ABC corrective pattern has likely just completed, and Solana may follow the orange arrow toward 126 and potentially even lower.
🟪 Purple Scenario
The current flat ABC structure may actually represent wave A of a larger ABC correction — similar to what happened in Bitcoin right before its recent drop (see my recent BTC post where I expected 94K).
If this scenario plays out, Solana could first rise toward 144–146, and only then move down to 126.
I previously mentioned that I was waiting for Solana at 136 — and we’ve already seen that level.
I also expect 124, and possibly even lower.
But for now, I keep my short-term target at 126.
My global target is 112, but first, let’s see how exactly Solana approaches 126 — this will help confirm whether it truly intends to move below that level.
Let’s see which path Solana prefers — personally, I’m leaning toward the orange one.
⚠️Disclaimer: This is not financial advice or a call to action — only my personal vision.
🚀If you don’t want to miss updates, feel free to follow, leave reactions, or drop a comment.
Your support truly motivates me to continue posting regular Solana updates.

DeGRAM | SOLUSD held the $130 support level📊 Technical Analysis
● SOL/USD has created a false break below the dynamic support line while defending the 135–145 demand zone, signaling seller exhaustion.
● Price is stabilizing inside a descending channel; a rebound toward 160 is likely if buyers push above the short-term triangle breakout area.
💡 Fundamental Analysis
● Solana sentiment improves as ecosystem inflows rise and on-chain activity stabilizes, supporting recovery potential.
✨ Summary
Support: 135–145. Targets: 155 → 160. Medium-term bullish bias above demand zone.
-------------------
Share your opinion in the comments and support the idea with a like. Thanks for your support!
