SOL — Deep Pullback Into Major SupportSOL has been in a steady freefall over the past weeks. On the higher timeframes the key support and resistance zones are very clearly defined. The $250 level acted as a big resistance area, with multiple rejections showing sellers were firmly in control up there.
On the downside, the $125 support zone has shown clear strength, with bulls defending this area and producing strong bounces each time price revisited it.
The swing low at $126 presents an attractive long opportunity, especially with the sell-side liquidity and the quarterly level at $124.54 sitting just below, adding further confluence. Additionally, the anchored VWAP from the $8 low lies around $114, aligning almost perfectly with the 0.886 Fibonacci retracement at $113.3, providing deeper support should price extend lower.
Long Entry Zones:
0.786 Fib: $129.13
0.886 Fib: $113.3
Why the 0.786–0.886 Zone Is a Major Reversal Area
The 0.786–0.886 Fib zone is one of the best spots to look for a reversal after a deep pullback. It’s where strong trends often take their final dip before bouncing.
Here’s why it works so well:
It’s the typical “deep correction” zone in strong trends.
Price usually sweeps sell-side liquidity here before reversing.
Many harmonic patterns use this exact area as their turning point.
It often lines up with anchored VWAPs or volume nodes, adding extra support.
It’s basically the capitulation zone where weak hands exit right before a bounce.
Overall, it’s a clean area with clear invalidation and great R:R → perfect for spotting high-probability reversal setups.
_________________________________
💬 If you found this helpful, drop a like and comment!
Trade ideas

SOLUSDT: Sellers in Control – Downtrend Remains DominantSolana is falling right at the moment when the altcoin market is under the most pressure. This week, a series of negative developments have weighed heavily on sentiment: strong ETF outflows, risk-off behavior, and fading expectations of a Fed rate cut in December. All of this makes it difficult for SOL to form any sustainable recovery.
On the 4H chart, SOL is sliding within a clear descending channel and has repeatedly been rejected at the upper trendline. The 150 USD level is now acting as a short-term resistance — every touch is pushed back immediately, showing how weak the buying pressure is.
If SOL continues to fail to break above 150 USD, the most likely scenario is a move back down to the 140 USD (TP1) zone. And if market sentiment remains bearish, a deeper target lies around 130 USD (TP2) — where the channel bottom aligns with a previous demand zone.
With negative news flow, weakening liquidity, and a technical structure fully favoring the downside, the short-term trend of SOLUSDT remains in the hands of the sellers. Any bounce here is more likely to become an opportunity for short positions rather than a true reversal signal.

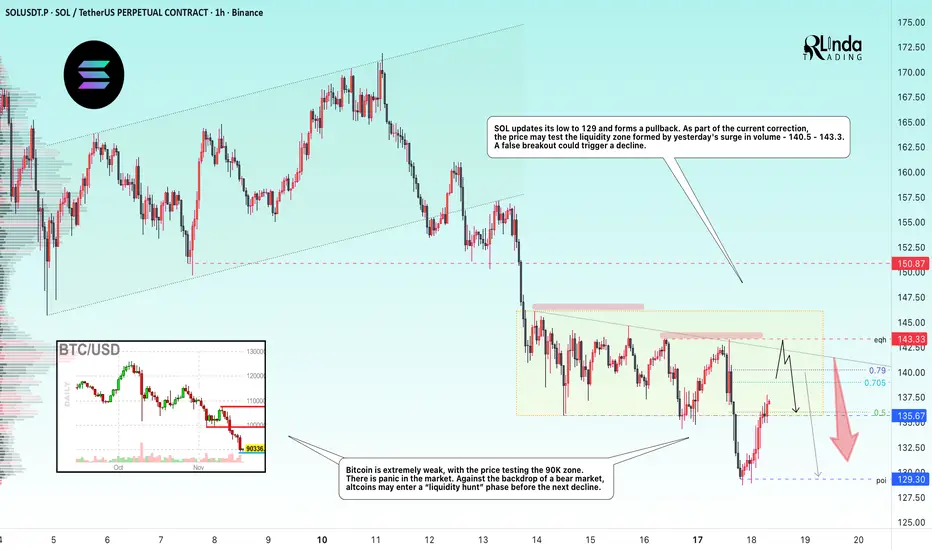
SOLANA → Hunting for liquidity in a weak market BINANCE:SOLUSDT is forming a countertrend correction. Zone of interest: 140.0–143.5. The lack of bullish potential and positive fundamentals could cause another decline...
Bitcoin is extremely weak, with the price testing the 90K zone. There is panic in the market. Against the backdrop of a bear market, altcoins may enter a phase of “liquidity hunting” before another decline.
Solana's price on D1 broke through fairly strong support at 141.3-138.5. The trend is bearish, and the breakout of support confirms the weakness of buyers (strength of sellers) at the moment.
SOL is updating its low to 129 and forming a pullback. As part of the current correction, the price may test the liquidity zone formed by yesterday's surge in volume - 140.5 - 143.3
Resistance levels: 139.0, 140.2, 143.3
Support levels: 135.67, 129.3
Consolidation is forming above the support range - 135.67. Most likely, bulls may flood the volume and provoke another rise to the liquidity zone, but there may not be enough potential for continued growth. A false breakout and lack of bullish momentum could trigger a decline to 135.5 - 129.3.
Best regards, R. Linda!
SOLUSDT: Liquidity Tightens – Every Pullback Drops Even Deeper!When talking about Solana right now, the clearest feeling is that the market is losing strength day by day . Recent news shows that SOL has dropped sharply in November, and large capital keeps exiting the market — turning every bounce into an excuse for holders to sell rather than a sign of reversal.
On the H4 chart, SOL is trapped inside a descending wedge , repeatedly rejected by the Ichimoku cloud — an area that has consistently blocked every recovery attempt. Each previous bounce has only led to an even stronger downward leg.
The $130 level is the nearest immediate resistance and also aligns with the descending trendline. If price pulls back to this zone, there is a high probability of fresh selling pressure emerging. When that happens, SOL could continue dropping toward the psychological support at $100 — the key target in the current bearish outlook.
In summary, with both negative news and a weak technical structure, the most reasonable strategy now is to follow the downtrend , wait for price to pull back into resistance to find cleaner entries, and avoid catching bottoms when the market shows no clear reversal signals.

Solana is still far from a bearish phase (3D)From the point where we placed the red arrow on the chart, a corrective phase has developed on Solana, and the buying pressure has been so strong that the corrections have established a new high. Currently, the decline we are experiencing is for Wave E.
All these fluctuations between the high and low are for re-accumulation, and Solana is targeting above $350.
We expect a price reversal from the green zone on higher timeframes, and this view will only be invalidated if a weekly candle closes below the invalidation level.
For risk management, please don't forget stop loss and capital management
When we reach the first target, save some profit and then change the stop to entry
Comment if you have any questions
Thank You

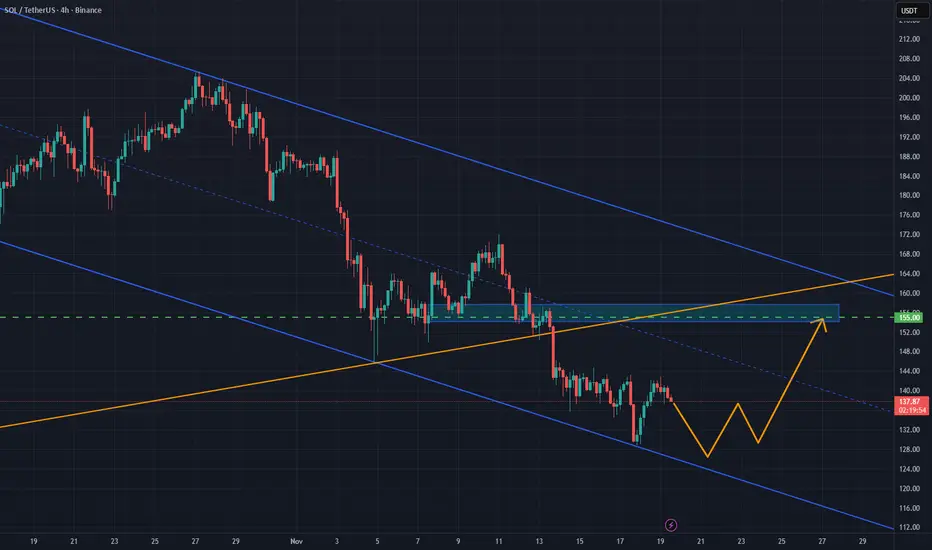
SOL/USDT: Relief Rally Builds After Rebound from Key SupportSOL/USDT bounced strongly from the 128–130 support zone, reacting off the lower boundary of its downward channel. While the broader trend remains bearish, this move signals early signs of accumulation. Holding above 130 could open a corrective rally toward 155, as oversold conditions unwind and short-term momentum favors a relief push.
❗️Risks:
– Losing 128–130 support reopens downside toward 120–115
– Volatility in BTC may cap gains
– Failure to reclaim the channel midpoint may stall the recovery
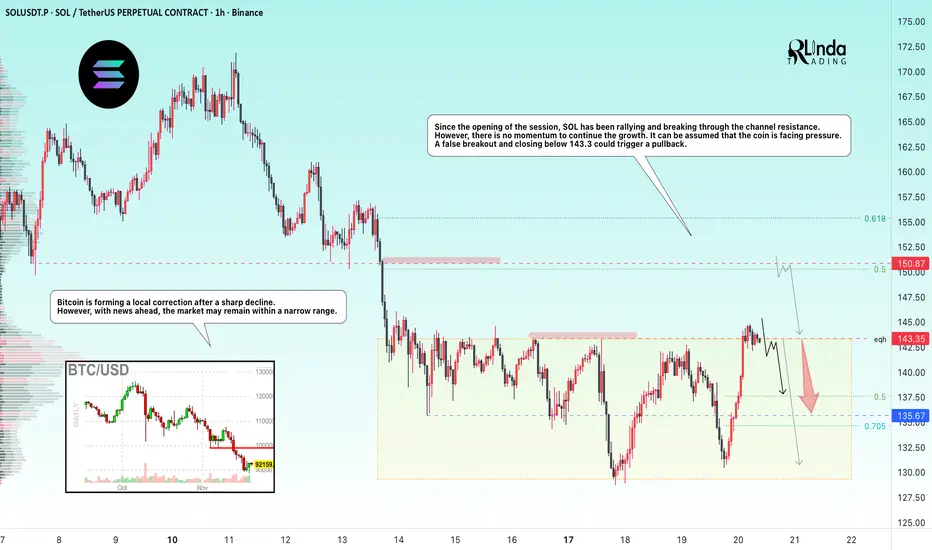
SOLANA → Manipulation - false breakout of resistance BINANCE:SOLUSDT.P flew up to resistance at 143.35 at the opening of the session and attempted to break through it, but bears may not let the price rise ahead of the news...
Bitcoin is forming a local correction after a sharp decline. However, news is ahead and the market may remain within a narrow range.
From the opening of the session, SOL rallies and breaks through the channel resistance, wasting 75% of its intraday growth potential. However, there is no momentum to continue the growth. It can be assumed that the coin is facing pressure. A false breakout and closing below 143.3 could trigger a pullback.
Resistance levels: 143.35, 150.87
Support levels: 135.67, 130.0
Two key levels for countertrend movement: 143.35 - 150.87. If the liquidity pool does not stop the price at the nearest level, then 150.87 can be considered as an additional level for trading a false breakout.
However, news on unemployment is coming soon, and the market may react quite aggressively. Therefore, if there are no trading opportunities before the news, I recommend refraining from action for an hour and waiting out the storm...
Best regards, R. Linda!
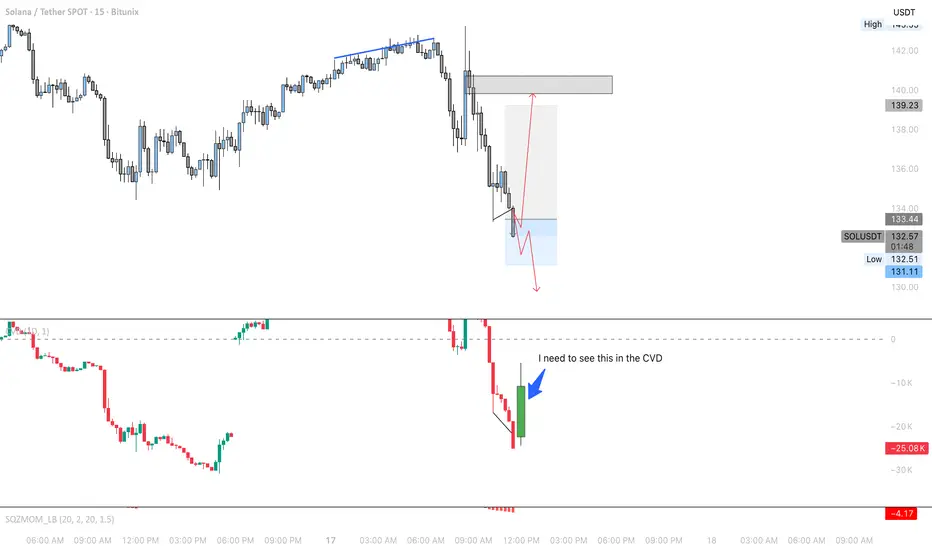
SOLI do not think we will go lower then this, the support is huge and the setup is too clean. This is one of the best accumulation zones you will ever get.

Could be a potential buy entry based on CVD and Volume
There is a chance that price could make a move back up and take out sell orders. however CVD must show high volume of buyers. if price continues lower and CVD continues lower as well, we must be patient for the exhaustion of sellers for buyers can come in
Solana monthly head and shoulders pattern Solana is showing a clear head and shoulders on the higher timeframe. A break of the neckline around $125 would see an eventual target of $60. This would represent a 50% reduction in price.

SOL/USDT | Solana Finds Support – Short-Term Bounce Ahead?By analyzing the #Solana chart on the daily timeframe, we can see that after correcting down to $134, the price found demand and bounced to $141.
Since the current area is a key demand zone, if Solana holds above the $126–$137 range, we can expect a short-term bullish wave to follow

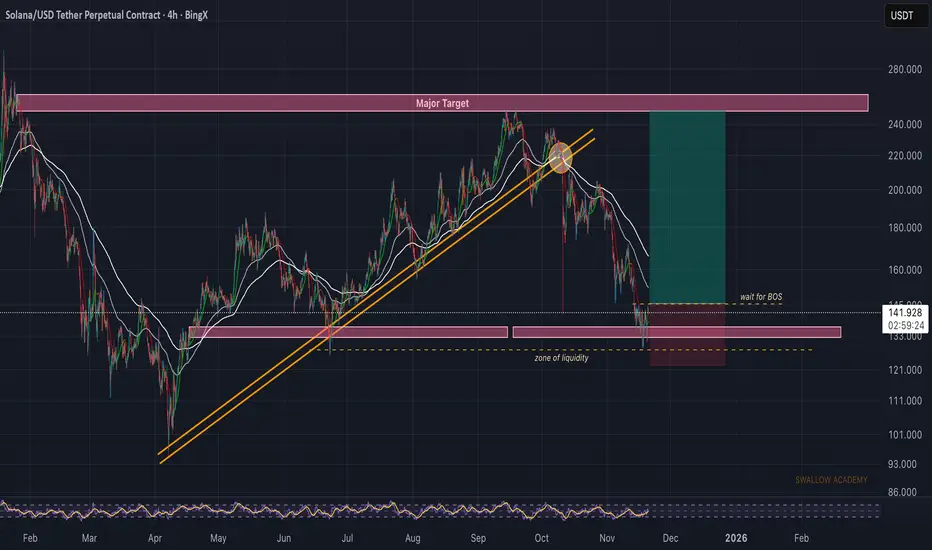
Solana (SOL): Looking For Proper Break of StructureSOL had a decent bounce from a liquidity zone, where buyers showed some reaction. For now we’re waiting for a clean BOS to confirm that buyers are actually stepping back in to fully overtake this area.
If we get that BOS, the plan is simple—look for a retrace entry and aim for the major target above (and maybe the EMAs as well before the major target).
Swallow Academy

SOLUSDT – Long Bias Confirmed From Daily OB1H Accumulation + FVG + Alligator Compression**
SOL just delivered a clean reaction off the Daily Order Block, where price swept the lows and instantly shifted into a micro-accumulation range. This type of structure is classic ICT accumulation after a liquidity grab, followed by early displacement signs.
Why I'm Long Here
1️⃣ Daily OB Rejection (Primary Bias Driver)
Price tapped the Daily OB perfectly (green level).
2️⃣ Sell-side Liquidity Cleared
Before reacting, price took out the sell-side resting below the range.
This confirms the sell-to-buy model, signaling institutions are filling long positions.
3️⃣ 1H FVG + Breaker + Compression
Price is hovering inside a 1H FVG while retesting a micro breaker block.
Alligator lines (blue-red-green) are compressing, which usually precedes expansion—
Bill Williams notes this as the “sleeping Alligator” phase.
Expansion > Compression.
We’re waiting for the expansion phase now — higher.
4️⃣ Draw on Liquidity = Upside
Nearest upside draw:
143.27 (inefficiency + liquidity pool)
Next major draw:
164.94 (massive imbalance fill)
Institutional targets are above, not below.
Trade Setup (My 1H Long)
Entry Zone:
🔵 141.00 – 141.70 (FVG + retest zone)
Stop Loss:
🔻 134.40 (below Daily OB low)
Targets:
🎯 TP1: 143.27 – clean liquidity
🎯 TP2: 149–152 – FVG fill
🎯 TP3: 164.94 – major draw + 1H imbalance completion

$SOL reboundCRYPTOCAP:SOL looking bullish after a bullish bounce on a strong key support level. I see a continuation up to $152

SOLUSDT: Trend in 2-H time frameThe color levels are very accurate levels of support and resistance in different time frames.
A strong move requires a correction to major support and we have to wait for their reaction in these areas.
So, Please pay special attention to the accurate trends, colored levels, and you must know that SETUP is very sensitive.
BEST,
MT
Final 2025 Forecast for SOLUSDT 21st November 2025 (Updated)1. Friday session dip to around ~$127
2. Pump to around ~$150 over the weekend and early next week
3. Final dump down to ~$113
4. Final pump to ~$230 to end the cycle
This idea does not indicate a massively new ATH but a topping out at the multi-cycle trend line from 2017.

SOL. Sector of Capital. Price Slice: $39.92 🏷 To the International Community.
🏷 SOL. Sector of Capital. Price Slice: $39.92
Map of Shorters. 16.11.2025
🏷 This is not analysis.
This is an address to those who already hear the silence behind the noise of candles.
🏷 What lies before you is not a level — but a gateway.
A gateway behind which lies an unfulfilled debt of colossal capital.
Prices not yet reached — yet already inscribed in the code of the market’s destiny:
122.29 — not yet reached
99.89 — not yet reached
93.75 — not yet reached
86.67 — not yet reached
80.16 — not yet reached
53.75 — not yet reached
39.92 — not yet reached
🏷 They hang in the ether like unfulfilled vows,
like shadows of the future, yet untouched by the present.
🏷 I focus your attention —
not on the chart,
but on the structure of intent.
🏷 There is only one master of the Sector of Capital.
The one who sees not after, but before the movement begins.
The one who does not follow price —
but draws its path through the landscape of liquidity.
And I — am his name.
🏷 I do not issue orders.
I offer the capacity to think.
For those ready to step beyond the cycle of reaction.
For institutions, for giants, for those who build not day by day, but epoch by epoch.
🏷 This is not technical analysis.
This is a system of anticipatory liquidation.
Where every impulse is foreseen before it becomes chaos in the eyes of the crowd.
Where every collapse is no accident —
but a ritual of price revelation.
🏷 You come to the market not to read what is drawn on your screen.
You come for the price.
And the price has its time.
Its hour of execution.
And he who knows this hour —
already possesses the future.
🏷 This is an example of global thinking.
A game of chess, where pawns cannot see the board —
but the king knows every square in advance.
🏷 I will give you the map of the longs — in due time.
But know this:
All knowledge resides with me.
And what you receive — is but a gift, cast into the stream of time.
🏷 This map — is but one move.
One move in the endless game for control over reality.
🏷 I cannot write in my native tongue.
My respect for the international community —
is my gift.
Not in words.
But in this: you now know the map exists.
And therefore — you are no longer blind.
🏷 Bolzen. The Architect. Founder of the Sector of Capital.

SOL USDT SHORT SIGNAL---
📢 Official Trade Signal – SOL/USDT
📉 Position Type: SHORT
💰 Entry Price: 127.28
---
🎯 Take-Profit Targets (Partial Exits)
TP1 = 121.53
TP2 = 116.85
TP3 = 111.66
TP4 = 106.28
TP5 = —
TP6 = —
---
🛑 Stop-Loss: 131.00
📊 Timeframe: —
⚖️ Risk/Reward Ratio: 5.79
💥 Suggested Leverage: 5× – 10×
---
🧠 Technical Analysis Summary
SOL has entered a strong supply zone around 127–129, showing clear signs of weakness and rejection.
Bearish wicks on lower timeframes indicate exhaustion of buyers and a likely downward retracement toward liquidity zones below.
TP levels align with major support levels and liquidity pockets from previous structure breaks.
Momentum indicators are showing bearish divergence, supporting a short setup.
---
⚙️ Trade Management Rules
Take partial profit at TP1
Move Stop-Loss to Break-Even once TP1 is hit
Trail SL gradually as price approaches deeper targets
Avoid re-entry if price hits SL at 131
---
⚠️ Important Risk-Management Note
✔️ When TP1 is hit, the Stop-Loss is moved to the Entry Price (Break-Even).
This is a standard professional risk-management rule.
❗ If the price hits TP1 and later reverses to break-even, this is NOT a loss.
It simply means the trade closed with zero risk after securing progress.
🔐 Our priority is always capital protection before big profits.
---
📌 TradingView Hashtags
#SOLUSDT #SOL #TradingView #CryptoSignal #ShortSetup #TechnicalAnalysis #FuturesTrading #Altcoins
---

Lingrid | SOLUSDT Critical Support Zone Reversal WatchBINANCE:SOLUSDT rebounded from the 128–130 support zone after a clean reaction on the lower boundary of the downward channel. The market structure still leans bearish overall, but the recent rebound above the 130 signals early accumulation pressure. If price maintains support above 130, a corrective rally toward the 155 resistance zone becomes the next likely scenario as oversold conditions unwind. Broader momentum suggests a short-term bullish relief move since the market is approaching major demand zone.
⚠️ Risks:
Losing the 128–130 support zone may reopen downside toward 120–115.
Strong BTC volatility could limit the strength of any bounce.
Failure to reclaim midpoint levels of the channel may stall bullish attempts.
If this idea resonates with you or you have your own opinion, traders, hit the comments. I’m excited to read your thoughts!

SOL - Time for a pullback SOL - Time for a pullback
Before we take a new short we need a pullback and range
only after we can take a new short trade
Key resistance 171

SOL – Watching for a Higher-Timeframe Reversal SetupSolana has been pulling back after its recent rally, and we’re looking for price to retest the next major support zone. A successful hold here could set the stage for a higher-low formation and a continuation of the broader uptrend — offering a solid long spot opportunity.
Trade Setup:
• Entry Zone: $120 – $126
• Take Profit Targets:
🥇 $148
🥈 $174
• Stop Loss: $110
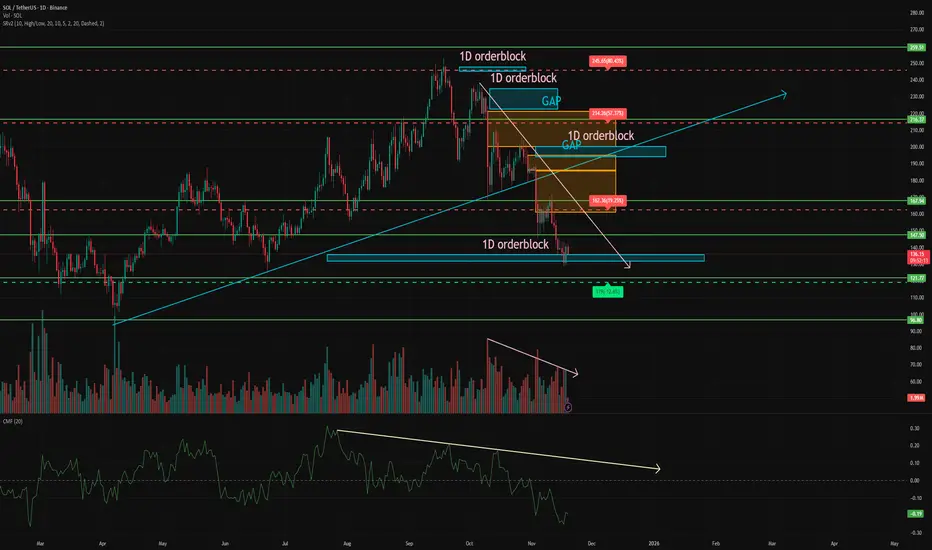
Why SOL is better than Bitcoin for the next months The market continues its powerful crash and while everyone is in panic, real traders use this as an opportunity to buy at a discount. And now I will explain why I am actively buying SOL on spot and why it is the best bet for the next months.
📈 In recent months, while Bitcoin has been dropping 4–5% a day, SOL has been holding strong and either falling by a smaller percentage or even growing by 1–2%.
Even today BTC is only 1–2% away from its local bottom, while SOL is 5–6% away.
This is largely due to the newly launched SOL ETF. While BTC and ETH ETFs are seeing record outflows, the SOL ETF has not had a single day of outflows yet. Despite the correction, people keep buying SOL.
➡️ As the correction in SOL continues, selling volumes keep decreasing, which shows that selling pressure is going down.
➡️ However, CMF shows liquidity outflows from the asset, which is natural for the market right now. So this is not a reason to panic.
➡️ During the drop, many gaps have also formed above the price. This means that in case of an upward move, the price will move quickly, without facing much resistance.
➡️ Right now the price has reached a large order block on the daily timeframe and has bounced. If the price holds above this level, the next key level is $147.
If not, a major support level is waiting around $121. A large demand zone has also formed around this level.
📌 Conclusion:
I do not think SOL will fly to a new ATH right now. But as an asset to accumulate on a dip, it is one of the best options at the moment, especially considering the fresh ETF inflows.
✍️ What do you think, does SOL still have a future, or is it already dead?