SOL/USDT – Daily OutlookAfter forming a potential harmonic structure, SOL seems to be following a corrective path from point B (0.789 Fib) toward a possible C leg around the 0.886 retracement zone — an area that could act as a strong support.
If the pattern completes, we might see a bullish reaction from that zone, targeting:
1st Target: 345.5 USDT (1.27 Fib extension)
2nd Target: 412 USDT (1.618 Fib extension)
However, failure to hold near the C zone could lead to deeper retracements before any significant reversal.
📊 Overall, I’m watching for a confirmed bounce at C before considering long positions.
#SOLUSDT #HarmonicPattern #CryptoAnalysis #TradingView
Trade ideas

Too Early to Buy Solana? Watch the $200–210 ZoneAs mentioned in my general crypto post yesterday, I remain bullish on the broader market and still hold some altcoins at this stage.
However, that doesn’t mean we should jump in blindly, assuming this is it.
Every setup needs confirmation — and Solana is no exception.
At the time of writing, SOL/USD is trading close to my initial entry area, but price action deserves a closer look.
1. What Happened on Friday
The general market sell-off pushed Solana below both a key horizontal support and the lower boundary of its rising channel — a clear bearish technical signal.
After that, we saw a strong recovery into the weekend, with price touching the psychological $200 level overnight before facing some resistance.
2. Current Market Structure
Despite the bounce, the structure remains bearish for now.
A clean stabilization and acceptance above the $200–210 zone would be the first technical sign of a potential trend shift to the upside.
3. Trading Plan
If you’re considering a long position on Solana, I believe it’s too early to enter.
The market looks overconfident in recovery, and when everyone assumes “the bottom is in,” that’s often when a new drop comes.
Wait for confirmation!

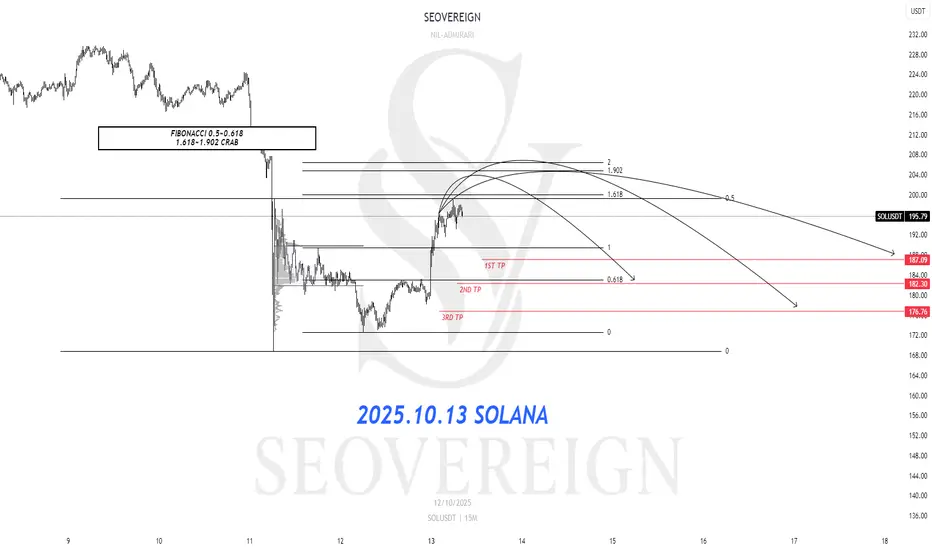
[SeoVereign] SOLANA BEARISH Outlook – October 13, 2025Today, I would like to share my bearish outlook on Solana as of October 13.
The first basis for this view lies in the 0.5–0.618 Fibonacci retracement zone.
This zone is known as a key area where, after a correction within an uptrend has completed, short-term rebounds tend to be limited and a bearish reversal often follows.
In particular, the 0.618 level—often referred to as the “golden retracement ratio”—typically serves as a strong resistance point where selling pressure re-emerges after an excessive pullback.
Currently, Solana’s upward momentum appears to be slowing within this 0.5–0.618 range, suggesting that the upper resistance pressure is gradually intensifying.
The second basis is the 1.618–1.902 CRAB pattern.
While the Potential Reversal Zone (PRZ) of a traditional Crab pattern is located at the 1.618 extension of the XA leg, it is often observed in real market conditions that prices extend up to the 1.902 level before a sharp reversal occurs.
This range indicates that the market has entered an overheated phase, and strong corrective waves frequently emerge when the pattern completes.
Accordingly, the average target price is set around 182 USDT.
Depending on how the chart unfolds,
I will provide further updates to this idea, including position management and any significant changes.
Thank you for reading.
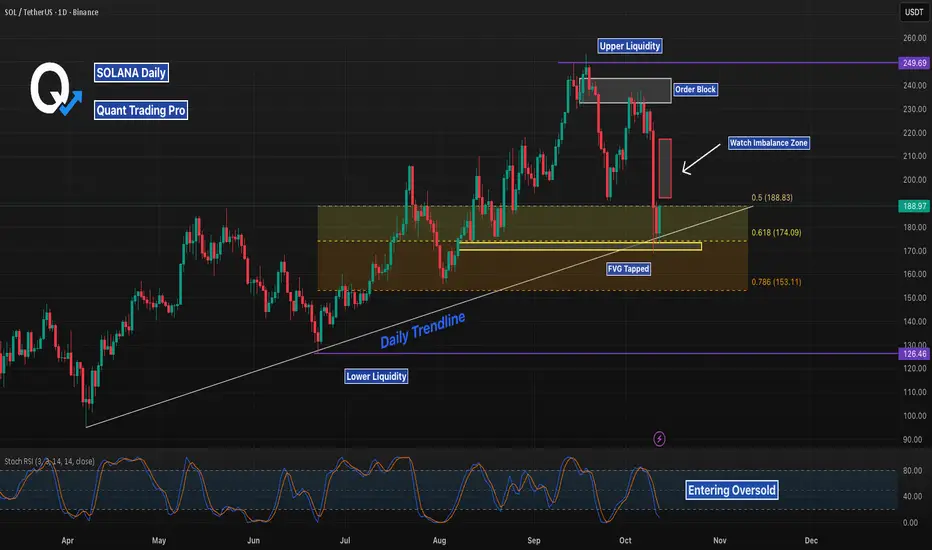
SOL Daily Recap: Breakout or Reversal Ahead?Solana (SOL/USD) recently tested the daily trendline support around $174.09 and bounced, with price action now approaching the FVG target zone near $189.55. The bullish move pushed toward the watch imbalance zone at $200, hinting at a potential breakout toward upper liquidity at $240 if momentum holds. However, the order block rejection near $210 suggests caution—watch for a bearish reversal if it fails to break, targeting lower liquidity at $153.11. With Stoch RSI entering oversold, a bounce or further dip could be next—keep an eye on $200 as the key pivot!
SOLUSDT 1D#SOL is trading within an ascending channel on the daily chart. It is currently sitting on the daily SMA200 and is expected to move toward the top of the channel. In that case, the potential targets are:
🎯 $202.36
🎯 $228.57
🎯 $261.97
In case of a breakdown below the channel, the downside targets are:
$150.65
$140.07
⚠️ Always remember to use a tight stop-loss and maintain proper risk management.

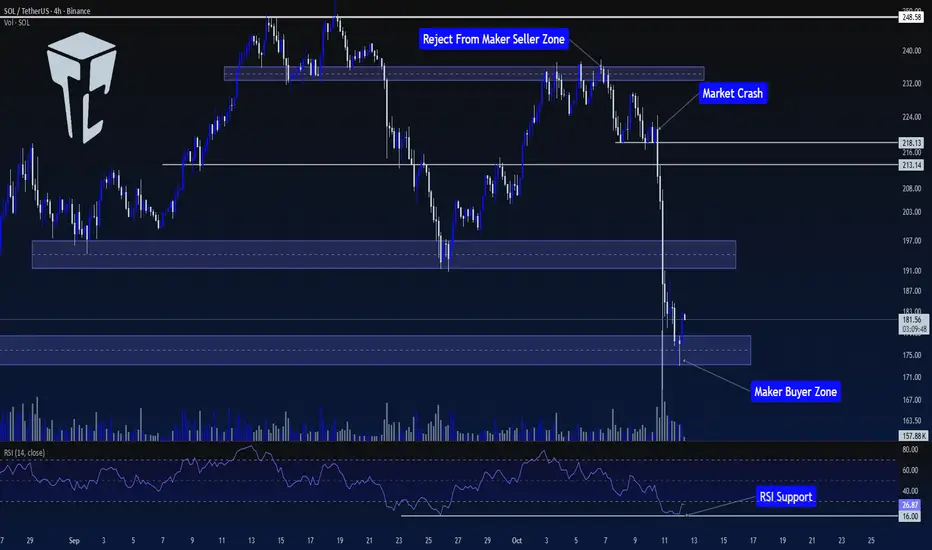
TradeCityPro | SOL: Market Calms After Sharp Move & RSI Support👋 Welcome to TradeCityPro!
Let’s analyze SOL, one of the most popular Ethereum killers with a market cap of $99.9 billion, currently ranking 6th on CoinMarketCap.
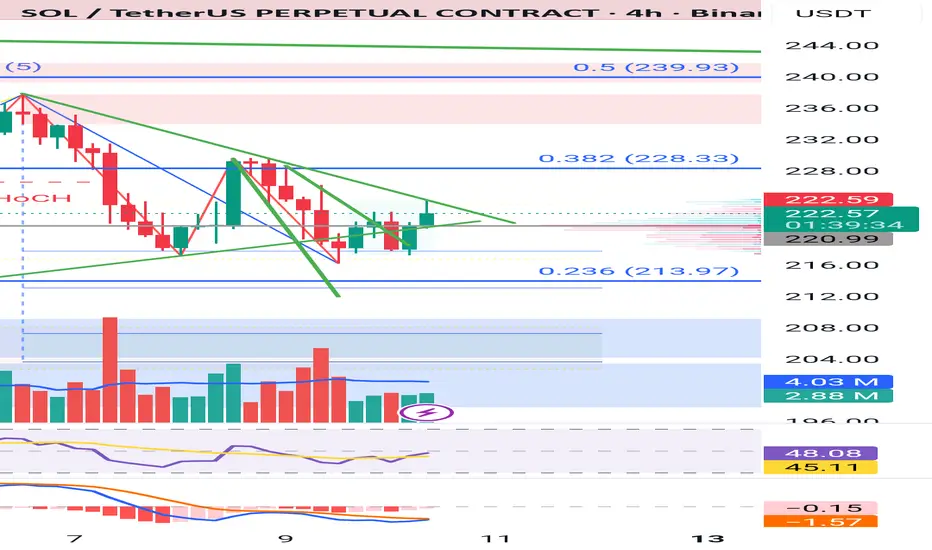
⏳ 4-Hour Timeframe
In the previous analysis, we had a Maker Buyer zone around $235. In that analysis, I mentioned that breaking this zone would be an early trigger for breaking $248.58.
🔍 However, the price never managed to sustain above this level, and after getting rejected from this zone, the price entered a corrective phase, forming a support at $218.13.
📊 After the price bounced from $218.13 for the first time, it failed to set a new high in line with previous highs and instead formed a lower high. The price returned to $218.13 again.
✔️ With the breakout of this level, coinciding with news between China and the U.S., the price started a sharp downward move, breaking through the $213.14 support.
✨ Over the course of 2-3 candles, SOL made a sharp move towards the first Maker Buyer zone, breaking it and reaching the second Maker Buyer zone.
💫 Naturally, there was a significant increase in selling volume during this move, and RSI dropped to 16, where it found support.
🧩 Currently, the market seems to have calmed down, with RSI still in the Oversell zone, but volatility has significantly decreased.
💡 Although the market has calmed, I believe the price needs to build a more structured setup before finding valid triggers, and the market conditions are not ideal for opening positions right now.
💥 So, for now, I won’t provide any triggers on this coin and will wait for more structure to form before making a better decision to open a position.
📝 Final Thoughts
Stay calm, trade wisely, and let's capture the market's best opportunities!
This analysis reflects our opinions and is not financial advice.
Share your thoughts in the comments, and don’t forget to share this analysis with your friends! ❤️
SOL last support area potenial of 20% gain toward 218$hi
the support and resistances on the chart are based on the previous data and weekly candlesticks if BINANCE:SOLUSDT holds this last support the potential of 20% gain is logical toward 218$

SOL; Trend Breakout.Hello Traders..
Lets take a look at SOLUSDT..it reveals to have been moving on a circle momentum of Uptrend for this couple of days, which after failing to hold and detain into this region. The price fell and broke the higher lows zone there by triggering it to go below the down division area.
We are considering a target at sections of $155-$125 as the next potential support.
Thanks for reading

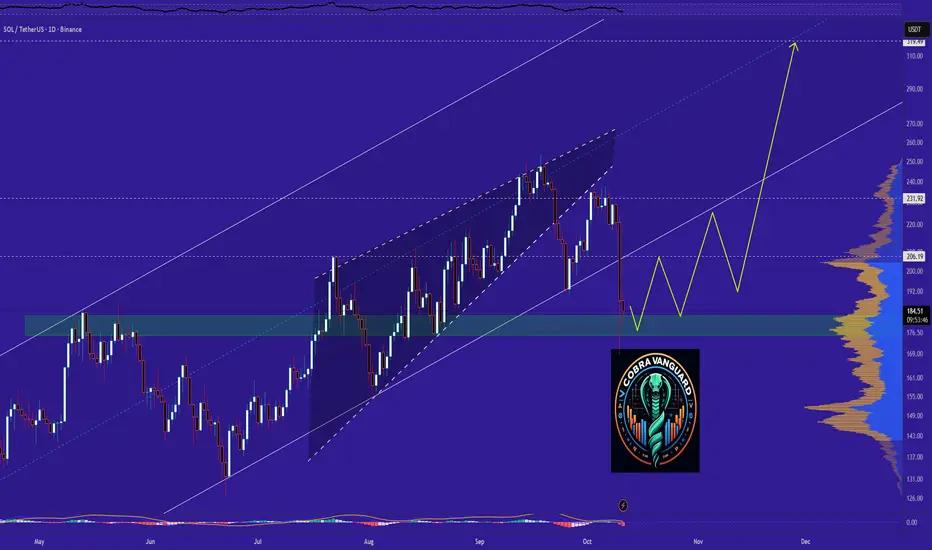
SOLANA Outlook after the Dip. What to expect NOW? has broken below its ascending channel support near $190, signaling short-term weakness. If buyers fail to reclaim this level, price could test the $150–$160 demand zone. A strong rebound from that area might restart the uptrend toward $220–$240.
The price can easily reach the shown targets from here.
Best regards CobraVanguard.💚
SOLANA SOLUSDTSolana (SOL) ETF PENDING
There is widespread optimism that the U.S. Securities and Exchange Commission (SEC) will approve a spot Solana ETF in 2025. Multiple filings from major firms like VanEck, Fidelity, Grayscale, Canary, and Franklin Templeton are under review.
Analysts put the approval odds high ,anticipating billions in new institutional inflows that could boost SOL’s price significantly to over 500$
The REX-Osprey Solana Staking ETF (SSK) launched in July 2025 has shown strong investor interest, demonstrating early institutional appetite.
However, progress has been delayed due to the partial U.S. government shutdown starting October 1, 2025. The SEC has halted many normal functions, including ETF approvals, causing uncertainty and delaying final decisions.
Reasons for the Drop This Week FROM 214.62 after the break of the neckline of the double top structure on daily time frame and on the retest we sell
key support will be the daily pivotal and psychological support floor at 86.86-84$ zone
US Government Shutdown Impact:
The ongoing partial US government shutdown since October 1, 2025, has caused delays in regulatory decisions, including ETF approvals that many expect to boost Solana. This uncertainty hit investor sentiment and liquidity.
Broader Crypto Market Volatility:
General weakness in the cryptocurrency market amid geopolitical tensions, US-China trade conflicts, and macroeconomic uncertainty have pressured crypto prices, including SOL.
Profit Taking After Recent Rallies:
After significant gains approaching the yearly highs, some investors took profits, leading to sell-offs and price corrections.
ETF Approval Delay:
The anticipation of a Solana spot ETF approval has fueled recent rallies. With delays caused by regulatory pauses, the momentum stalled, feeding into the price drop.
Analysts expect approval likely once the government reopens and regulatory processes resume.
#sol #solusdt #crypto #btc #ethusdt

$Solana $250+ or DOWN 216?In our recent post, we perfectly predicted the touch of 250 and 190.
Price has now reversed off the supply zone and is making its way back up, lets see what the potential out come for the next two weeks are!
Solana (SOL/USDT) 1H Chart Analysis
Current Price: ~$232
Trend : Price is was inside a clear ascending channel, respecting support and resistance lines - however has now breached resistance.
Key Levels
Support Zones:
$225 → Psychological support + 4H FVG.
$216 → Deeper 4H FVG and strong volume node. ( + 4 Hour Fib GP )
$200 → Major psychological level + prior supply zone flip.
Resistance Zones:
$250 → Psychological resistance + demand zone.
$275 → Next major resistance if $250 breaks.
Bullish Scenario
If SOL holds above $225 and consolidates within the trend channel, price could retest $250.
Break and close above $250 may extend rally toward $275.
Bearish Scenario
Failure to hold $225 could drag SOL to the $216 FVG or even $208.
A breakdown of $208 increases risk of revisiting $200.
Summary
Market structure remains bullish as long as price respects the rising trendline.
$225 is the key short-term pivot: holding above favors $250+, losing it opens downside risk toward $216–200.
Let me know what you think!

Posted Solusdt for yall check my recent post When I posted SOL some said it won't happen that crypto if going up
And here we are
I'm entering the weekend with mad profit and if you took the trade when I posted it
Congratulations🩷💥💥💯

SOL - PERFECT PLAY.#SOL - MEDIUM TERM OUTLOOK - ON POINT 🔥📉
7.5% dump since this update.
Zooming on my macro time frame view, this could be the final dump before to see a huge move upward! 📈
(valid if 196 - 198$) act as key support.
Level by level.
Local support: 205 - 206$. (expecting some bull reaction soon, likely before the next dump?).
Also Keep an eye on the daily uptrend. 👀

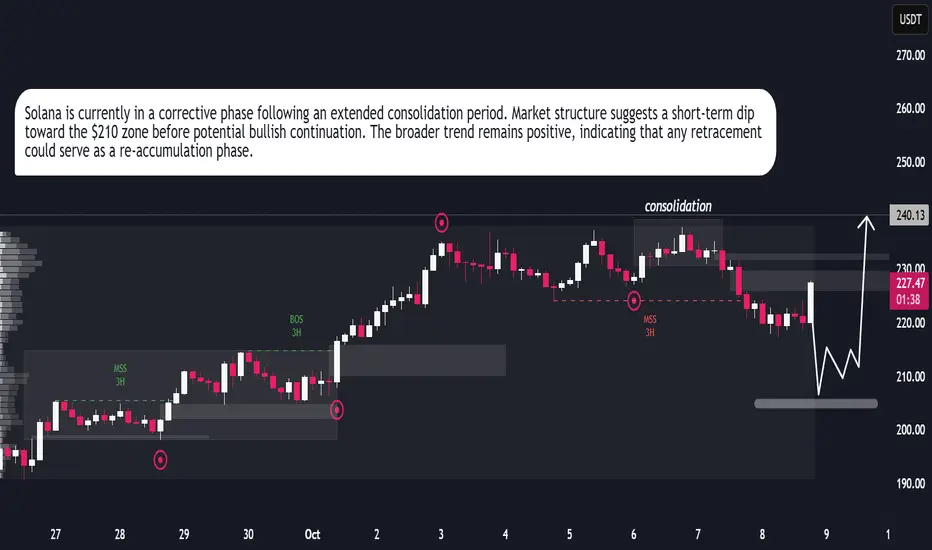
SOL | Network Strength Meets Market MomentumSolana (SOLUSDT) continues to show resilience as both technical and fundamental factors align for potential upside. On the technical side, the market has completed a controlled correction phase, suggesting liquidity buildup below recent lows. The structure remains bullish, with increasing volume and price stability hinting that buyers are regaining control. Fundamentally, Solana’s network growth and strong developer activity have reinforced investor confidence, supported by rising on-chain activity and ecosystem expansion in DeFi and NFTs. This combination of solid fundamentals and technical structure indicates the possibility of another bullish leg, with SOL positioning itself for a gradual climb toward the $240–$250 range in the near term.
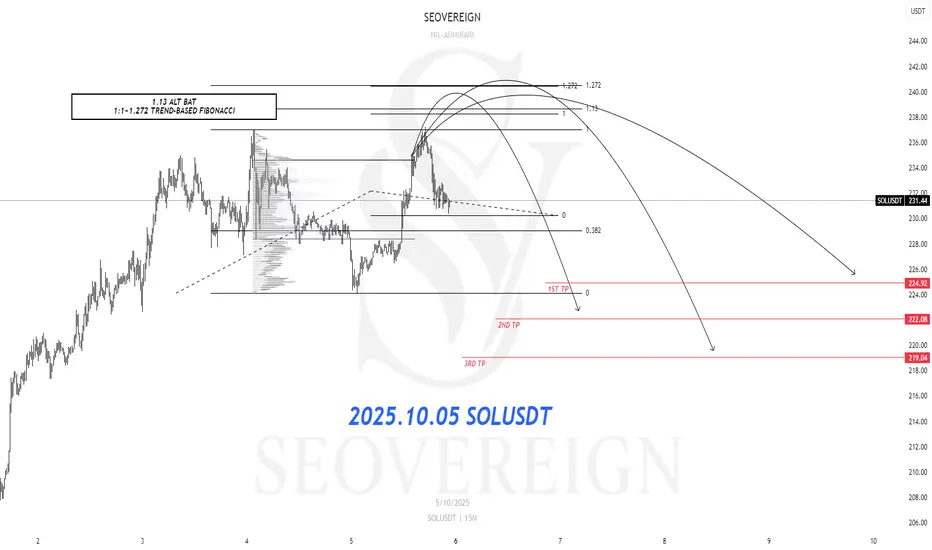
[SeoVereign] SOLANA BEARISH Outlook – October 05, 2025Hello everyone.
I hope you are all having a peaceful day.
Today, I am writing to share my short position perspective on Solana as of October 5th.
The first basis is the 1.13 Alternate Bat (ALT BAT). The Alternate Bat is a variation of the harmonic pattern established by Scott Carney, and its core principle lies in defining the PRZ (Potential Reversal Zone) where point D is located at 1.13 times the XA leg (=1.13XA). The convergence of these ratios creates a relatively narrow and reliable retracement (or reversal) zone, so when D is positioned around 1.13XA, it is necessary to carefully observe the potential for a short- or mid-term reversal.
The second basis is that an arbitrary wave N forms a 1:1 length ratio with another arbitrary wave M. Among Fibonacci ratios, 1:1 is one of the representative standards used in Elliott Wave and harmonic analyses for measuring wave length and retracement. When one wave exhibits approximately a 1:1 length with another, that point tends to act as a natural retracement or termination zone, and the reliability increases especially when it overlaps with other technical grounds.
Accordingly, the average target price is set around 222 USDT.
As the chart movement unfolds, I will provide updates on position management through revisions to this idea.
Thank you for reading.
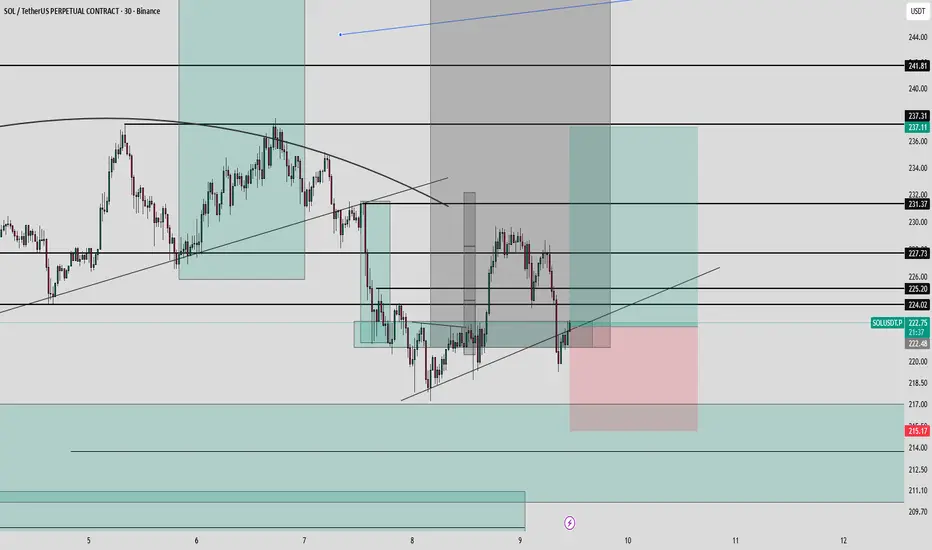
The trend is your friend until it isn't! Looking at the 4 hr chart, we're still looking bearish while we're under that trendline. Lets see how the next 2 hrs play out. There's liquidity around 215 and 230. Im leaning to a short to around 215, there's a nice FVG that should be filled bf it goes back up. If this reverses at the trend line or it taps 230 ill try shorting. What are your guys thoughts? Id love some input 👍😁
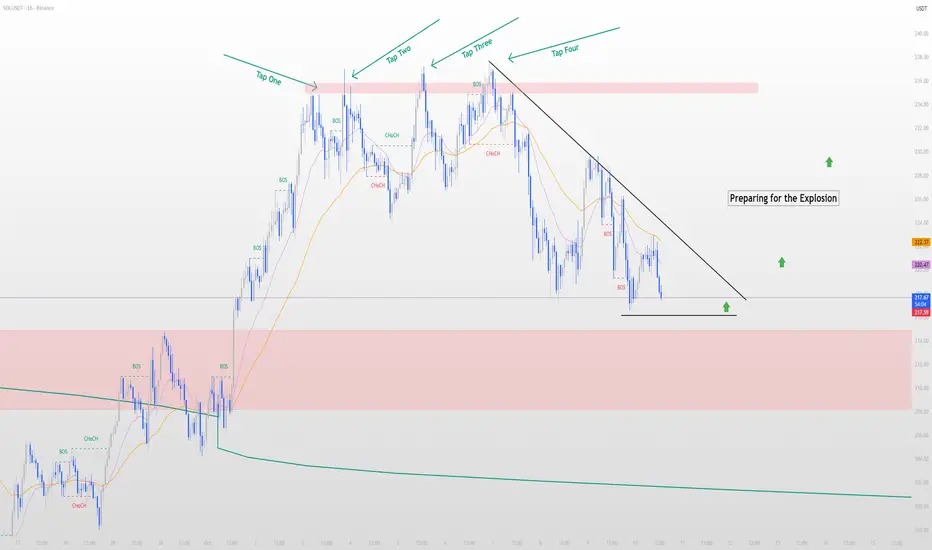
SOLANA (SOL/USDT) – Preparing for the ExplosionSOLANA (SOL/USDT) – Preparing for the Explosion 💥
Solana is gearing up for a major breakout.
It has tapped the resistance line four times, showing strong testing pressure on the upper trendline — and has now pulled back for a healthy correction.
The structure has formed a perfect symmetrical triangle, indicating strong accumulation before the next explosive move. When momentum builds, a decisive breakout above resistance is highly likely — potentially setting the stage for a new all-time high.
This setup is independent of Bitcoin’s current price movement.
Many BTC holders have already taken profits — and if liquidity flows into SOL, we could see the momentum intensify dramatically.
I also have other technical tools that support this idea, but everyone is free to use their own preferred tools for confirmation.
📈 Key idea: Solana is preparing for the explosion — the compression before expansion.
SELLS*)Market Structure-MSS
*)POI/Key Level- Supply
*)Quasimodo(QM)
Note: the market is all about probabilities which also makes my analysis a probability.

SOLUSDT LONG TRADE TO ATHSuper Bullish on SOL.
This gem is going to renew ATH very soon.
Now is a good point of entrance for Long position.
DYOR.

SOLANA LONGSOLUSDT is approaching a strong demand zone around 216–217 where previous liquidity sweep and accumulation took place. CVD and OI suggest short exhaustion, and funding rates have normalized, indicating a potential shift in momentum.
Long setup targeting 237 zone, with confirmation on bullish structure break and sustained volume recovery.
Entry: cmp
dca : 216 to 217
Target: 237
Stop-loss: Below 215
Bounce from 215 area before the run!So from what I can see based on liquidity heatmaps and market sentiment right now. Looks to me that we'll pull back to around 215 or so then run hopefully with tomorrow's ETF approval and rate cuts at the end of the month.
coinank.com

DeGRAM | SOLUSD is holding the support zone📊 Technical Analysis
● SOL/USD is consolidating above the dynamic support near $220 after rebounding from the lower channel line, signaling potential continuation toward $248 resistance.
● Price action shows higher lows and tightening structure, indicating accumulation within a bullish continuation pattern. Holding above $220 keeps momentum intact for an upward breakout.
💡 Fundamental Analysis
● SOL benefits from rising DeFi activity and growing adoption of Solana-based projects, while investor sentiment strengthens amid broader altcoin recovery.
✨ Summary
● Long bias above $220; targets $248. Consolidation supports bullish continuation amid improving market sentiment.
-------------------
Share your opinion in the comments and support the idea with a like. Thanks for your support!

SOL-USDTThere was a pullback to the $226 level 🔽
If the trend line is broken, the correction could continue to the two green supports
The main and important support is around $200
