Solana Breaks $220 on ETF HypeSolana Breaks $220 on ETF Hype, Can the Momentum Sustained?
Solana has broken through the critical resistance at $220, fueled by growing excitement over a potential ETF. Price hit an intraday high of $226.7 as bullish sentiment takes hold. At press time, SOL is trading at $224.35
On the 2-day chart, we can say that the bullish momentum remains intact as the liquidity curve is being respected. The resistance that we need to break is $230, a break above $230 could pave the way toward $260-$270.
If we can establish the $200 as base support, buyers remain in control. However, a drop below $200 might stall the bullish momentum and a possible retest of $160.
Trade ideas

SOL 02.10#SOL
Easily broke out of the VAH local range since September 22. A possible retest of 221-222 could propel us further; I don't see any significant weakness on the indicator.
There are no serious resistances at all. The closest possible ones, from which we could react, are 235-240, 253-256, with liquidity at 273 and ATH.
Support zones:
221.5-222
215.1-215.7
207-210
Resistance zones:
207-210
234.2-234.7
238.4-240
SOL Long Alert 1hTimeframe 1h Direction Long waiting retracement, confluence with imbalances & fibbonaci golden ratio, waiting for rejection candle (Bullish Engulfing/Green Hammer) to continuing the bullish trend,
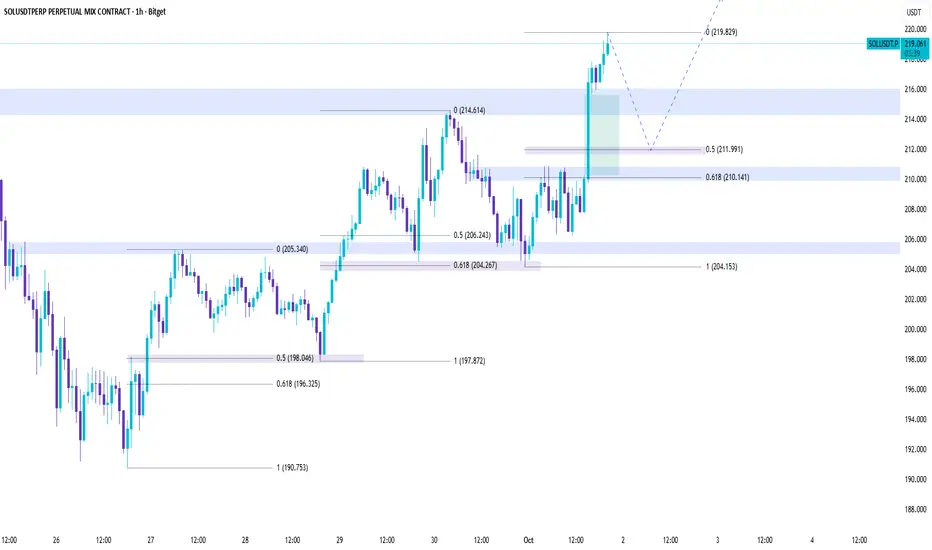
Support near 222.61 is key
Hello, fellow traders!
Follow us to get the latest information quickly.
Have a great day!
-------------------------------------
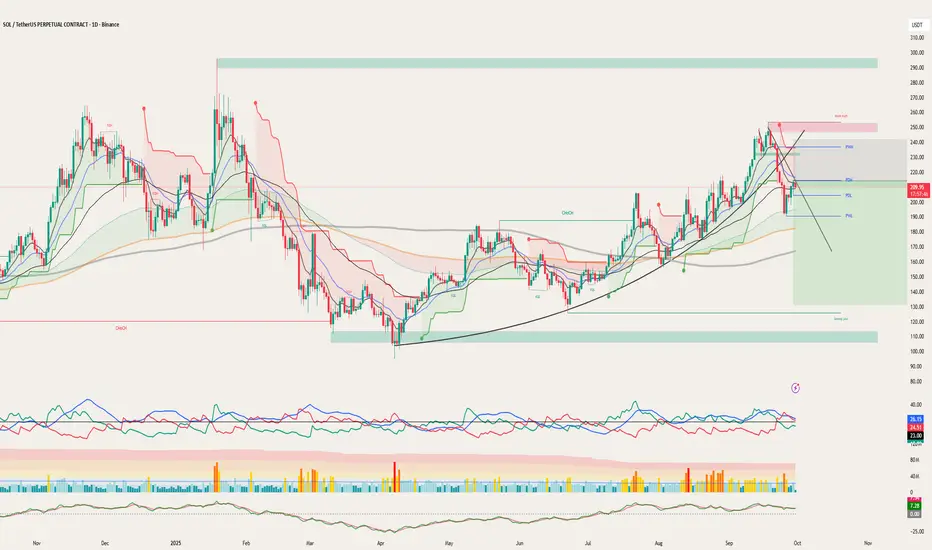
(SOLUSDT 1D chart)
There are many lines drawn, but the important area is ultimately the 179.74-247.50 range.
Among these, a rise above 236.88-247.50 is necessary for a stepwise uptrend to continue.
The key is whether the current 202.45-222.61 range, i.e. the DOM (60) ~ HA-High range on the 1W chart, can provide support and allow for an upward movement.
Therefore, based on the 202.45-222.61 range, we need to monitor whether the price rises above 236.88-247.50 or falls below 179.74.
-
To break through this critical point or range and continue the uptrend,
- The StochRSI indicator must be trending upward. If possible, it should be below the overbought level.
- The On-By-Significant Volume indicator must be trending upward. If possible, it should remain above the High Line.
- The TC (Trend Check) indicator must be trending upward. If possible, it should remain above the 0 level.
-
Thank you for reading to the end.
I wish you successful trading.
--------------------------------------------------

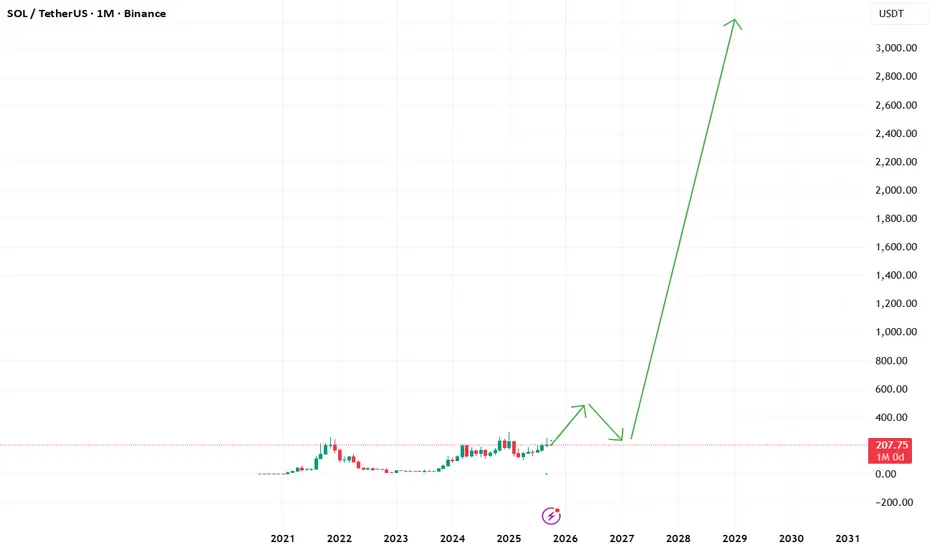
Why Solana Could Surpass $300 in 2025–2026Hey guys, today I want to share my full view on Solana (SOL) .
For a long time, my main focus as an investor and trader was always on Bitcoin and Ethereum. But in the last 12 months, I started massively investing into Solana. The reason is simple: the ecosystem is not only recovering from its darkest days but is now proving real resilience, adoption, and growth.
When FTX collapsed in November 2022, Solana took one of the hardest hits. FTX and Alameda were among the biggest backers of the Solana ecosystem. When they went bankrupt, SOL crashed under $12 and many people stopped believing in its future. The market saw Solana as “FTX’s chain.” But fast forward to today, and we are witnessing a complete turnaround. Users are coming back, new protocols are being launched, and on-chain activity is stronger than ever.
In our crypto prop trading company , we’re building new infrastructure for our traders, and after careful research, we chose Solana as the best chain for implementation . Its speed, scalability, and near-zero fees make it the most practical blockchain to build on. And it’s not just us — many other companies and institutions are starting to integrate with Solana, which will bring even more growth in the months ahead.
⚠️ Quick disclaimer: This is not financial advice — only my humble opinion based on research, analysis, and experience.
Solana Price Action & Key Events (2022–2025)
To understand Solana’s current position, let’s look back at its journey over the last few years:
Bridge Breach (Feb 2022): The Wormhole bridge hack stole ~$325M, hurting trust in Solana DeFi.
DeFi Winter (May 2022): The Terra UST/LUNA collapse triggered a full liquidity crisis across all DeFi. Solana’s TVL drained fast.
FTX Implosion (Nov 2022): The turning point. FTX and Alameda went bankrupt, SOL crashed under $12, and the bear market bottom was defined.
Meme Season (Early 2024): Retail users came back with BONK and other meme coins. Solana’s speed and low fees made it the perfect hub for speculation.
WIF Mania (Spring 2024): Dogwifhat (WIF) went viral, volumes on Solana even surpassed Ethereum at times.
Pump.fun Frenzy (Apr 2024): Millions of tokens launched through Pump.fun, onboarding hundreds of thousands of wallets and driving record on-chain activity.
Full Recovery (2025): After two years of stagnation, SOL broke above $200 again, fully recovering to pre-FTX levels and proving that it can thrive as a community-driven, retail-driven chain.
Solana On-Chain TVL (Total Value Locked)
TVL (Total Value Locked) shows how much capital is locked in DeFi protocols on Solana — lending, staking, DEXes, and yield farming.
2021–2022: First boom, TVL surged past $10B.
2022–2023: Collapse after Terra and FTX, TVL fell close to zero.
2024–2025: Strong recovery — TVL passed $9–10B again, showing users are back and Solana DeFi is alive.
Why this matters: TVL growth proves Solana is not only about meme coins. Capital and liquidity are returning, and users are once again trusting the chain with real money.
Solana DEX Volume & Pump.fun Impact
In just one day, DEXs on Solana processed $10.3B in trading volume.
Pump.fun alone made up ~80% of that ($7.93B).
Pump.fun is unique because it allowed anyone to instantly create and trade tokens, onboarding massive numbers of new users. At its peak, Pump.fun had over 400,000 weekly active addresses , and even today it still makes up around 10% of all Solana DEX activity .
This shows two things:
Solana is the clear leader in retail-driven trading.
The ecosystem still needs broader use cases to sustain growth once meme speculation slows.
Futures Open Interest – Market Confidence
Open interest (OI) in Solana futures collapsed after FTX, but in 2024–2025 it came roaring back, growing alongside SOL’s price.
Positive: Rising OI shows traders trust Solana again, and rallies are backed by real activity.
Risk: Very high OI means higher liquidation risk. If markets turn, leveraged positions could cause sharp corrections.
Pump.fun Traders Data – Not Everyone Wins
According to Dune Analytics, 99.6% of Pump.fun traders never made more than $10K in realized profits . Only a small fraction hit big wins, while most made little or lost money.
This highlights the gambling-style nature of meme trading: it drives huge network activity but is not sustainable long-term. For Solana, the key is converting this short-term hype into long-term adoption.
Why Solana Could Rise in Late 2025–2026
Looking forward, here are the main reasons I believe Solana has strong upside potential:
1. Tokenization Boom
By 2033, $20T in assets could be tokenized.
Solana has the scalability, low fees, and adoption needed to be the leading infrastructure.
2. On-Chain Usage
Solana already surpasses Ethereum in active addresses and transactions (100M monthly users, 3.5B monthly txs).
More usage → more fees → higher staking yield → stronger SOL demand.
3. Institutional Adoption
Major players like BlackRock, Franklin Templeton, Visa, and PayPal are already launching tokenized products or stablecoin integrations on Solana.
4. Ecosystem Growth
Solana dominates in trading, token creation (60% of new tokens), and new sectors like AI agents.
From Pump.fun (retail) to xStocks and OnRe.finance (institutional), Solana is proving versatile.
5. Technology Roadmap
With Firedancer and other upgrades, Solana is moving toward 100k–1M TPS capacity, making it “internet-scale finance.”
6. Investment Case
SOL is scarce (~750M fixed supply), yield-bearing (7–13% staking), and directly tied to network growth.
Analysts project potential 4x–30x appreciation (short-term ~$900, medium ~$2,000, long-term ~$6,000).
Outlook – Target $300+
If 2022–2023 was about survival, and 2024–2025 was about recovery, then 2026 could be Solana’s breakout moment as the backbone of digital finance.
With on-chain activity at record highs, institutional adoption growing, and scalability improvements rolling out, a move above $300 in late 2025 or 2026 is not only possible but realistic.

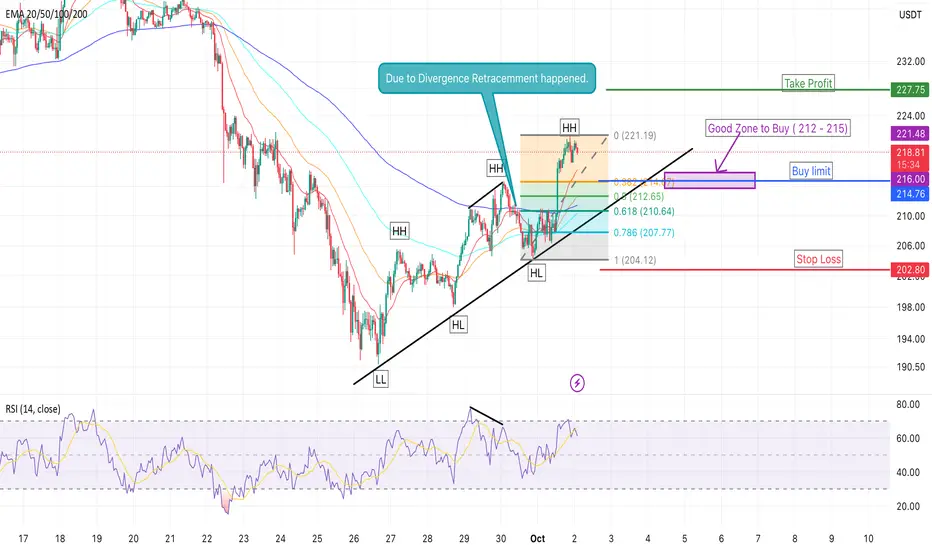
SOL/USDT: Breakout or Pullback? Key Levels AheadOn the 1H timeframe, Solana is showing a clear bullish structure with consistent Higher Highs (HH) and Higher Lows (HL). The ascending trendline is well respected, supporting the bullish move.
🔎 Technical Outlook
Price recently made a new HH at 221 before pulling back.
Current retracement is testing the Fib 0.382 level around 214.5 which also aligns with dynamic support from the EMA cluster.
Deeper retracement levels to watch:
Fib 0.5 (212.5)
Fib 0.618 (210.5) – strong confluence with trendline support.
RSI (62): Slight bearish divergence forming, suggesting short-term pullback possible.
📈 Bullish Scenario
If SOL holds above 214–212 support, we may see a continuation toward 225–230 next resistance zone.
📉 Bearish Scenario
A break below 210.5 and trendline would invalidate bullish structure → price could retest 204–205 support zone.
⚡️ Fundamentals
Solana continues to gain traction with high DeFi and NFT activity.
Overall sentiment in altcoins remains bullish, supporting continuation.
✅ Trading Plan
Watch 214–212 as key support.
Long entries possible near Fib 0.5–0.618 with tight SL below 204.
Target: 225 / 230.
💬 What do you think? Will SOL hold the trendline for another leg up, or is a deeper correction coming? Drop your thoughts below and follow for more updates!
📌 Disclaimer: This is my personal analysis, not financial advice. Trade safe and manage risk.
solusdt, solana, solanausdt, solanalysis, solchart, solanacrypto, solbullish, solbearish, solsetup, solanatrend, crypto, cryptotrading, cryptomarket, cryptocurrency, altcoins, altcoinanalysis, altcoinseason, altcoinsetup, altcoinguide, defi, nft, bullrun, breakout, trendline, fibonacci, support, resistance, ema, rsi, divergence, higherhighs, higherlows, technicalanalysis, chartanalysis, tradingsetup, cryptotrader, tradingview, tradeideas, bullishsetup, bearishtarget, cryptosignals
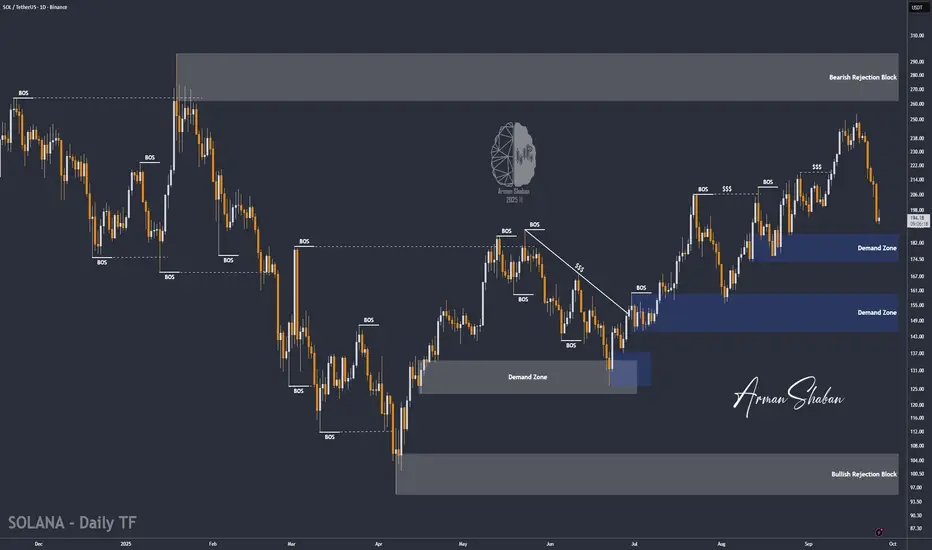
SOL/USDT | Solana Correction Could Spark Rally to $262 (READ)By analyzing the Solana chart on the daily timeframe, we can see that the price has continued its correction and is now trading around $194. As you can see, it’s getting close to the $173–$186 demand zone, and we need to watch whether this zone can trigger new buying pressure.
Personally, I expect a strong reaction from this area. If the price stabilizes here and shows the first signs of growth, the possible upside targets will be $205, $230, $242, $254, and $262.
Please support me with your likes and comments to motivate me to share more analysis with you and share your opinion about the possible trend of this chart with me !
Best Regards , Arman Shaban
[SeoVereign] SOLANA BEARISH Outlook – October, 03 2025The basis for presenting a bearish perspective in this idea is that an arbitrary wave m has formed a 1:1 length ratio with another wave n.
In addition, the Crab pattern at the 1.618 level has also been fully confirmed, further supporting the possibility of additional downside.
Accordingly, the average target price is set around 212.94 USDT.
Additional briefings will continue to be updated in this idea as the chart develops.

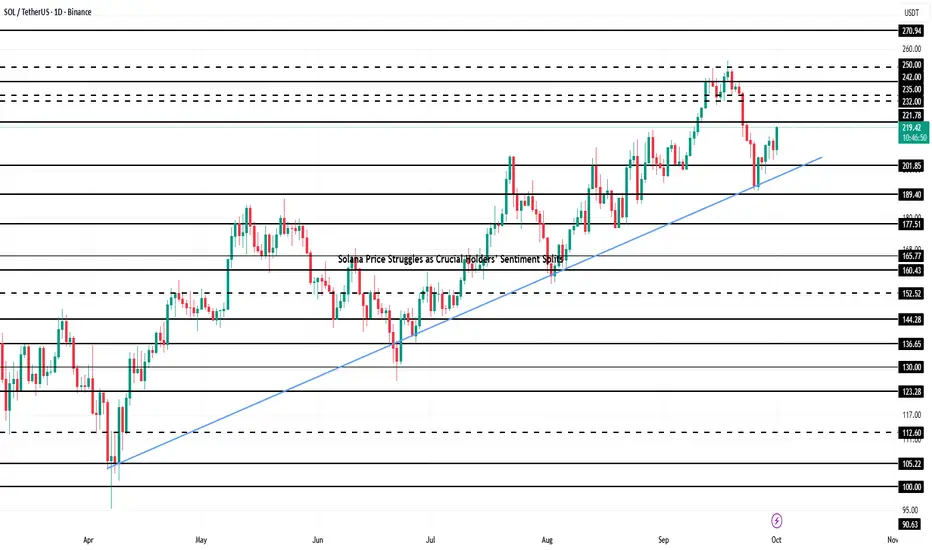
Solana Price Struggles as Crucial Holders’ Sentiment SplitsSolana is trading at $209, holding above the $206 support level and testing its uptrend line. The steady recovery underscores investor commitment to maintaining bullish momentum after brief interruptions caused by increased selling pressure from LTHs.
The mildly bullish outlook could extend Solana’s rally. If momentum holds, SOL could climb past $214 and $221 resistance levels. A push beyond those thresholds would open the path to $232, reinforcing optimism about further gains in the coming weeks.
However, if selling pressure from long-term holders intensifies, Solana risks slipping below $206. A drop to $200 would invalidate the bullish thesis, signaling weakness and potentially sparking renewed bearish sentiment in the altcoin’s market structure.
SOLANA LongSolana Breaks 1hr resistance , that is a good Bullish signal to go long targeting daily order block

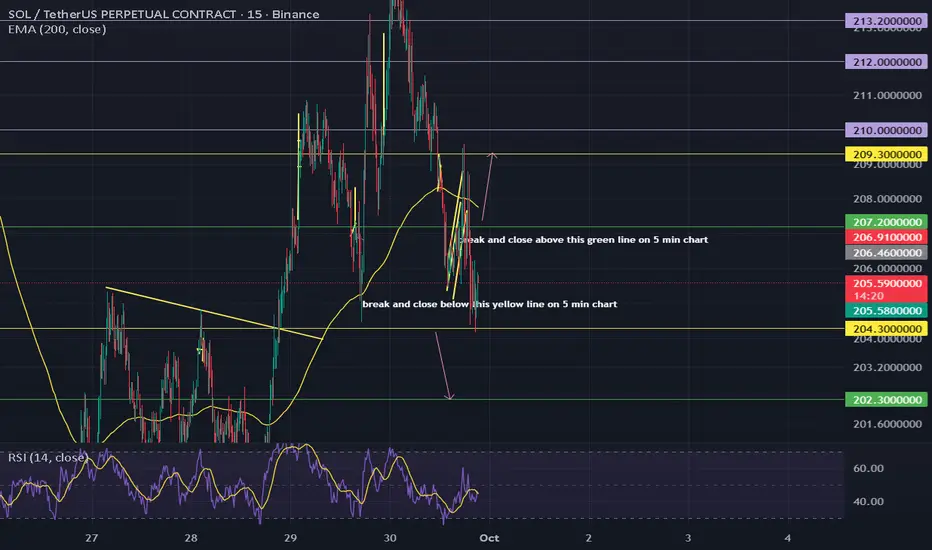
scalp your soul again Hi
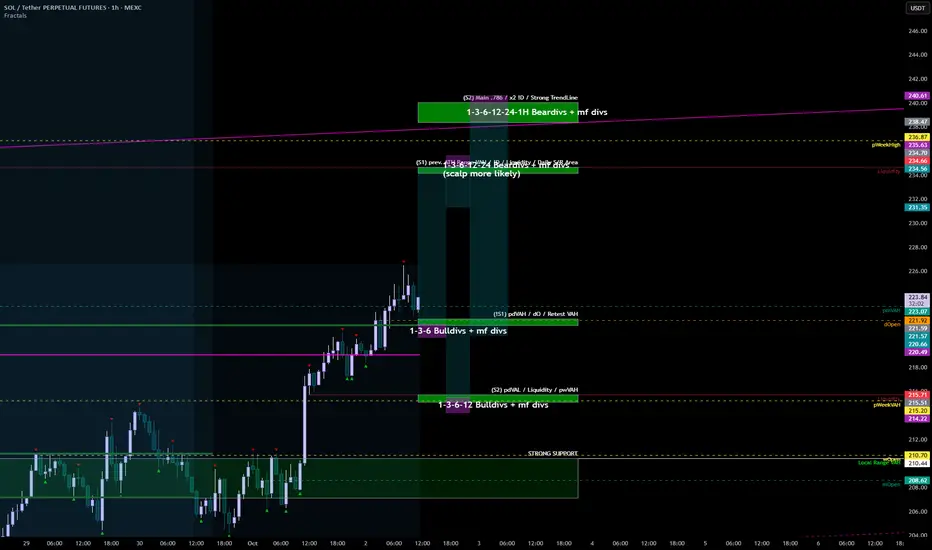
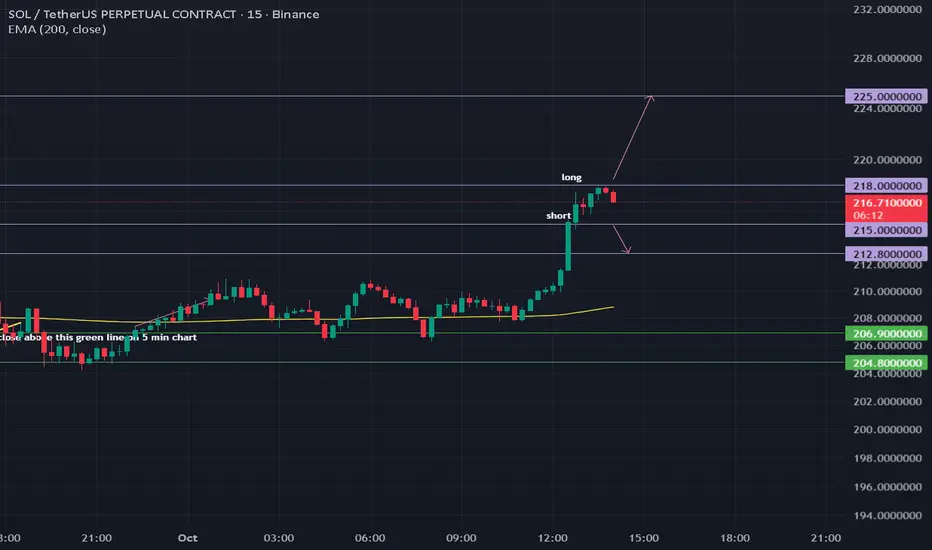
This trade targets the next major liquidity zone, capitalizing on the momentum generated by the market structure breakout and ETF speculation.
Momentum Trigger: Enter on a confirmed break and close above the current high (≈$217.42) to validate continuation after the current brief consolidation.
TP 225 A ≈3.2% move, targeting the next major psychological level and the midpoint between the current price and the all-time high zone

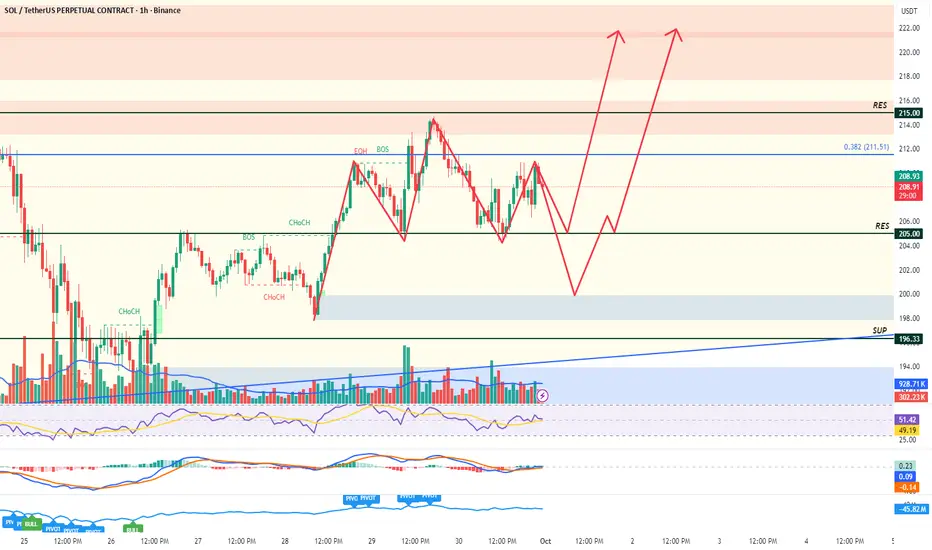
SOL 1H: Next Move IncomingGood morning, Solana is currently at the lower part of the channel and has tested the ascending trendline multiple times. A breakdown of this trendline could push the price down to the first support level, around $198. Conversely, a bullish breakout could drive Solana to the upper part of the channel, around $220. Awaiting confirmation.
Thank You!

SOL-USDTYesterday we recognized Solana's correction well and I hope you used it 💲📣
In today's update, Solana is fluctuating inside the specified compression
If Solana manages to get its downtrend line out of the way 👀
It could enter a bullish phase in the short term 🔼💲

Immediate pullback followed by a runI see two possible outcomes here. Either we hit resistance at 205 and bounce to 220ish area or we break resistance and head towards 198 before we make the next move up. NFA. Happy Trading!
Solana ready to break into new highsSolana- the most used crypto (90% of all blockchain activity! ) , which is already and going to be the future of all crypto starting from tokenized stocks till endless usecases, is about to break into new highs.
I expected SOL to be number 2 after bitcoin in terms of marketcap.
scalp your soulWait for the trigger. Do not pre-empt the breakout. The market is currently consolidating and chopping. The 1% move becomes "almost 100% certain" (in trading terms, meaning highest probability) only once one of these channel boundaries breaks on high volume.
Monitor Open Interest and Funding Rates as the move begins. A sharp drop on the short entry or a significant rise on the long entry will confirm the leveraged market is participating in the move.
Solana at 200 Support — Bounce Toward 230 or Deeper Drop?At the moment, Solana is in an upward correction but has already reacted from the weekly pivot point at 212 . I expect to see support around the 200 – 202 zone, though a dip to 198 is also possible.
However, if the price gets stuck below 198 and fails to quickly recover above 200 , the scenario with continued downside will become the priority.
For now, I’m looking for a move down into the 200 – 202 area, followed by growth with a new local high and a push toward the first resistance level at 230 .

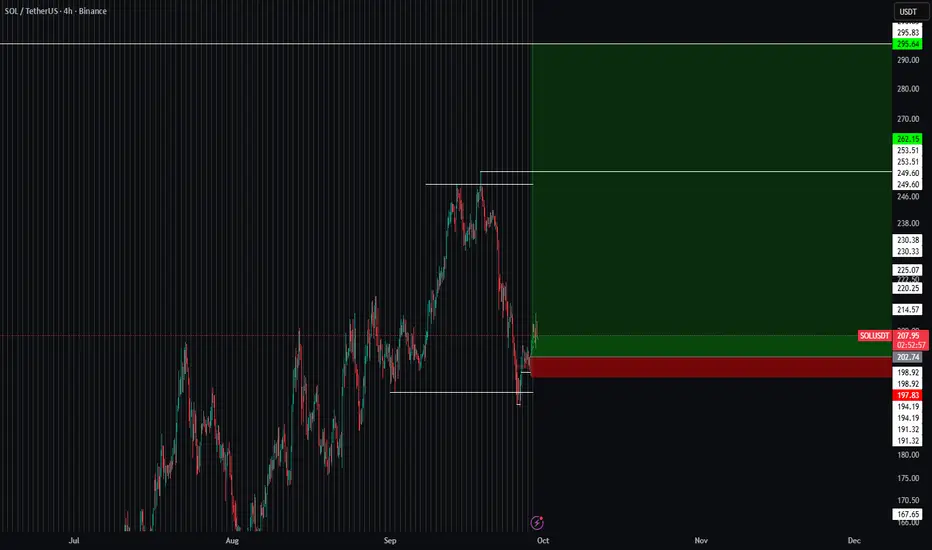
Buy/Sell (long/short) areas for major cryptos part IIIthis is a continuation of the successful part II analysis:
note for this part III is that the green zone mid october which it seems to be a good bottom for future red zones.
November looking like a potential full green month, maybe we see a good run around then.
gl

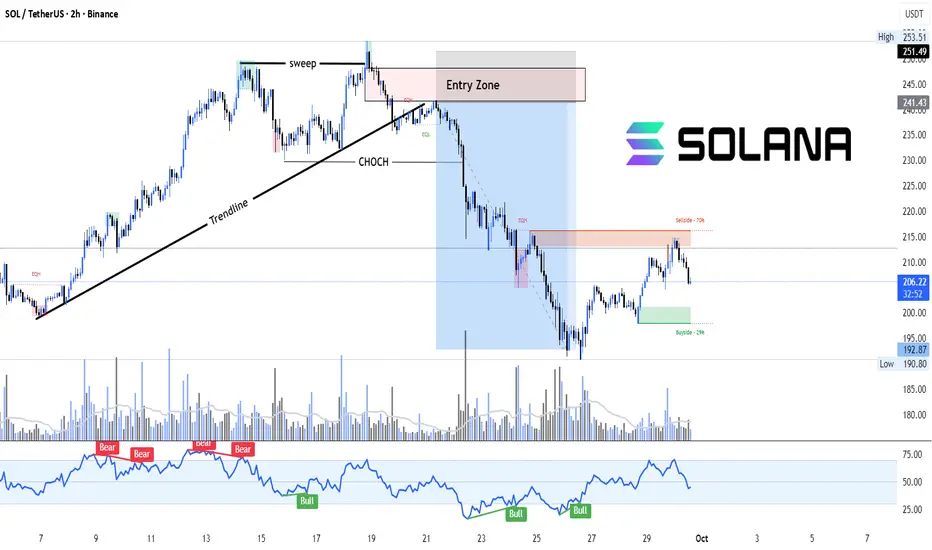
SOL: From Sweep to Selloff – Supply in ControlSolana (SOL/USDT) recently broke below a strong trendline after a liquidity sweep and clear Change of Character (CHOCH). Price retested the supply zone (Entry Zone) before continuing its downward move, showing a classic bearish market structure shift.
Currently, price is reacting from a sell-side zone (~70% retracement), with potential downside targets toward the buy-side liquidity (~29% retracement). RSI also reflects bearish divergence confirmation from the highs, aligning with the structural shift.
Key Highlights:
Engulfing candle + Trendline break + CHOCH confirmed bearish bias.
Entry Zone retest offered high-probability short setups.
Current rejection from supply signals further downside.
RSI divergence strengthens bearish case.
Solana rising wedge tests trendline support ahead of macro catalStructure: After a strong multi‑month rally, SOL is coiling in a rising wedge. The price sits above a key ascending trendline but below a descending resistance line from its recent peak.
Momentum: Moving averages are converging and volume has tapered off, suggesting momentum is slowing.
Key triggers: A clear breakout above the descending resistance would signal renewed strength; a breakdown through the trendline could extend the pullback toward lower support.
Risk factors: Macro events—non‑farm payrolls, the monthly inflation report, and the late‑October Fed meeting—may trigger volatility across markets.
Trade idea:
Bullish: Wait for a daily close and retest above the wedge; use stops below the recent swing low; aim for the next major resistance zone.
Bearish: Watch for a close below the ascending trendline; short a retest of that level with stops above; target the next demand area.
Reminder: Manage risk carefully and adapt as market conditions evolve.

[SOL] ATH HuntingAfter massive liquidations on the crypto space, I am willing to add to my long here and definitely on CRYPTOCAP:SOL since it's my biggest position (and winner).
Great Trade !