SOL SHORT TERM SHORT : 200 USD FIRST BEFORE WE RESUMESOL Price hit expected target between 245-250 area.
Looks like short term reversal of price is underway as traders take profits.
Next area of interest for bulls is $200 support.
Trade ideas

SOLANA UPDATEHello friends🙌
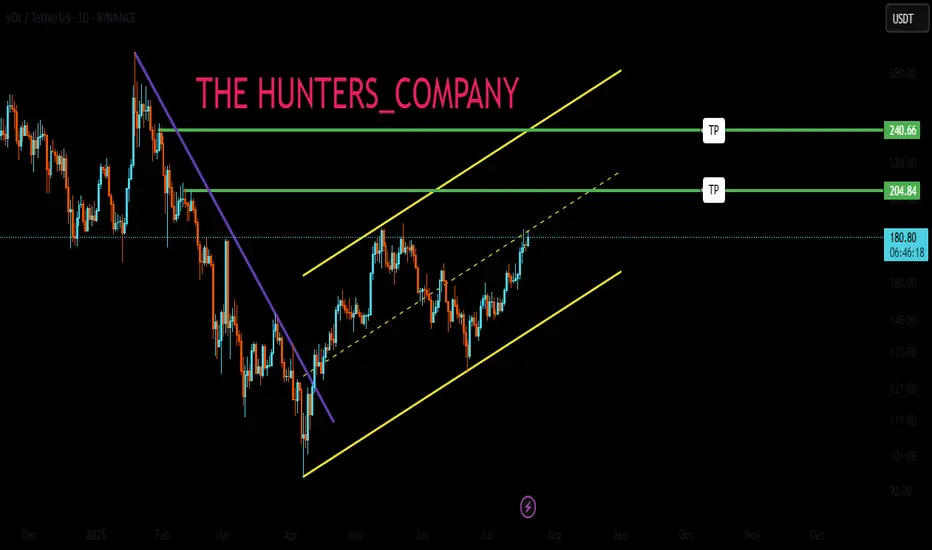
📉Given the decline we had, you can see that buyers came in and supported the price and were able to change the trend and create an ascending channel.
📈Now, considering that the price is hitting higher ceilings and floors, we can expect an ascending wave until the ceiling of the channel.
Don't forget risk and capital management.⚠
🔥Follow us for more signals🔥
*Trade safely with us*
Up or down?Hello friends
Well, considering the growth we had, the analysis of which we have already given you and it was full target, now we needed to go for another update.
Well, considering the price growth, there is an important resistance area on our way that they have determined for us.
If this resistance is validly broken, the price can move to the specified targets, but what if the price cannot break the resistance?
Well, don't worry, we have another scenario where if the price fails to break the resistance and falls, we have identified good support areas that if reached, the price can grow well to the set targets. Finally, it must be said that given the large number of buyers and the buying pressure we have in Solana, sooner or later, I think this resistance will be broken and we will see higher numbers.
*Trade safely with us*

$SOL Skyrockets to 240: Catch the Bull Run! BINANCE:SOLUSDT
CRYPTOCAP:SOL Skyrockets to 240: Catch the Bull Run!
Entry Level: Marked at 1 (240.00 USDT), suggesting a potential buy point near the current price.
Take Profit (TP) Levels:TP1: 0.786 (228.33 USDT)
TP2: 0.618 (219.17 USDT)
TP3: 0.5 (212.73 USDT)
TP4: 0.185 (185.46 USDT)
Stop Loss (SL): Set at -1.272 (254.84 USDT), indicating a level to exit if the price moves against the trade.
Dead Cat Bounce (DCB): Marked at -1.135 (247.36 USDT), possibly indicating a minor reversal point.
RSI (Relative Strength Index)Current RSI: Around 80.93, which is in the overbought territory (above 70), suggesting the asset may be overvalued and could be due for a pullback or consolidation.
Trend: The RSI has risen sharply in recent days, aligning with the price surge, indicating strong momentum but also potential overextension.
Key ObservationsThe chart indicates a bullish breakout with significant upward momentum, but the overbought RSI suggests caution. Traders might consider taking profits at the marked TP levels or waiting for a pullback to the entry or lower TP levels.
The SL is set above the recent high, providing a buffer against a potential reversal.
The analysis appears to use a Fibonacci-based strategy, with levels derived from a recent swing high and low.

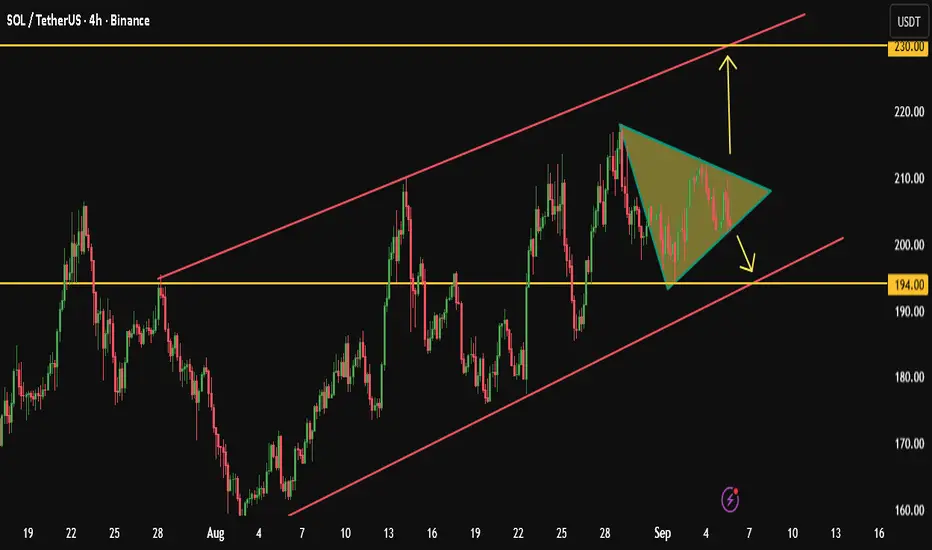
SOL inside ascending triangle,breakout will define the next moveCurrently, SOL price is consolidating within a symmetrical triangle pattern inside an ascending channel.
A breakout in either direction will determine the next move, towards 230 if it breaks upward, or towards 194 if it breaks downward.
As shown on the chart, Solana has been moving within an ascending channel since late July.
At the moment, a Symmetrical Triangle is forming, and volatility is tightening inside the pattern.
This suggests that a breakout move is imminent, most likely within the coming days (up to a week).
If price breaks to the upside:
potential move towards the upper boundary of the channel around 230.
If price breaks to the downside:
potential decline towards the lower boundary of the channel around 194.
Let’s watch closely for the breakout confirmation.
Best regards 🌹
please note :
this is not financial advice — it reflects only my personal opinion.
PLEASE always do your own research before trading .. Good luck with your trades.
SOL/USDT Technical 4HSOL is currently in a bullish trend, supported by a black ascending trendline that connects recent higher lows.
The price has broken above a key resistance level at $253.17, signaling potential continuation of upward momentum.
The EMA 20 (Exponential Moving Average) is trending upward and closely hugging the price, confirming short-term bullish strength.
Bullish Case:
If SOL holds above $253.17, it could target higher levels such as $260 and beyond.
Continued support from the ascending trendline and EMA 20 suggests buyers are in control.
A retest of $253.17 followed by a bounce would confirm the breakout.
Bearish Risks:
If price fails to hold above $253.17 and drops below $239.14, a correction toward $235.33 is likely. A breakdown below the ascending trendline would weaken the bullish structure and shift momentum.

SOLANA - Bearish Doji reversal or break of $250 round number?Solana has been receiving a lot of positive press (largely from the institutions holding long positions). Whether this will become a self-fulfilling prophecy, will largely depend on the buy-in from retail traders.
Watch the volume indicators to ensure that there is convergence, not divergence, between it and price.
SOL/USDT | SOL Breaks 7-Month High – Still Bullish Above $218!By analyzing the Solana chart on the daily timeframe, we can see that the price is still pushing toward higher targets based on the main analysis. It has reached its highest level in the past 7 months and is currently trading around $225.
If the price holds above the key $218 level, we can expect further growth toward levels above $245. This analysis will be updated again. So far, the return from this setup has been more than 52% — I hope you’ve made the most of it!
Please support me with your likes and comments to motivate me to share more analysis with you and share your opinion about the possible trend of this chart with me !
Best Regards , Arman Shaban

SOLUSDT _ SELL SETUPHey guys 🖐🏻
This is very nice QM setup ,🔻🔻
You can set sell position between 255 _265$

SOL Long SOL setup is massive and unfolding fast.
Previous breakout delivered +600%
Now forming same double-bottom and channel.
$1,000+ isn’t crazy — it’s calculated.

SOL & Memes | Is Solana season here ?From Weekend Hero to Market King
Sol szn is here ? YESS, We are 70% up since our last analysis and recent data strongly suggests we might be entering the early days of SOL mania, Here’s why
1.SOL Outperformed BTC and ETH This Weekend: Solana delivered significantly better returns compared to Bitcoin and Ethereum over the weekend. don't let me compare it with Eth cuz it will break Eth holders Soul
2.Market Cap Milestone: Solana's total market capitalization hit an all time high earlier today, now making up 3.53% of the entire cryptocurrency market with a valuation of $114.3 billion.
3.Dominating Daily Net Inflows: As of now, SOL tops the leaderboard for daily net inflows.
4.Revenue Growth: Last week, Solana’s Real Economic Value (the revenue it generates) doubled its previous all-time high.
5.Meme coins often choose the Solana blockchain for a variety of reasons, primarily due to its unique technical advantages and its growing ecosystem. Here’s why: Low Transaction Costs, High Throughput and Scalability, Fast Transaction Speed, Strong Community and Ecosystem,Developer-Friendly Environment, Early Mover Advantage...
6.Weekend Trading Volumes: Between Saturday and Sunday night, SOL trading volumes surpassed those of all major altcoins.
All of this recent movement is huge for two specific groups of people:
-My wife, who has been worried sick since I told her I invested 100% of my life savings in Solana!
-Our followers, who got worded up on SOL around this time last year and load the dip at 20$
But will these trends hold, especially after ETH and BTC ETFs wrap up their first trading day of the week? Probably not but it’s worth noting how impressive this is, given Ethereum’s market cap is 3.3x larger than Solana’s, and Bitcoin’s is a staggering 16x bigger!
As you can see Sol ready for correction and pullback then it gets ready for Sol Mania

$SOL breakoutbeen waiting for quite sometime for this to break.
taking a good size low lev long on todays close.
invalidation if we get a daily close below the tl, really good r/r to ignore
gl

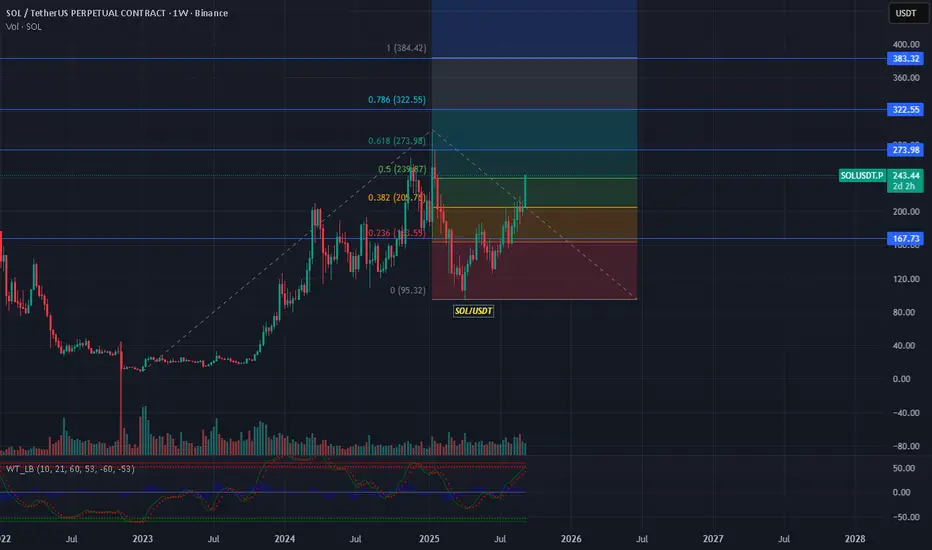
SOL/USDT Weekly Chart Analysis## 📊 Chart Overview
* **Pair:** SOL/USDT (Perpetual Futures, Binance)
* **Current Price:** \$243.44 (+18.01%)
* **Timeframe:** 1W (long-term trend)
* **Volume:** 147.8M (rising, signaling strong participation)
* **Indicators:** Fibonacci retracement, WaveTrend oscillator
---
## 🔑 Fibonacci Levels (swing low \$95.32 → swing high \$384.42)
* **0.236 Fib:** \$163.55 → strong support, successfully defended.
* **0.382 Fib:** \$205.87 → breakout level, now acting as support.
* **0.5 Fib:** \$239.87 → current zone, SOL is testing this level.
* **0.618 Fib:** \$273.98 → next resistance if \$240 holds.
* **0.786 Fib:** \$322.55 → heavy resistance zone.
* **1.0 Fib:** \$384.42 → previous high, potential long-term target.
---
## 📈 Price Action
* SOL has **broken above the \$205 level** and is now consolidating near **\$240**.
* The weekly breakout candle suggests **renewed bullish momentum**.
* Higher lows since the \$95 bottom show a **reversal structure** forming.
---
## 📉 Indicators
* **WaveTrend Oscillator (WT):**
* Currently moving upward, showing **bullish momentum**.
* Entering overbought territory, so short-term corrections are possible.
* **Volume:**
* A surge in weekly volume confirms **strong buying interest**.
---
## 🧭 Outlook
* **Bullish Case:**
* Sustained move above **\$240** opens targets at **\$274 → \$322 → \$384**.
* If momentum extends in a bull cycle, the Fibonacci extension could take SOL toward **\$500–\$560**.
* **Bearish Case:**
* If rejected at \$240–\$245 zone, price may retest **\$205**.
* Failure to hold \$205 could drag it back to **\$167** support.
---
## ⚠️ Risk Note
* SOL is at a **critical mid-Fib level (0.5 zone)**, which often acts as a **decision point**.
* Weekly close above \$240 will confirm strength, but if it fails, downside correction risk rises.
* Always track Bitcoin’s movement since SOL is highly correlated.
---
✅ **Summary:**
SOL is in a **bullish breakout phase**, reclaiming the \$240 zone. Holding above this level can accelerate a rally toward **\$274–\$322**, while failure may bring a pullback to **\$205–\$167**.
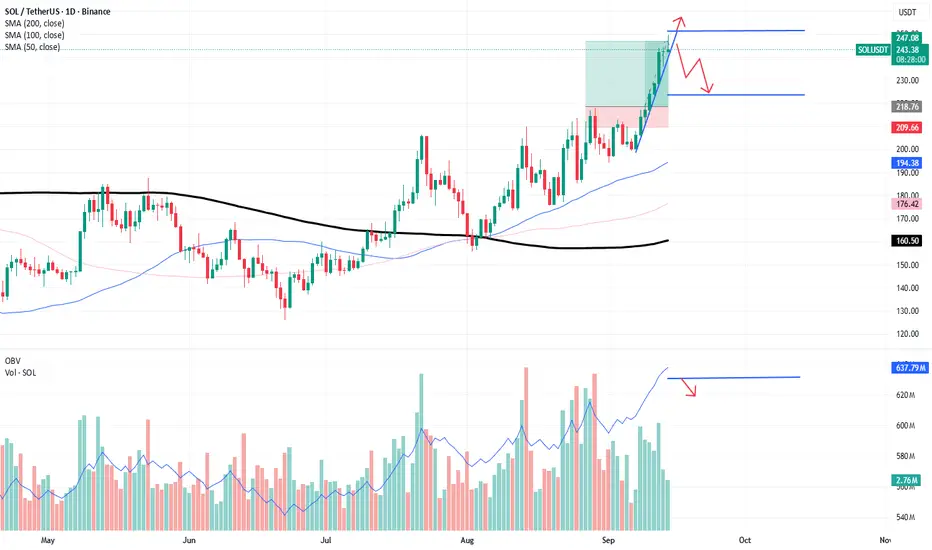
SOL 1D – Breakout in Motion, Next Stop $263.9 LiquiditySolana has confirmed a breakout above the $210–220 retest zone, continuing its strong bullish momentum while holding trendline support and both EMAs.
Upside:
The next major liquidity sits at $263.91, with potential for continuation toward $280–300 if broken and retested.
Downside:
If price rejects $263, a retest of the $210–220 zone would be key for continuation.
Losing that level risks a retrace into the Fib base between $176–164, with $148 as the deeper support.
Stoch RSI remains overbought, but momentum stays strong while structure and EMAs remain bullish.
📊 Key focus: Can SOL extend into the $263 liquidity pool and hold a breakout-retest structure for higher targets?

$SOL has hit all 3 targets on the HOURLY, $212-$224 next?CRYPTOCAP:SOL has just hit its all 3 targets on the hourly chart and currently printing a bearish engulfing candle, so a reversal here is pretty likely.
Also falling volumes on this current last 5/5 Elliot's Wave so not a good time to be starting longs, some profits has to be taken as far as I'm concerned, you always do you👽💙

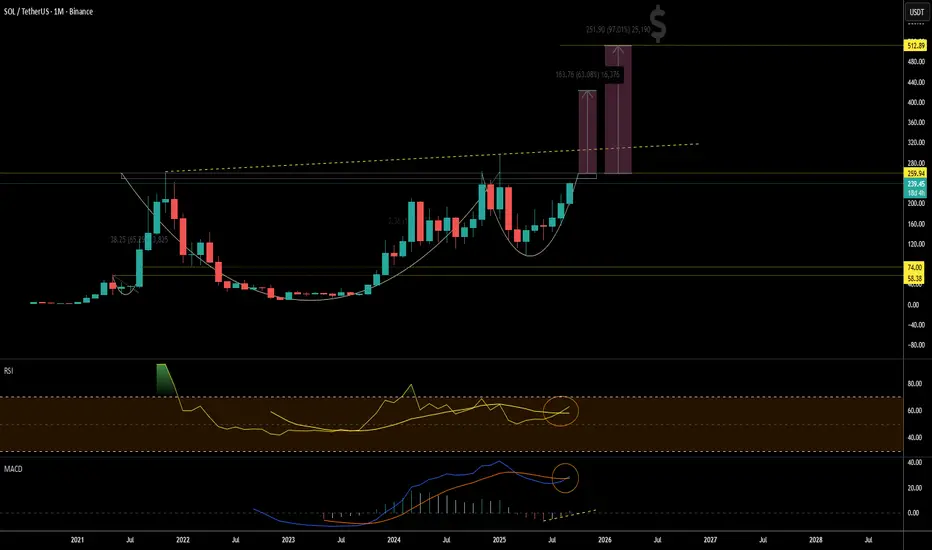
MONTHLY $SOL CHARTBeautiful chart with strength accompanied by several indicators that act to drive the value of this crypto asset above the current price. "Technical analysis"
The way the market grows, I see this target close to reaching.
SOL BREAKS OUT We can easily see a bullish breakout from SOL/USDT , this is one of the most basic price action where in the coins breakout and retest the upper trendline . Now in the current scenario we are targeting the previous resistance clusters and also bitcoin seems pretty bullish here.

SOLANA (SOL/USDT) – TP: 170 - 252 & 295SOLANA (SOL/USDT) is currently trading at $130.17 after rebounding from a well-defined sell-side liquidity zone between $98 and $131. The recent weekly candle shows a strong bullish recovery (+22.93%), suggesting that liquidity has been swept and buyers are stepping in. This level has historically served as a key accumulation zone, and the bounce aligns with oversold conditions on the StochRSI, which is now curling upward — indicating growing bullish momentum. If price sustains above the $125–131 level, the next immediate upside target lies between $170 and $188, where prior supply and consolidation occurred. A confirmed breakout above this range opens the path toward a higher resistance zone between $254 and $295 — a region that aligns with unfilled inefficiencies and previous price distribution.
The ideal swing trade approach would be to enter on a pullback within the $110–125 range, set a stop loss below $98, and scale out at the $170 and $254 levels. This setup offers a favorable risk-to-reward ratio of approximately 1:3.5.
Trade Strategy Suggestion (Swing or Positional):
Entry: Ladder between $115–$125 on retrace
SL: $105–110 (below wick low)
TP1: $170–188
TP2: $254–295
Scaling Out: 50% at TG1, rest at TG2 or trail stops above $200
With macro tailwinds like renewed interest in Solana’s DeFi and meme coin ecosystems, institutional flow returning, and technical confirmation across multiple timeframes, this could be a high-conviction mid-term play for swing traders and positional investors alike.
🔮 Narrative & Fundamentals:
ETH L2 congestion → SOL gets transactional inflows
SOL’s DeFi, NFT, and memecoin activity resurging (e.g., SEED_WANDERIN_JIMZIP900:WIF , SEED_DONKEYDAN_MARKET_CAP:BONK ecosystem)
Institutional flow picking up (Grayscale SOL trust rallying)
SOL remains one of the fastest L1s with growing developer traction

$SOL hits TRIANGLE target perfectly.. what's next?CRYPTOCAP:SOL on 4-HOUR chart has perfectly hit its main Triangle target of $241 even after having to overcome a bearish Butterfly harmonic pattern.
RSI getting overheated a bit here after hitting 80, and I call these Power Moves into resistance. There were flashing some bearish divergences on OBV and RSI recently so now after hitting the target I would not long from here. Next two-three candle sequence will be decisive after printing an indecision candle.
Bearish engulfing would be a signal to leave long altogether let's see 💙👽

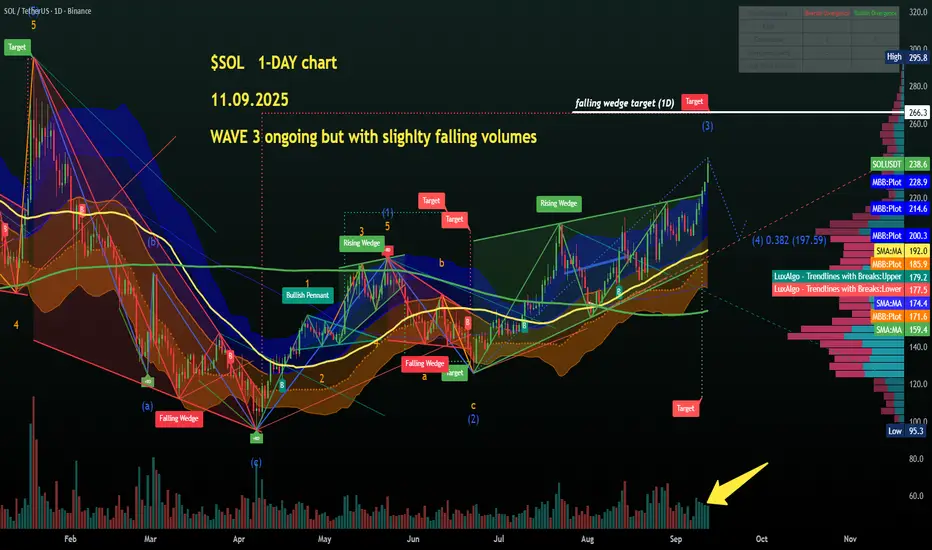
$SOL on 1-DAY chart... has just invalidated a nasty RISING WEDGECRYPTOCAP:SOL on 1-DAY chart has just invalidated that nasty nasty rising wedge pattern that was building from mid-June and impressively failed yestarday, and that's pretty bullish.
Wave 3 in terms of Elliot's Wave count the volumes have been slighly decreasing each day, so imo too late to panic buy but still, it could keep rising as Wave3s often overextend beyond expectations.
Strong chart, green flag for Solana memecoin hunting season, I'm researching the best looking ones currently, will post later on some of them👽💙
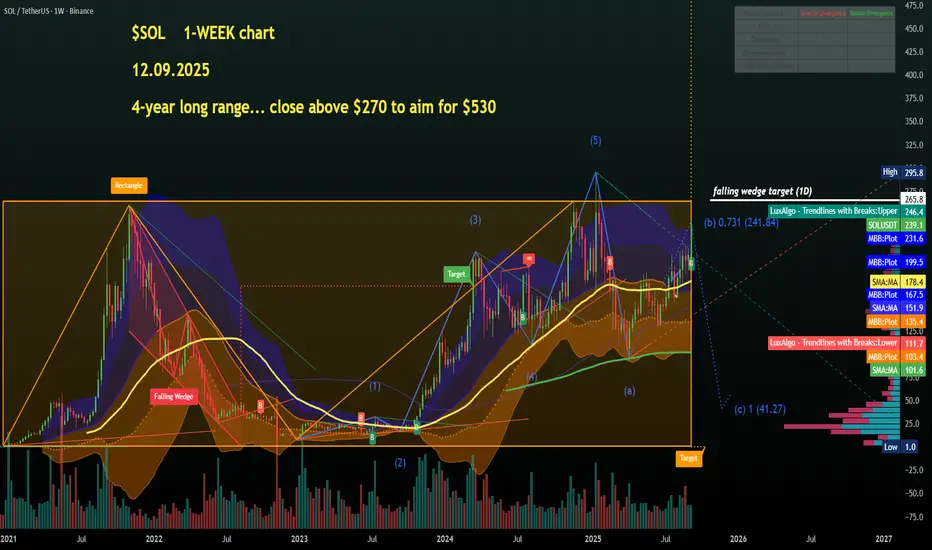
$SOL 1-WEEK chart: 4-year old range... break $270 to aim at $525CRYPTOCAP:SOL top down analysis incoming in my next couple of posts starting from a weekly view.
So, first of all a huge range since the beginning of 2021, let's call that a rectangle pattern giving us a clear long-term breakout level on weekly candle close above $265-$275, the higher the better.
RSI upcurved nicely at 66 so plenty of room to grow in Q4.
From there we would have a target of around $525, not unrealistic. Daily view next💙👽☝️
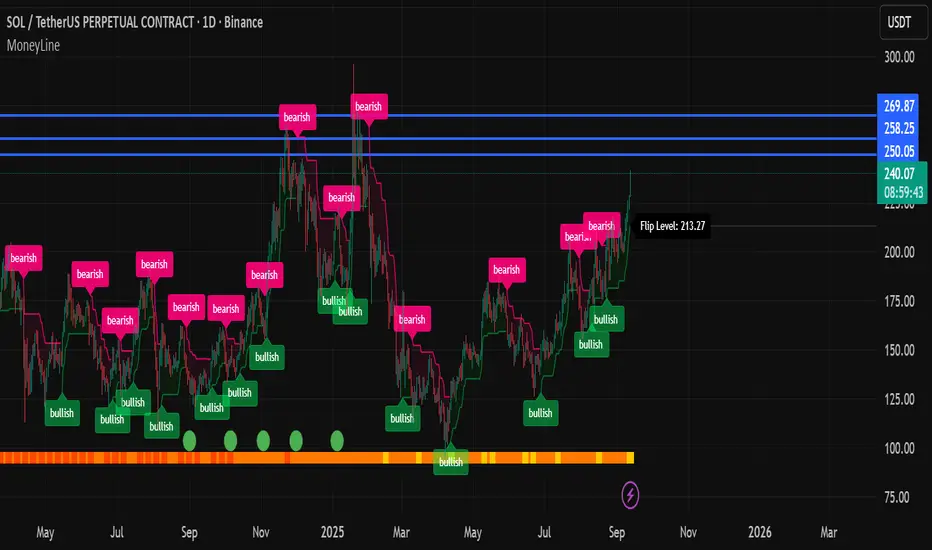
Solana runIn my opinion these three levels for Solana will be very important over the next 24 hours. Hopefully we don't lose momentum over the weekend but it is to be expected. However should we not lose Momentum and breakthrough these levels of resistance anything is possible.
DeGRAM | SOLUSD broke the key resistance level📊 Technical Analysis
● SOL/USD broke above the 224 resistance, confirming strong bullish momentum within the rising channel and sustaining higher lows along support.
● Price action is targeting the 240 resistance zone, with potential extension toward 260 if buyers maintain control.
💡 Fundamental Analysis
● Solana adoption gains traction as its DeFi and NFT ecosystems see fresh inflows, while recent institutional endorsements reinforce long-term demand.
✨ Summary
Bullish above 224; targets 240 → 260. Invalidation on a close below 224.
-------------------
Share your opinion in the comments and support the idea with a like. Thanks for your support!
