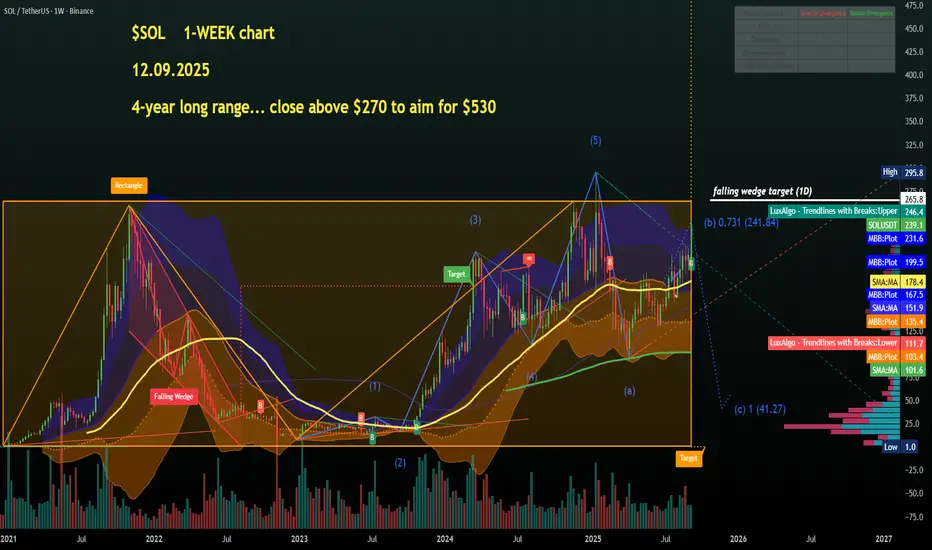
$SOL 1-WEEK chart: 4-year old range... break $270 to aim at $525CRYPTOCAP:SOL top down analysis incoming in my next couple of posts starting from a weekly view.
So, first of all a huge range since the beginning of 2021, let's call that a rectangle pattern giving us a clear long-term breakout level on weekly candle close above $265-$275, the higher the better.
RSI upcurved nicely at 66 so plenty of room to grow in Q4.
From there we would have a target of around $525, not unrealistic. Daily view next💙👽☝️
Trade ideas
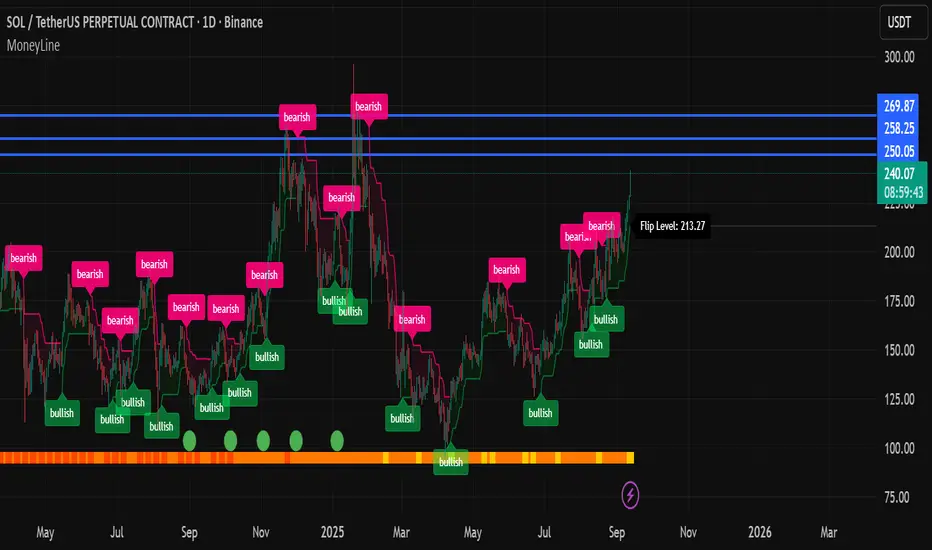
Solana runIn my opinion these three levels for Solana will be very important over the next 24 hours. Hopefully we don't lose momentum over the weekend but it is to be expected. However should we not lose Momentum and breakthrough these levels of resistance anything is possible.
DeGRAM | SOLUSD broke the key resistance level📊 Technical Analysis
● SOL/USD broke above the 224 resistance, confirming strong bullish momentum within the rising channel and sustaining higher lows along support.
● Price action is targeting the 240 resistance zone, with potential extension toward 260 if buyers maintain control.
💡 Fundamental Analysis
● Solana adoption gains traction as its DeFi and NFT ecosystems see fresh inflows, while recent institutional endorsements reinforce long-term demand.
✨ Summary
Bullish above 224; targets 240 → 260. Invalidation on a close below 224.
-------------------
Share your opinion in the comments and support the idea with a like. Thanks for your support!

SOLUSDT Rallies: Heading Towards New HighsSOL is in a strong uptrend, with the support level at 225.00 USD having been tested and held. The price is currently aiming for 250.00 USD, with technical indicators signaling the continuation of this trend. The clear upward trendline and institutional inflows are strengthening SOL's bullish momentum.
Forecast:
If SOL maintains above the 225.00 USD support, there is a high probability it will continue to rise towards 250.00 USD.
Buy SOL when the price retraces to the 225.00 USD support zone.
Set a stop loss below 220.00 USD to protect your capital.
US Unemployment Claims data came in higher than expected, weakening the USD, which provides favorable conditions for SOL to increase in value. Additionally, Forward Industries completed a 1.65 billion USD fundraising deal to build the Solana Treasury, with participation from Galaxy Digital, Jump Crypto, and Multicoin Capital, providing a strong boost for the Solana ecosystem.

DeGRAM | SOLUSD keeps bullish momentum📊 Technical Analysis
● SOL/USD broke above the 220 level, confirming bullish momentum within the rising channel, with price sustaining higher lows along the support line.
● The structure points toward continuation, eyeing 230 first and then 240 as the next resistance zone if momentum persists.
💡 Fundamental Analysis
● Solana’s ecosystem continues to expand, with growing institutional participation and sustained developer activity driving confidence and demand in its blockchain.
✨ Summary
Bullish above 218; targets 230 → 240. Invalidation on a close below 218.
-------------------
Share your opinion in the comments and support the idea with a like. Thanks for your support!

SOLUSDT Drops At Key Resistance ZoneHello there,
SOLUSDT looks bearish at the H1, and the price has the potential to drop to the 204.57 area with a directional bias of 200. Additionally, a change in trend direction to bearish is also indicated by the RSI.
Happy Trading
K.
Not trading advice.

SOL/USDT – The Powerful Wave Isn’t Over YetSolana is showcasing its strength by holding firmly above the 200 USDT psychological level while also being backed by massive inflows, with open interest hitting record highs. This clearly shows strong market confidence in SOL’s breakout potential.
On the 12H chart, the bullish structure remains crystal clear: price is clinging to the trendline, holding above both the EMA34 and EMA89, and bouncing solidly from support zones. The next key destination the market is eyeing is 223 USDT – a crucial resistance. If broken, Solana could easily open the path to even higher levels.
In short, both news and technicals are in sync: SOL/USDT’s bullish momentum is far from over – in fact, it’s gearing up for an even more impressive breakout.

SOLUSDTThis is a bullish setup for BINANCE:SOLUSDT , but the $230 level is crucial for potential reactions. My strategy is to stay bullish and wait for the upcoming US CPI news, then decide whether to buy or sell CRYPTOCAP:SOL based on the news.
⚠️Ensuring your position size aligns with your risk tolerance.


Buy Solana and Change Your Life Solana on track to make the most bullish move ever right now . Minimum $600 . I mean minimum .

SOLUSDT NEW TIMES COMING? Thank you for reading this update.
Solona looks to have a new incoming volume
Will this bring this volume Solana to $100 with time?
This volume depends on day trade and has no guarantees for the long term.

SOL: Long Move Up"
On August 22, I entered a long at $191 on the 1-hour chart, using 20x leverage. The move turned out to be extended: price climbed to $224, four profit-taking levels were reached, but I kept the position open further. A difference of more than $30 per coin delivered a solid result.
The key here was not guessing but consistency. The indicator highlighted the important levels in advance, and I followed the plan step by step. This eliminated impulsive decisions and allowed me to stay calm throughout the entire trade.
When trading is built on structure, even long moves become manageable. The plan makes it clear where to take profit, where to hold, and where to keep a cool head. With high leverage, this becomes critical: risk stays under control, and emotions don’t interfere with decision-making.
The market will always remain unpredictable, but a disciplined approach turns it into a field of opportunities, where results depend not on luck but on the ability to work systematically."

$SOL Finally hit $228 and My Prediction is Done CRYPTOCAP:SOL Finally hit $228 and My Prediction is Done, Next week if Retest and Breakout it will be $333 price in 2026 of Q1, Solana will Archived the price when we are HOLD.
From News, Solana Climbs to $225 as Analysts Predict Strong Year-End 2025 - 2026 Prediction price will hit $333 1st Quarter.
Solana surged to a seven-month high this week, touching nearly $225 as demand from institutions and speculation around ETFS lifted momentum. The token is up 25% in the past month, marking the best performance among the top 10 crypto assets.
Digital asset treasuries have been steadily accumulating Solana throughout 2025. Firms such as Upexi and DeFi Development Corp. each disclosed holdings of over $400 million in the token since January. Forward Industries added fuel to the trend earlier this week, announcing a $1.65 billion private investment in public equity to establish a Solana treasury. The plan, spearheaded by Multicoin Capital's Kyle Samani, could create the largest publicly traded SOL treasury if executed.
ETF applications tied to Solana are also awaiting SEC decisions. Issuers including Bitwise, Canary Funds, and 21Shares have filed proposals, while analysts expect approvals on CRYPTOCAP:SOL , CRYPTOCAP:XRP , and Dogecoin ETFS
sometime in 2025. Market research platforms have taken note of the shifting sentiment. Prediction markets on Myriad now give Solana a 57% chance of reaching a new all-time high this year, up from 23% just weeks ago.
Despite trading about 24% below its January peak of $293.31, Solana's rally has made it one of the strongest performers among major assets. Hougan emphasized that the relative size of Solana compared to Bitcoin and Ethereum means even modest ETF inflows could have an outsized effect on price.
He estimated that Forward's planned treasury allocation, if fully executed, would be equivalent to a $33 billion purchase in Bitcoin terms. With Solana at $221 at press time, investors are closely monitoring whether ETF approvals and treasury expansion will drive the next leg upward.
#Write2Earn #BinanceSquareFamily #Binance #SOL #SUBROOFFICIAL
Disclaimer: This article is for informational purposes only and does not constitute financial advice. Always conduct your own research before making any investment decisions. Digital asset prices are subject to high market risk and price volatility. The value of your investment may go down or up, and you may not get back the amount invested. You are solely responsible for your investment decisions and Binance is not available for any losses you may incur. Past performance is not a reliable predictor of future performance. You should only invest in products you are familiar with and where you understand the risks. You should carefully consider your investment experience, financial situation, investment objectives and risk tolerance and consult an independent financial adviser prior to making any investment.
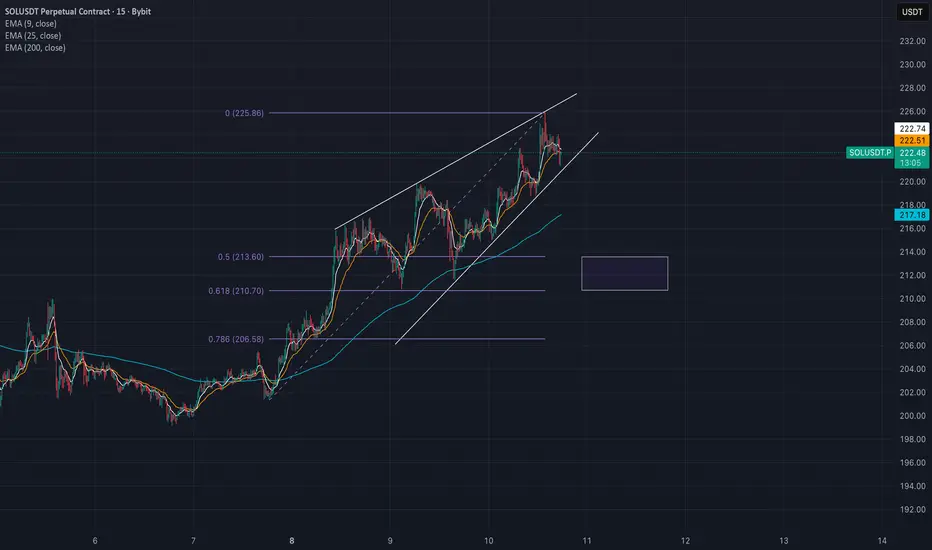
#SOL/USDT → Stronger than the market. Correction before growth#SOL
The price is moving within a descending channel on the 1-hour frame and is expected to break and continue upward.
We have a trend to stabilize above the 100 moving average again.
We have a downtrend on the RSI indicator that supports the upward move with a breakout.
We have a support area at the lower boundary of the channel at 207, acting as strong support from which the price can rebound.
We have a major support area in green that pushed the price upward at 205.
Entry price: 210.
First target: 214.
Second target: 219.
Third target: 225.
To manage risk, don't forget stop loss and capital management.
When you reach the first target, save some profits and then change the stop order to an entry order.
For inquiries, please comment.
Thank you.

Solana (SOL): Heading For $280 Resistance | BullishCRYPTOCAP:SOL finally broke out of local resistance around $210 and is now pushing higher with strong bullish momentum. Buyers continue to respect the ascending trendline, confirming the structure.
As long as this momentum holds, the next major target remains at $280.
Swallow Academy

DeGRAM | SOLUSD above the $200 level📊 Technical Analysis
● SOL/USD is trading within a well-defined ascending channel, holding above the 189–190 support zone and building higher lows that reinforce bullish structure.
● The current move targets the 226–230 resistance, with the rising parallel channel supporting further gains as long as price remains above 189.
💡 Fundamental Analysis
● Solana’s DeFi TVL has grown over 20% in August, driven by fresh institutional inflows, while its ecosystem expansion (notably in gaming and payments) strengthens adoption.
✨ Summary
Bullish above 189; breakout continuation eyes 226 → 230. Invalidation below 189.
-------------------
Share your opinion in the comments and support the idea with a like. Thanks for your support!
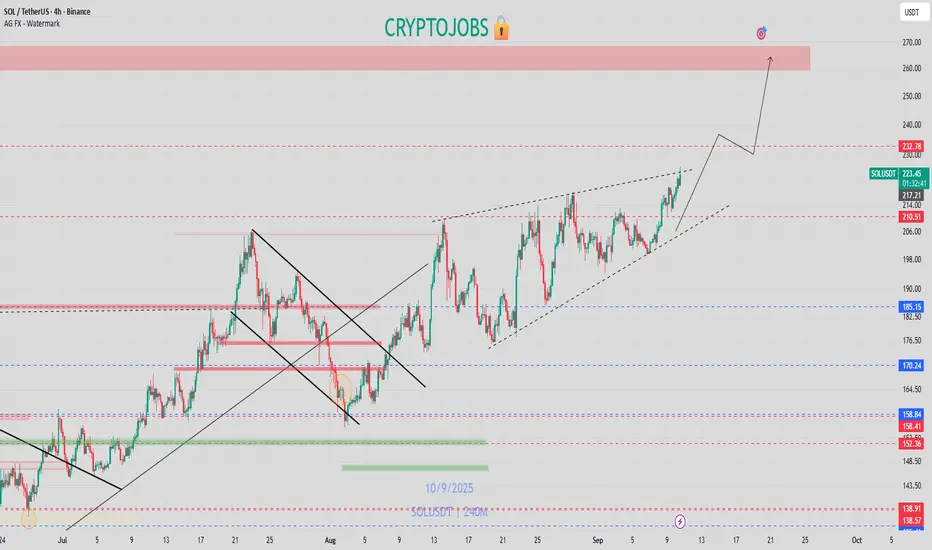
Solana Wave Analysis – 10 September 2025
- Solana broke the resistance area
- Likely to rise to next resistance level 230.00
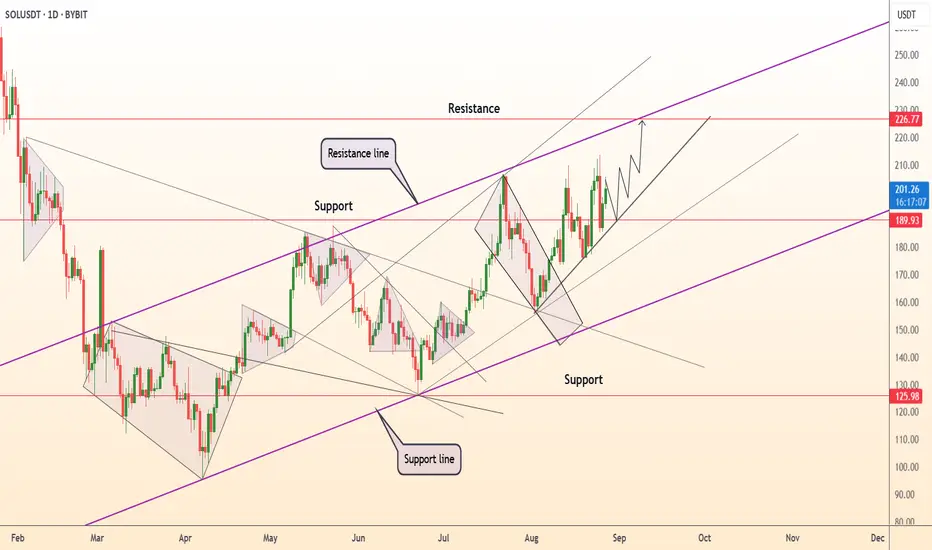
Solana cryptocurrency recently broke the resistance area between the resistance level 214.5 (which has been steadily reversing the price from February) and the resistance trendline of the daily up channel from April.
The breakout of this resistance area accelerated the active impulse waves iii and 3 of the higher impulse wave (3) from June.
Given the clear daily uptrend, Solana cryptocurrency can be expected to rise to the next resistance level 230.00.

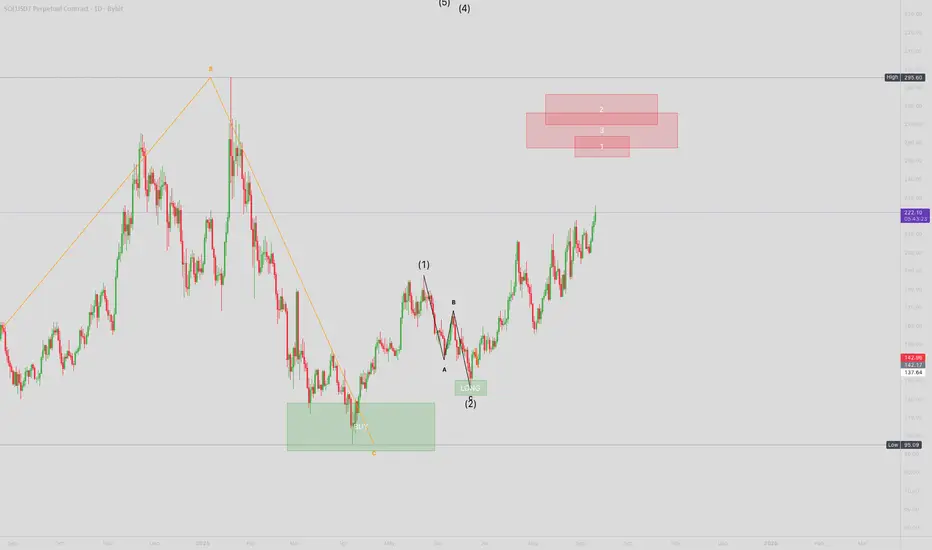
Bullish Scenerio SOL - 1D Time FrameAfter ending global 1-2 I'am expecting the 3rd. We are in this 3rd right now building lower degree structures like this 1-2 shown above. The target of internal third are shown as a red boxes.
SOLLocally we must see the correction, I`ve mentioned area where I expect to see Sol by tomorrow. NFA - DYOR
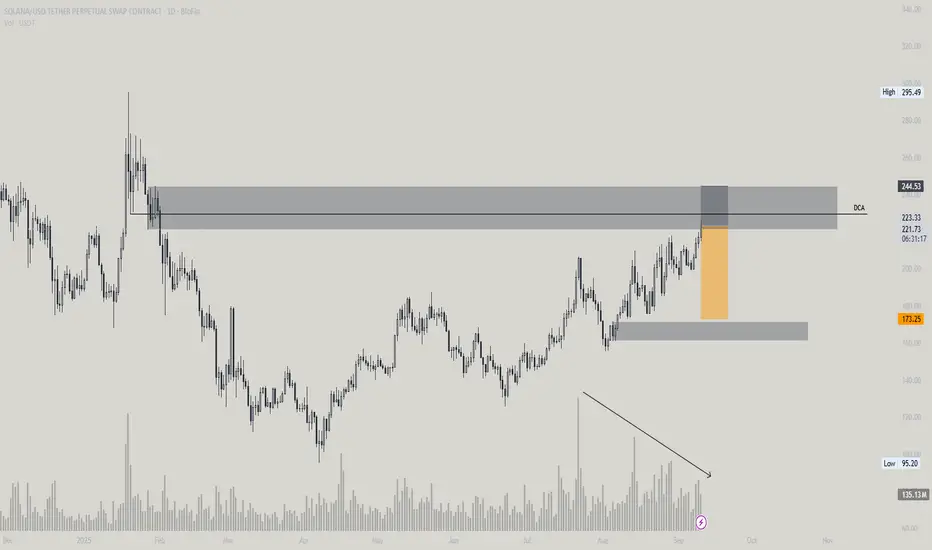
Swing Shorting SolanaShorting BLOFIN:SOLUSDT.P at $220.72 with one DCA limit order at $229.65.
Price is approaching resistance with declining volume, which is usually not a good sign.
I am targeting the liquidity zone in the low $170s.
SOL Ready to RIPSolana has been demonstrating notable resilience in recent sessions, consistently finding support along a well-defined local uptrend visible on the 1H, 2H, and even 4H timeframes. The $200 level continues to serve as a critical inflection point, acting as both historical support and resistance, with price repeatedly testing but struggling to establish firm acceptance above this zone.
That said, with Ethereum showing renewed strength and capturing market attention, we could begin to see capital rotation into other leading altcoins as investors look for relative value and potential catch-up plays. This type of market dynamic often precedes what many refer to as “alt season,” when capital flow broadens beyond Ethereum and Bitcoin, sparking accelerated moves across the broader crypto market.
Whether this backdrop evolves into the explosive breakout traders are anticipating remains uncertain—but the stage appears to be set. As always in these markets, conviction must be balanced with patience, as only time will ultimately reveal whether the momentum materializes into the massive move so many are hoping for.

$SOL - ASCENDING ACCUMULATIONCRYPTOCAP:SOL - Ascending accumulation!
Strong uptrend daily; Bullish breakout awaited! 📈
Upper key resistance: 266 - 270$
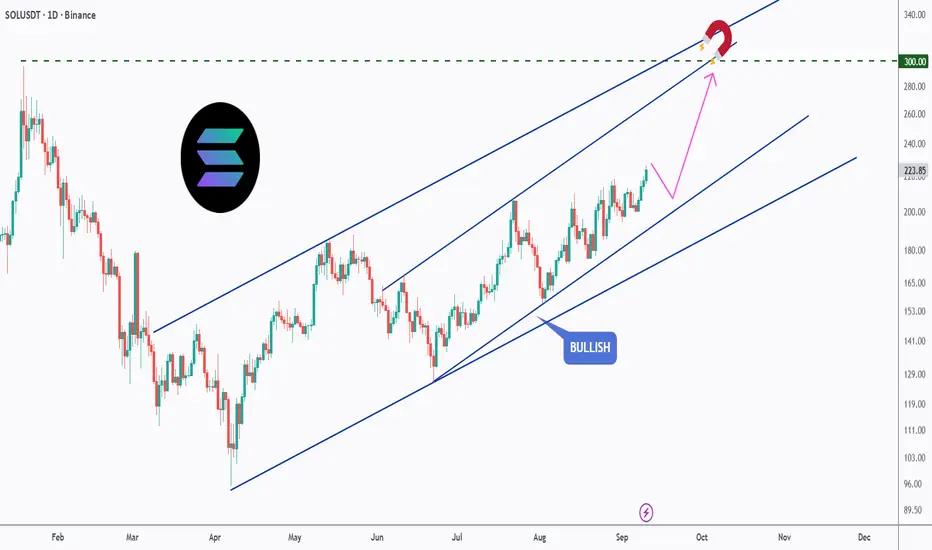
SOL’s Magnetic Path to $300!Solana has been steadily climbing inside a clean bullish channel, and the momentum is showing no signs of slowing down. The price action continues to respect higher highs and higher lows, keeping the bullish structure intact.
🟢 Bullish Channel: SOL is trading neatly within an ascending channel, confirming the trend’s strength.
🎯 Key Target: The $300 level acts as a magnet — a psychological resistance aligning with the channel’s upper boundary.
🔄 Healthy Pullbacks: Any short-term dips within the channel are being absorbed quickly, signaling strong buyer interest.
🚀 Upside Outlook: As long as SOL holds within the channel, the path of least resistance remains to the upside, with $300 as the next major milestone.
📌 Eyes remain on whether Solana can reach the $300 mark before the year’s end.
This is for educational purposes only, not financial advice. Always manage risk properly before trading.
📚 Stick to your trading plan regarding entries, risk management, and trade execution.
Good luck!
All Strategies Are Good; If Managed Properly!
~Richard Nasr