SOL 4H – Pullback to Demand, Next Leg Up?Solana’s 4H chart shows a sharp pullback from the 205–215 resistance zone, with price eyeing the short-term demand at 180–185, aligned with the ascending trendline. A bounce here could set up another test of the upper resistance, while a break lower risks a deeper drop toward the 175 major demand zone. Stoch RSI sits mid-range, leaving room for momentum to swing either way.
Trade ideas

SOLUSDT ling term"🌟 Welcome to Golden Candle! 🌟
We're a team of 📈 passionate traders 📉 who love sharing our 🔍 technical analysis insights 🔎 with the TradingView community. 🌎
Our goal is to provide 💡 valuable perspectives 💡 on market trends and patterns, but 🚫 please note that our analyses are not intended as buy or sell recommendations. 🚫
Instead, they reflect our own 💭 personal attitudes and thoughts. 💭
Follow along and 📚 learn 📚 from our analyses! 📊💡"

Sol/usdt - shortShort SOL/USDT for a 20–25% drop into September, then flip long to target the weekly gap at $215–$225 and aim for a new all-time high.
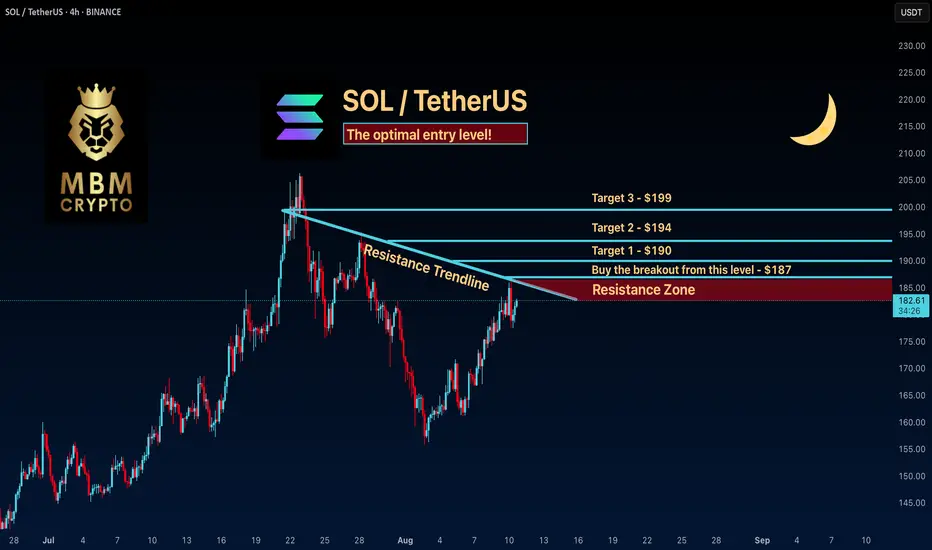
SOL: The optimal entry level!Trading Setup
If you’re considering trading SOL, here’s a quick setup that may help you.
The idea is: Buy when the price breaks above $187 and take profits at the levels shown in the chart.
Targets:
1. $190
2. $194
3. $199
-------------------------------------------
About our trades:
Our success rate is notably high, with 10 out of 11 posted trade setups achieving at least their first target upon a breakout price breach (The most on TW!). Our TradingView page serves as a testament to this claim, and we invite you to verify it!
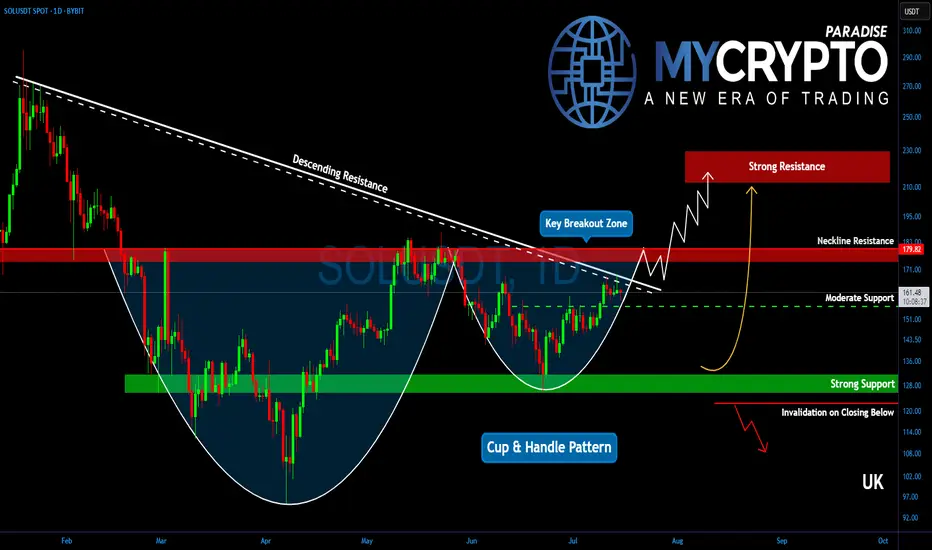
Will Solana Explode? This Important Zone Could Trigger a MoveYello, Paradisers! Is #Solana about to break free into a new bullish wave? After months of struggling under key resistance, the bulls are finally making a serious push… but only one zone stands between SOL and a potential explosion.
💎After peaking in January, Solana has remained suppressed under a descending trendline. But now, that trendline is being challenged aggressively, and the price structure is starting to form a reversal pattern that demands attention.
💎Right now, the most important level on the chart is the descending channel resistance at $167. Bulls are actively testing this zone, and if they manage to flip it into support, it could trigger a significant shift in momentum. But just above, at $180, sits an even more critical barrier, the neckline of the current reversal pattern. This entire region between $167 and $180 is the true battleground.
💎#SOLUSDT's confirmed breakout above $180 would be a major technical signal. It would likely send Solana toward the $210 to $225 zone, which marks a significant resistance area. This isn’t just psychological; it also aligns with the 61.8% Fibonacci retracement, a level where institutional players often begin offloading positions
💎As for the downside, support remains solid between $155 and $160. This region is protected by both horizontal demand and dynamic support from key moving averages, offering bulls a stable base to defend. Adding to the bullish case is a potential golden cross formation between the EMA-50 and EMA-200, a signal that, if confirmed, could inject even more confidence into Solana’s price action.
Paradisers, strive for consistency, not quick profits. Treat the market as a businessman, not as a gambler.
MyCryptoParadise
iFeel the success🌴
a great Bullish wave waiting for uswe are in here if the 210 resistance break next target 216 230 and heavy resistance reach heavy resistance is 260 rsi in weekly is show 59 and not reach to overbough zone its possible in 2 days later solo reach 230 or 238 what you think if could breack that go to 268 what you say?? we are in great week

$SOLANA LONGHow amazing it is when you’re able to spot a move and watch it out.
This BYBIT:SOLUSDT.P trade is on 1:7RR.
This is the system that helps you recover as a trader.
Imagine after one or two losses and you hit this kind of move, it’s a complete blessing!!!

SOL.USDTWith the monthly resistance near $200 broken, we expect Solana to soon move towards a new high near $420.

Solana Trades Above $200: New ATH Revealed, Next Target & MoreSolana has been consolidating within a very wide range since February 2024. Solana ended its bear market December 2022. The market bottom was followed by a quick bounce and accumulation phase at low prices.
A 280 days long consolidation (Dec 2022 - Oct 2023) produced a rise from $20 to $210 ending March 2024. From this point forward we have a new long consolidation period but this time instead of 280 days SOLUSDT has been ranging for 525 days. Imagine how strong the next advance will be.
280 days of consolidation was enough to produce 10X growth.
Solana produced a low recently in April and has been recovering since. Prices from late February 2024 through present day form part of a sideways consolidation channel. This period is reaching its end.
The last low marked the end of this period and the start of the next bullish wave. This bullish wave is ongoing now and soon Solana will break local resistance and hit a new all-time high.
Right after the all-time high the first resistance zone of importance is $415 ($420 in some cases). Next we have $667 ($620 in some cases) and these are the levels to watch.
Current market conditions support a rise on SOLUSDT reaching $900 - $1,100.
Soon we will know if the market can continue even higher. For now these are the targets for this 2025 bull market. We are only weeks away from a major frenzy.
Namaste.

SOL - 4H Elliott Wave Analysis - 13.08.25Greetings, today we are going to update our Elliott Wave Count for Solana!
Firstly, I wanted to thank you for all the boosts on our last Solana Analysis, appreciate it!
Solana did pull off an amazing rally in our blue Wave 5 which presumably is finished with that we have our green Wave 1 in. We are looking for a pullback to happen in our green Wave 2 soon.
The Wave 2 support area lies between the 0.382 FIB at 186.19 USD and the 0.786 FIB at 166.34 USD. If the price moves a few dollars higher the Wave 2 support are would just shift slightly up with it.
A break below this support area would indicate a reset of the white Wave 2 in a bigger correction which we deem unlike at this stage. Additionally the move up touched the 0.886 FIB which increases probabilities to take the previous high over the last low.
Thanks for reading.
NO FINANCIAL ADVICE.

SOL Silently Grinding Toward New Highs⚡️ Time to update one of my SOL ideas and see how things are looking.
The closer ETH gets to its ATH, the harder it becomes to push it higher — and attention starts shifting to its L2s and, of course, SOL. Over the past few days, SOL has been growing steadily. On top of that, the first-ever staking ETF in crypto history was launched for SOL — something that definitely won’t go unnoticed once the ETH madness cools down.
➡️ The first thing that stands out is the current price action. SOL has come right up to a large gap at $238–205.6. It’s already been rejected from this zone once and is now testing it for the second time. If it manages to break inside, price could move smoothly to around $216.72, since it’s a gap zone with no other resistances.
➡️ Next, Volume — we can see a divergence in buying volume, indicating a decline in buyer interest. True, ETH and BTC also moved higher on declining volumes until they approached levels near their peaks, where huge volumes kicked in. So, we could see the same pattern here. Plus, it’s no secret ETH is still at the center of attention, taking all the liquidity for itself.
➡️ Money Flow — here we see strong harmony with price, meaning liquidity is still flowing steadily into the asset, which is definitely encouraging.
📌 Conclusion:
For now, SOL is still outside the spotlight, and its trading volume barely keeps it in the daily top 10. But it’s quietly grinding toward its highs — and once the ETH hype fades, everyone will suddenly remember: “Guys! We have the first-ever staking token! And it’s also a blockchain that’s been number one in profits for months!”
By then, however, it might be too late. Because we’ve already been in the game for a while.

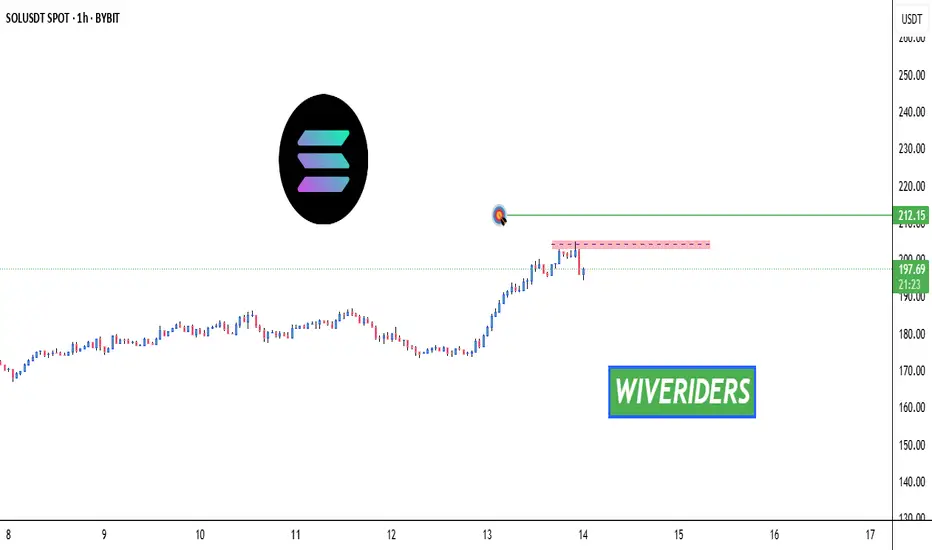
SOL Breakout Watch – Testing Key Resistance! 🚨 SOL Breakout Watch – Testing Key Resistance! 🔴⏳
SOL is testing the red resistance zone right now.
📊 If a breakout confirms, the next move could target:
🎯 First Target → Green line level
A strong breakout here could open the door for further bullish momentum.
Market Update for SolanaIt’s only Wednesday, and BINANCE:SOLUSDT has already hit all our targets, entering the 201–213 zone we’ve been expecting — but so far, it has only reached 204 .
As you can see, ADX climbed to 60 and reacted, while RSI is dropping sharply amid a bearish engulfing pattern. I’m expecting a local correction, which is why I’ve already closed my Solana longs.
The correction could bring the price into the 186–192 range. I’ll be watching closely, as I still expect growth to continue toward our target zone of 201–213 afterward.

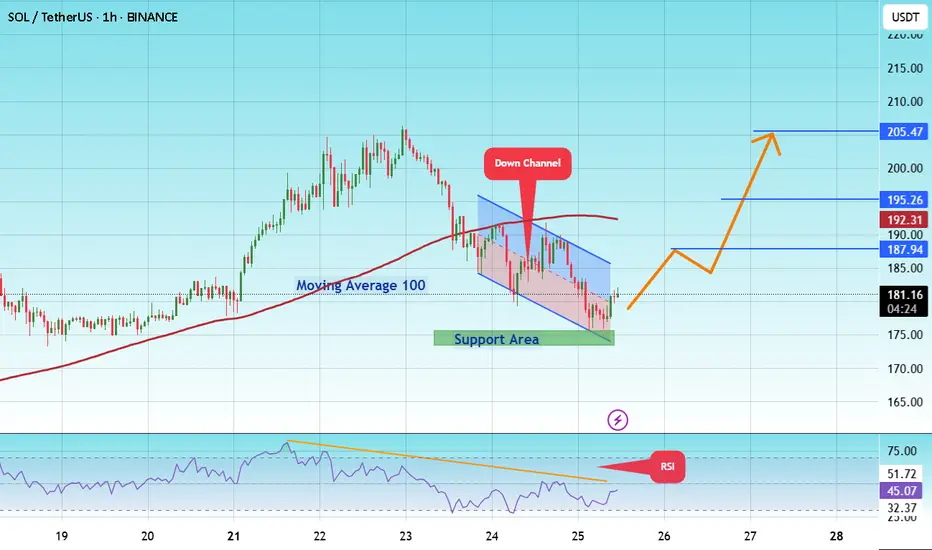
#SOL/USDT coin market structure analysis#SOL
The price is moving within a descending channel on the 1-hour frame and is expected to break and continue upward.
We have a trend to stabilize above the 100 moving average again.
We have a downtrend on the RSI indicator that supports the upward move with a breakout.
We have a support area at the lower boundary of the channel at 175, acting as strong support from which the price can rebound.
We have a major support area in green that pushed the price upward at 174.
Entry price: 181.
First target: 187.
Second target: 195.
Third target: 205.
To manage risk, don't forget stop loss and capital management.
When you reach the first target, save some profits and then change the stop order to an entry order.
For inquiries, please comment.
Thank you.

SOLANA Potential Bullish Breakout OpportunitySolana seems to exhibit signs of a potential Bullish Breakout on the Shorter timeframes as the price action may form a credible Higher High with multiple confluences through key Fibonacci and Support levels which presents us with a potential long opportunity.
Trade Plan:
Entry : CMP
Stop Loss : 172
TP 1: 202.5

DeGRAM | SOLUSD updated the rising low📊 Technical Analysis
● SOLUSD is advancing within a steepening channel, holding above 186.5 after reclaiming mid-channel support and setting sights on the 216.2 resistance zone.
● The structure shows higher lows and accelerated momentum, with potential to challenge the upper boundary near 225 if current trendlines hold.
💡 Fundamental Analysis
● Solana’s recent integration with Fireblocks’ institutional staking service is driving positive sentiment, while on-chain activity in DeFi TVL has surged over 15% this month.
✨ Summary
Bullish above 186.5; targets 216.2 → 225. Invalidation on a close below 186.5.
-------------------
Share your opinion in the comments and support the idea with a like. Thanks for your support!

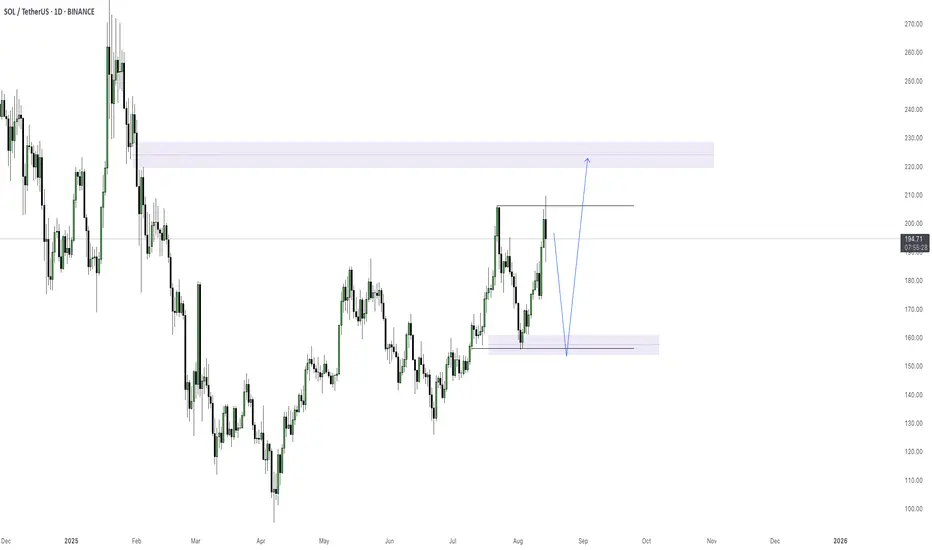
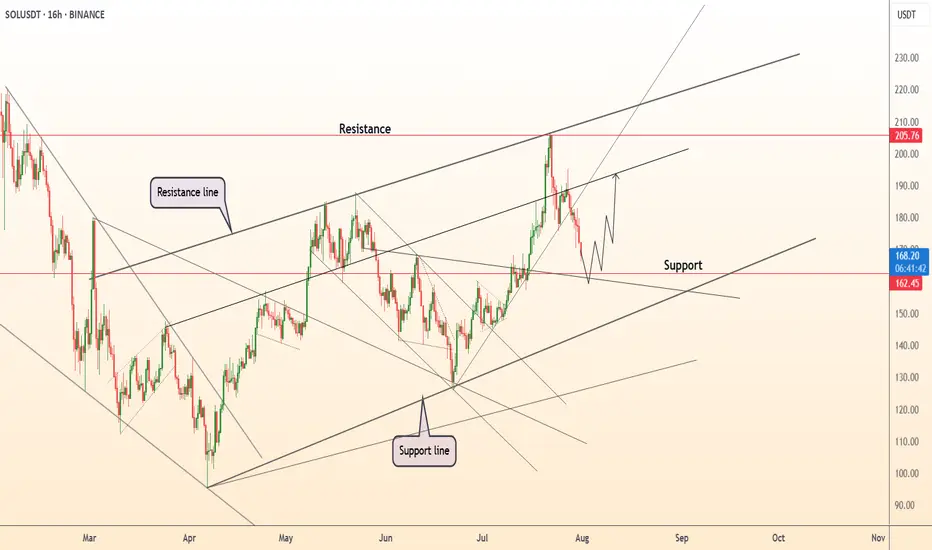
DeGRAM | SOLUSD will test the support level📊 Technical Analysis
● SOLUSD is pulling back after testing the upper resistance channel near 205 and is now approaching key support at 162.5, aligning with the breakout zone.
● Structure remains bullish as price respects the midline of the ascending channel, and upside continuation toward 205 remains likely if 162 holds.
💡 Fundamental Analysis
● Solana remains a top performer in weekly ETP inflows, per CoinShares, and continues to dominate in NFT volume and developer activity.
● Funding remains positive across major derivatives platforms, signaling sustained bullish sentiment despite short-term volatility.
✨ Summary
Long bias above 162. Breakout target remains 205 ▶ 220. Setup remains valid while above key structure support.
-------------------
Share your opinion in the comments and support the idea with a like. Thanks for your support!
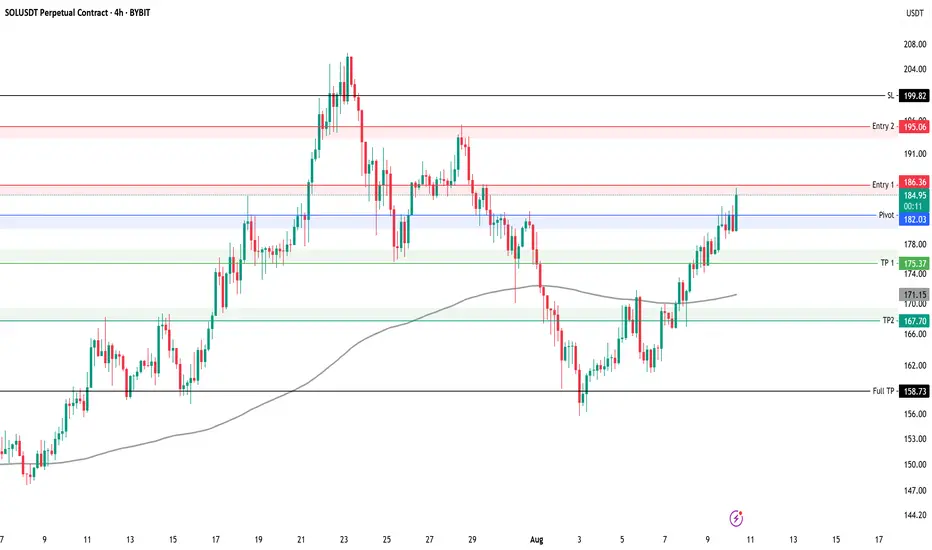
SOLUSDT Short Key levels to watch for SOLUSDT 4H
We have taken first entry on this setup using 0.5% risk
Risk per entry 0.5%
Entry 1: 186
Entry 2: 195
TP 1: 175
TP 2: 167
Full TP: 158
SL: 199
Always manage your own risk. None of the above is financial advice.
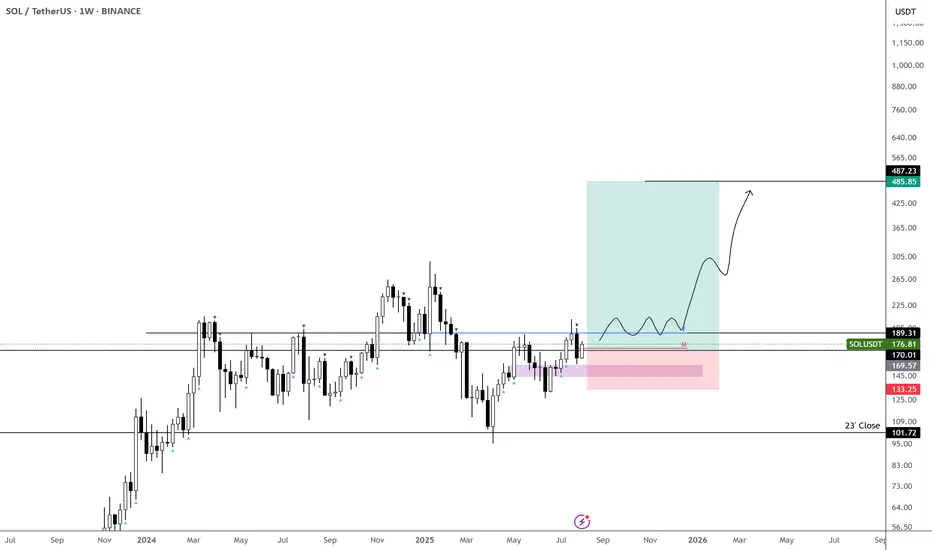
SOLUSDT Holding Long Term Trendline SupportSOLUSDT continues to show strong bullish structure, with price consistently holding above a multi-year ascending trendline a key structural element that has defined its uptrend. This dynamic support has anchored price action within a broader ascending formation, reflecting steady long-term accumulation.
Additionally, the chart reveals a well defined Cup and Handle formation, further reinforcing the bullish outlook. As long as price respects the immediate demand zone, this area remains a prime region for re-accumulation, with expectations for it to hold as a firm support level.
The projected target for this setup is clearly illustrated on the chart, aligning with the broader bullish continuation narrative.
Share your view, do you see SOLUSDT pushing higher from here, or is a deeper retest likely before the breakout?

It’s Been a While... $SOL is back!
CRYPTOCAP:SOL has been stuck in a 100–200 range for a while now, with anything outside acting as a liquidity grab before reversing.
Back in March, the market was trying to print a bearish signal (obviously failed), so I didn’t have a clear picture then. Now, it’s back on track.
The monthly isn’t as satisfying as other charts—candle lacks strength and closed below the yearly open. That said, price just tapped the $100 range low, so naturally the next big expectation is a break above $200 with conviction and new highs.
I don’t think CRYPTOCAP:SOL will be the highlight of crypto this cycle, but there’s still a potential 2x from here worth taking advantage of.
Smart money levels for $SOLUSDT, don't miss this zoneSolana continues to respect its long-term rising support line, showing strong underlying strength.
After a solid accumulation phase in early 2023 that led to a sharp rally, SOL is now in another accumulation zone just below its all-time high of $296.
A clean breakout from this range could set the stage for a major move into uncharted territory.
DYOR, NFA

SOLANA SEASON - PUMP TO 600$This analysis shows that Solana is pumping to it's ALL-TIME HIGH in this ALTCOIN SEASON!
SUBSCRIBE, BOOST AND COMMENT IN ORDER TO GET HIGH QUALITY TECHNICAL ANALYSIS.
Firstly, our Algo-based indicators are used to create this analysis.
