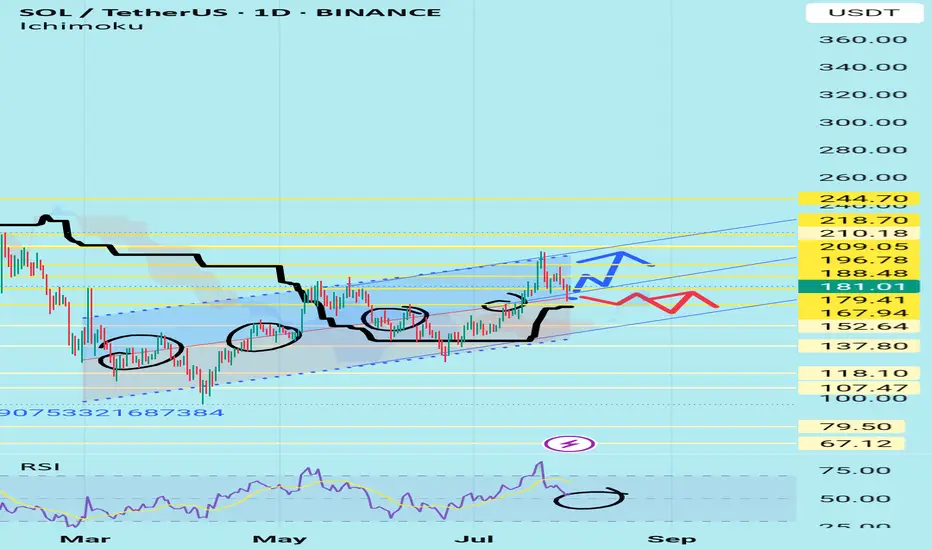
Solana Update · Retrace, Bears & The Bullish BiasSolana had a retrace in May. Notice the 19-May date on the chart. This retrace produced four weeks red. The bullish move that led to this retrace lasted 6 weeks. The last rise lasted five weeks and the current retrace might last only two weeks, can be less.
We are seeing Solana rising but this rise is not a one-time off event, this is a trend that is developing. An uptrend as a long-term phenomena is different to a short-term bullish moves. A short-term move tends to be really fast, one strong burst and that's it. A long-term move is different. Instead of seeing 2-3 candles and Solana trading at $1,000, we see dozens and dozens of candles with prices slowly rising. There are strong fluctuations but the end result is always up. And that's how you see the fluctuations on the chart.
Solana moved up and then immediately started to retrace. Then another rise and another retrace again. This retrace will end and prices will continue to grow long-term. The bulls are in. The bull market is on. Solana, Bitcoin, Crypto and the rest of the Altcoins market is going up.
Namaste.
Trade ideas

SOL/USDT: High-Probability Long from Major Support OversoldHello traders,
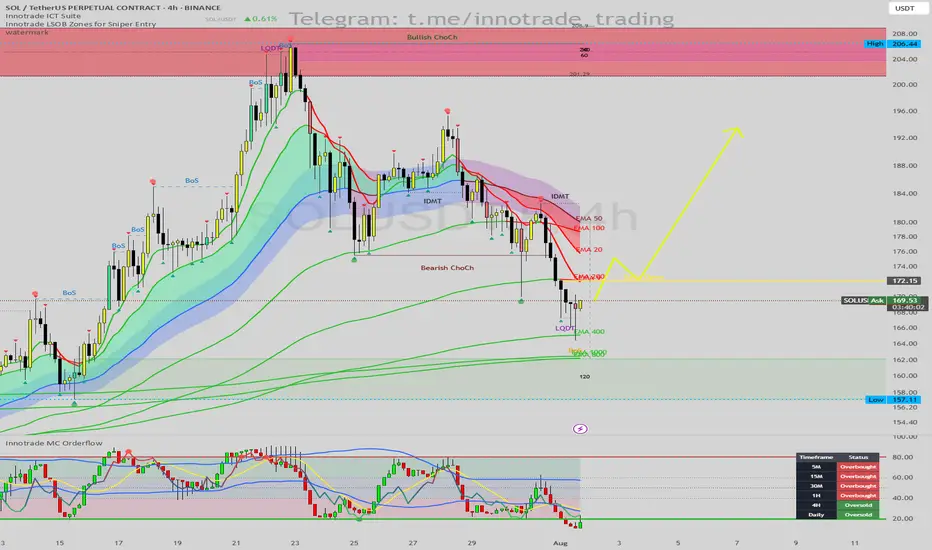
Here is a detailed analysis for a potential long setup on SOL/USDT (4H Chart). This trade idea is based on a strong confluence between my LSOB price action indicator and the MC Orderflow momentum oscillator.
1. Trend & Context (The "Why")
The overall structure on the 4H chart has recently shifted bearish, confirmed by a Bearish Change of Character (ChoCh). However, the price has now pulled back into a major area of interest where a bullish reversal is highly probable.
Here are the key confluence factors for a long entry:
Major Support Level: Price is currently reacting to the EMA 400, a significant long-term moving average that often acts as strong dynamic support.
Liquidity Sweep: We have a clear Liquidity Sweep (LQDT) below the recent lows, which is a classic institutional tactic to grab stop losses before a potential move in the opposite direction.
Momentum Exhaustion (MC Orderflow): This is the most crucial confirmation.
The MC Orderflow oscillator is deep in the OVERSOLD territory (below 20), signaling that downside momentum is exhausted.
The MTF Cycle Table provides powerful confirmation: both the 4H and Daily timeframes are showing an "Oversold" status. When higher timeframes align like this, the probability of a reversal increases significantly.
2. Entry, Stop Loss, and Targets (The "How")
While the signals are strong, a disciplined entry strategy is key.
Entry: Look for an entry around $168 - $170. A safer confirmation would be waiting for the MC Orderflow oscillator to cross back above its yellow moving average.
Stop Loss (SL): $165.50. This places the stop just below the wick of the recent liquidity sweep, invalidating the trade idea if that low is broken.
Take Profit (TP) Targets:
TP1: $178.00 (Confluence of the Bearish ChoCh level and the 50/100 EMAs).
TP2: $192.00 (Targeting the next significant swing high/resistance area).
TP3: $202.00 (Long-term target at the major LSOB supply zone).
Conclusion
This setup presents a favorable risk-to-reward opportunity. The combination of a price action liquidity sweep into major MA support, confirmed by extreme multi-timeframe oversold readings on the MC Orderflow oscillator, creates a high-probability environment for a bullish reversal.
Disclaimer: This is not financial advice. This analysis is for educational purposes only. Always conduct your own research and manage your risk appropriately.
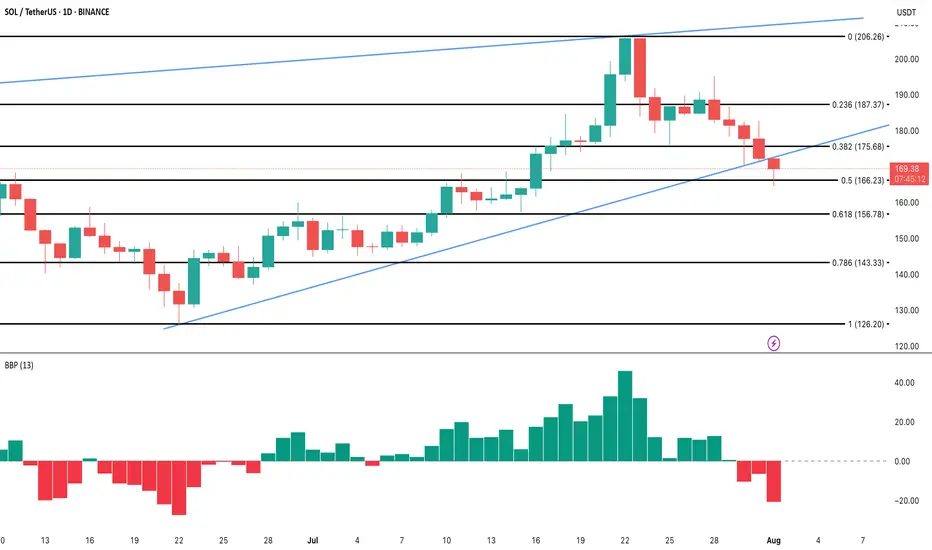
SOL/USDT Analysis – Breakdown or Bear Trap in the Making?The BINANCE:SOLUSDT price has tumbled more than 7.5% in the last 24 hours, breaking below its ascending wedge support on the daily chart. This technical breakdown has shifted market sentiment, with bears now pressing for deeper losses.
The Bull-Bear Power Index has flipped negative for three straight sessions, its longest bearish streak since June. This confirms growing sell-side dominance as BINANCE:SOLUSDT trades around $169, clinging to key support at $166. A clean break below this level could open the way to $156 or even $143, extending the downtrend.
While BINANCE:SOLUSDT price action dominates the picture, network demand has also weakened, with active addresses falling sharply since July’s highs. This dip in participation aligns with the breakdown, hinting that buyers lack the strength to defend key levels. Meanwhile, liquidation data shows that shorts significantly outweigh longs, adding pressure as bearish positions accumulate.
For this to become a classic bear trap , bulls need a swift rebound above $175–$180, forcing shorts to unwind and flipping momentum back positive. Until that happens, the technical setup and order flow favor bears, keeping downside risk firmly in play.
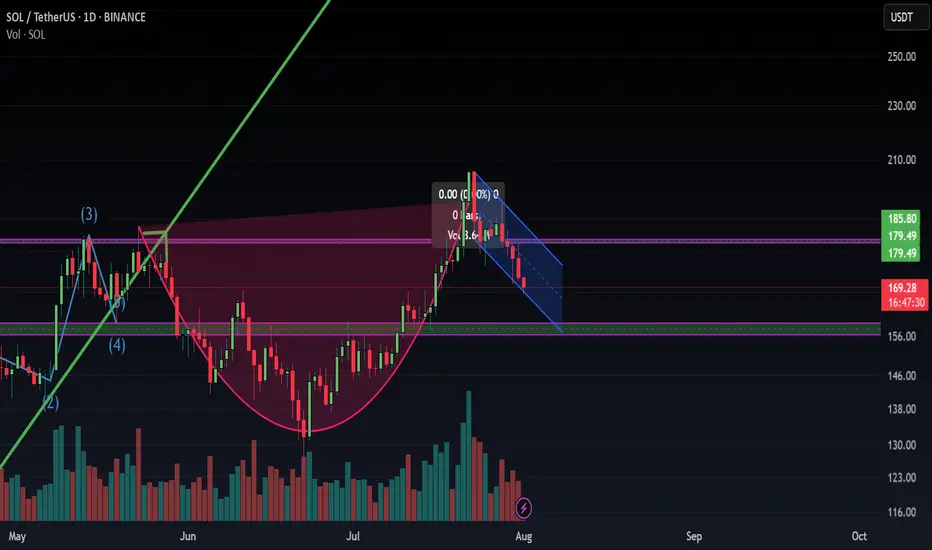
Solana Bullish Wave 5 coming?solana has completed the 3rd impulsive wave and now the recent decline was not impulsive but corrective meaning wave 4 has almost completed now we can look for wave 5 tp and sl are on the chart

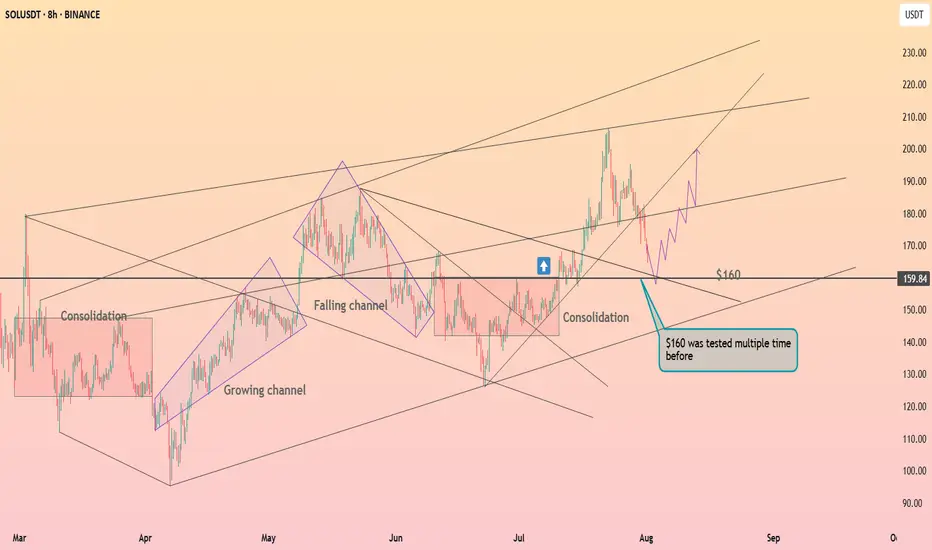
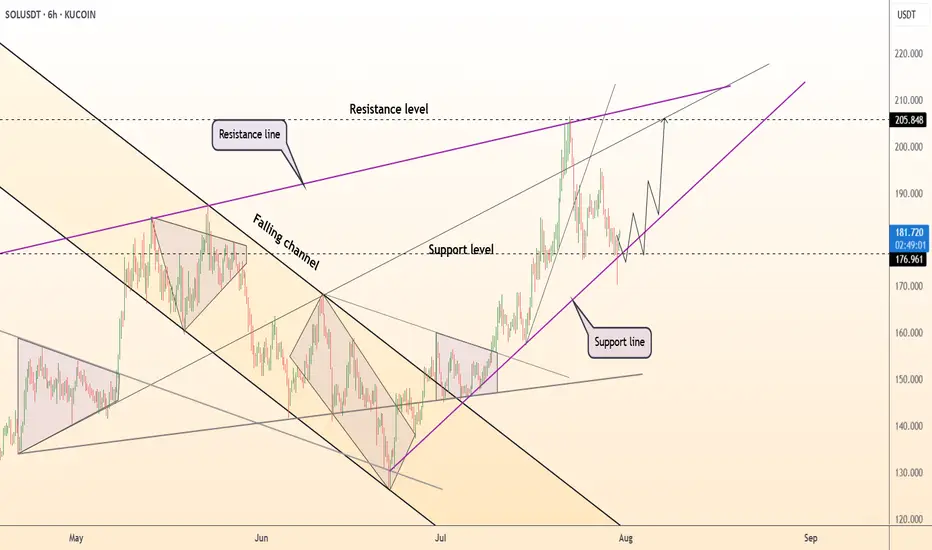
Solana above the $160 level ┆ HolderStatBINANCE:SOLUSDT is retracing toward the $160 support after failing to hold above $190. Price previously broke out from a falling channel and may find support at $160 again, where multiple reversals have occurred. A bounce here could fuel a move to $200.
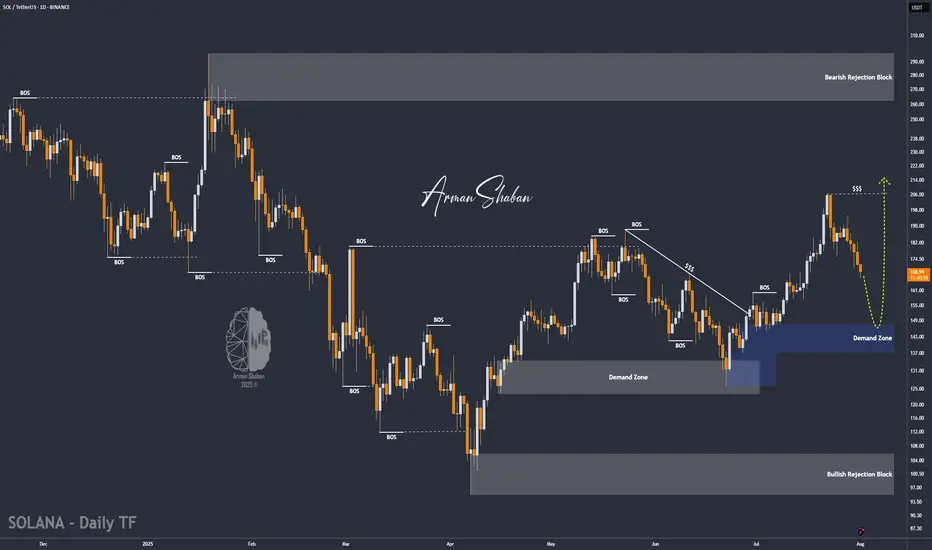
SOL/USDT | NFP Volatility Could Trigger Drop Toward $154!By analyzing the Solana chart on the daily timeframe, we can see that the price is currently trading around $169. If it fails to hold above the $168 level, a deeper drop could follow. With the upcoming NFP data release, increased volatility is expected across the markets. If Solana begins to decline, the potential correction targets are $163, $157, and $154. Watch the $145–$154 zone closely for a possible bullish reaction and buy opportunity.
Please support me with your likes and comments to motivate me to share more analysis with you and share your opinion about the possible trend of this chart with me !
Best Regards , Arman Shaban
SOLUSDT-1D Liquidity Grab + CHoCH = Short Setup on SOL? SOL on the daily chart shows signs of a potential trend reversal:
🔻 Liquidity grab above previous highs
🔄 CHoCH (Change of Character) confirmed
📥 Entry zone tapped, price showing early signs of rejection
📉 If supply holds, eyes on the $120 zone as next target
🔍 RSI rolling over from highs = weakness incoming?

$SOL Loses Key Support | Eyes on $140 & $95 Zones📉 CRYPTOCAP:SOL Loses Key Support | Eyes on $140 & $95 Zones
🕵️♂️ On the daily timeframe, #Solana has officially lost its key support near $140, which previously acted as a strong bounce zone. A failure to reclaim this level could open the gates for a deeper drop toward the $95–$100 support range.
📊 Indicators signal downside:
RSI is trending downward
MACD shows a bearish crossover
Stochastic RSI confirms continued selling pressure
⚠️ Macro pressure adds fuel to the fire: August 1st tariff tensions, with expected news from Trump on charging Paris, are weighing down global risk assets. Historically, August tends to be a bearish month for crypto markets.
🎯 Key Levels to Watch:
Immediate Resistance: $140
Major Support: $95–$100
🧠 Trade wisely and manage risk accordingly.

this is familier patternis this a cup of tea pattern? i see a cup and handle this is a sign of bullish in next week
#SOL Update #6 – Aug 01, 2025#SOL Update #6 – Aug 01, 2025
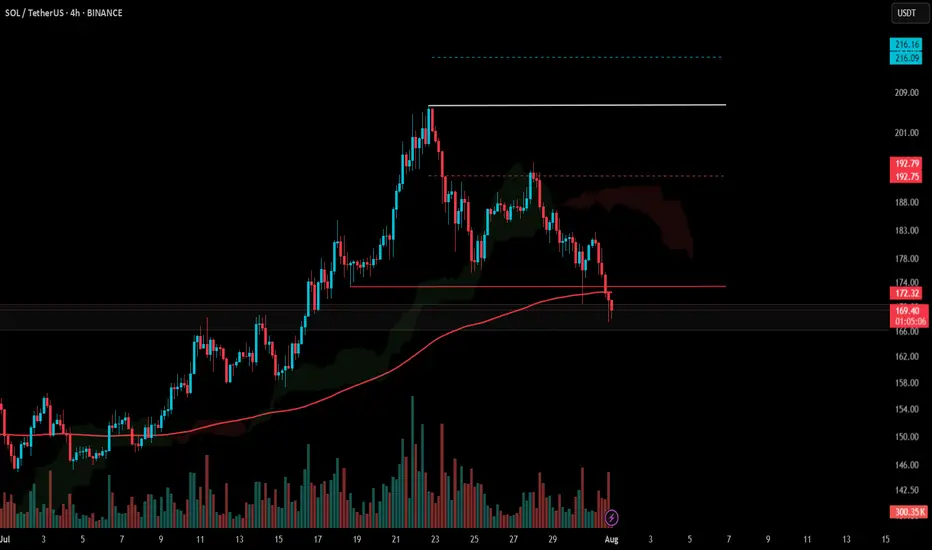
Unfortunately, Solana failed to hold the last low where its most recent impulsive move had started, and it closed below that level. This close also occurred below the MA200 band. In other words, Solana broke a very strong support on the 4-hour chart and moved downward, reaching the previous K-Level zone. It’s hard to say anything positive for Solana at this stage. If the current K-Level fails to hold, Solana may look for support around the $158 level. A long position on Solana is definitely not recommended. I also do not suggest a short position. However, unless there’s a strong reversal, it’s safe to say that Solana has entered a bearish phase on the 4-hour chart.
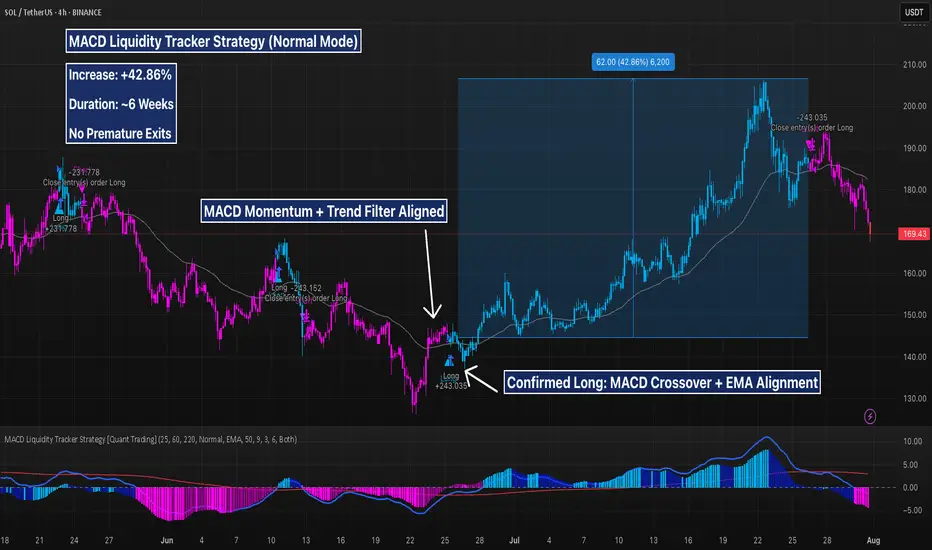
SOL 4H – 42% Win From Trend Filtered MACD Entry, But Is MomentumSOL just delivered a textbook 42.84% rally using the MACD Liquidity Tracker Strategy (Normal Mode). Entry was triggered once MACD momentum aligned with the 60/220 EMA trend filters — a clean breakout from consolidation with no noise or fakeouts.
The system captured the full leg up from ~$143 to over $205, holding through the expansion phase and exiting as bearish momentum began to show. Now, price has dipped below key EMAs and MACD is printing red — signaling a possible shift in structure.
📉 Will bulls defend the $165–$170 zone, or is a deeper pullback on deck?
📊 Strategy Settings:
MACD: 25 / 60 / 220
Trend Filter: 60 & 220 EMA
System Mode: Normal
Timeframe: 4H
i confuse !!!i see bearish engulfing candle stick in weekly time frame what is going on a big retracement await of just trick us???!!

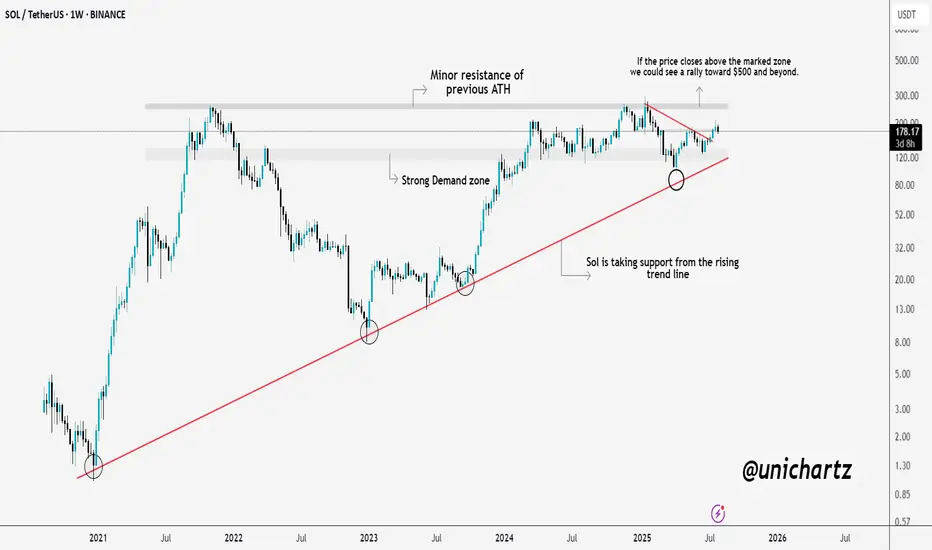
Massive Move Loading? $SOL Prepping for a BreakoutSolana is showing real strength here.
CRYPTOCAP:SOL consistently taking support from the long-term rising trendline, a sign that buyers are defending key levels. We're also approaching a critical resistance zone, which was the previous ATH area.
If SOL manages to close above this zone, we could witness a strong rally towards $500 and beyond. Until then, it’s a crucial level to watch, a breakout here could set the stage for the next leg up.
DYOR, NFA
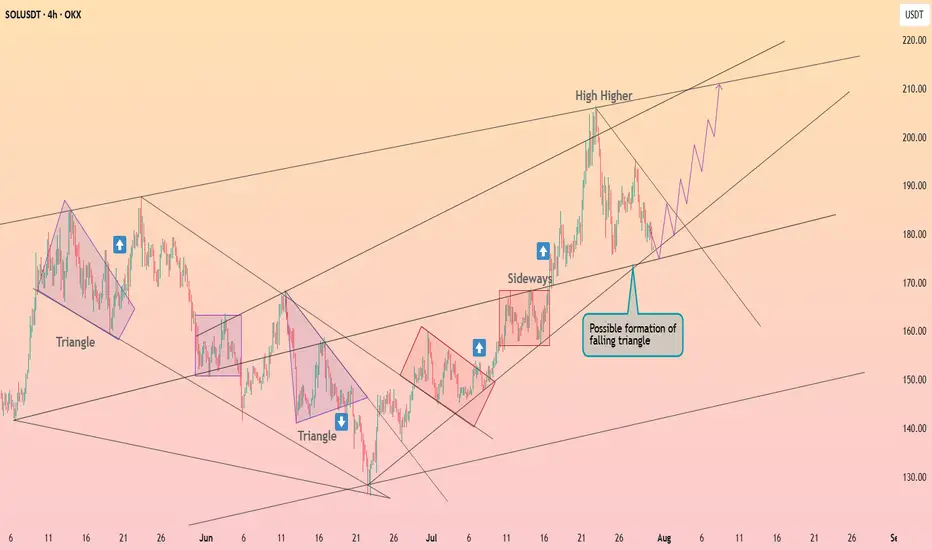
Solana is forming the falling triangle ┆ HolderStatOKX:SOLUSDT is compressing into a possible falling triangle, with support around 180–185 and upward projections pointing toward 210+. The chart has repeatedly shown triangle breakouts into strong rallies. As long as the lower trendline holds, the upside setup remains valid.
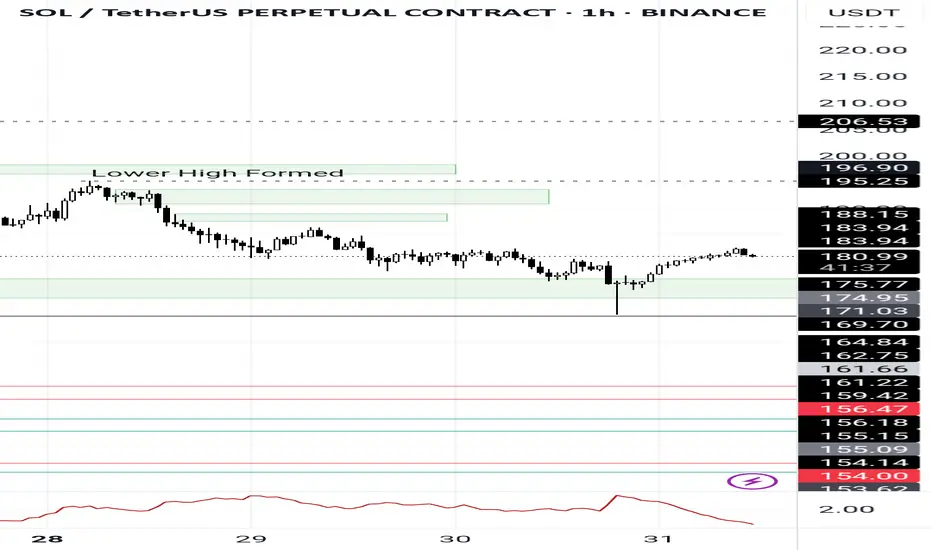
BEARISH TREND STARTI SEE ll and lh is bearish trend start ? just look at the hight and low its make ll and lh resistance area is about 182 support area is 170 to 172

Break down before the run upSo i feel this will go to the 4 hr OB. My reasoning is there's very little buy volume, the OBV is very low even though the price climbed a bit, and the RSI is below 50 still, so still bearish imo. But the market has its own ideas so be wary and watch closely. Make money my friends!

Short Executed alreadyAs I predicted the liquidity pool was raided but it didn't go back to my entry before running.
Congratulations if you got in at market entry
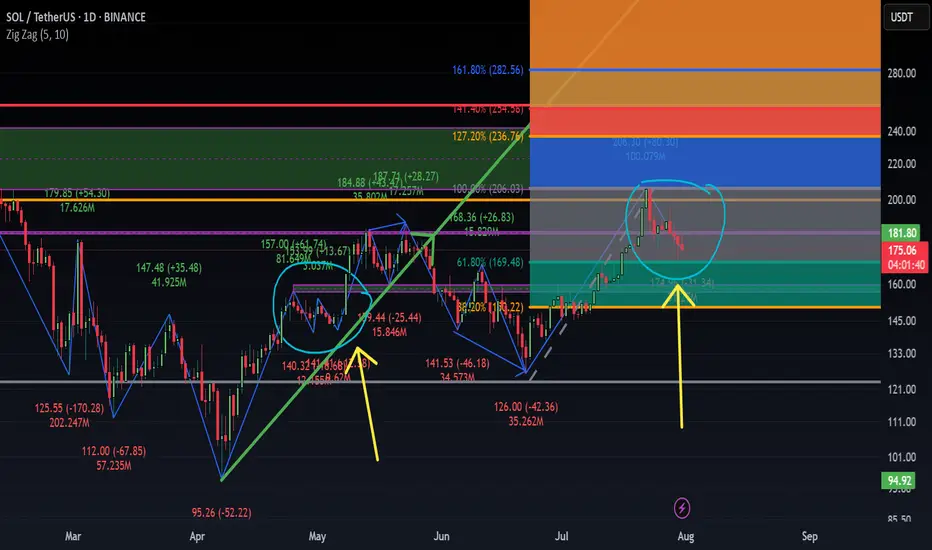
SOLANA could have a major retracement Solana completed a major ABC correction into a supply zone on the higher time frame (HTF), taking out the previous quarter’s highs.
On the daily chart, the RSI is overbought and signals the potential for a significant retracement.
Price action on the 4-hour chart shows a series of lower highs, indicating a bearish trend. If Solana fails to break above the previous high and trigger a market structure shift, the downtrend is likely to continue, leading to a deeper retracement on the higher time frames.

DeGRAM | SOLUSD is holding the $177 level📊 Technical Analysis
● SOLUSD is bouncing from the rising trendline support at 177 after a retracement, maintaining structure within a bullish ascending wedge.
● Price holds above the prior resistance-turned-support near 176.9, with a clear path to retest the 205.8 and 219–222 confluence zone.
💡 Fundamental Analysis
● Solana's 30-day DApp volume ranks top 3 among L1s, signaling increased utility. Institutional SOL inflows also continued for a fifth week, per CoinShares.
● Strong user metrics and positive funding rates suggest bullish momentum remains supported on-chain and through derivatives markets.
✨ Summary
Buy dips above 177. Targets at 205 ▶ 220. Long setup holds while price stays above 175.
-------------------
Share your opinion in the comments and support the idea with a like. Thanks for your support!
SolusdtHi snipers. On the one-day timeframe, the price is fluctuating in an ascending channel. It has now reached the middle line of the channel and the 103-day moving average support line is below it, which will help the price to move up again and reach the channel ceiling. If this support is broken, the price is likely to fall to the channel floor. This analysis is just a possibility. It is not a trading recommendation.
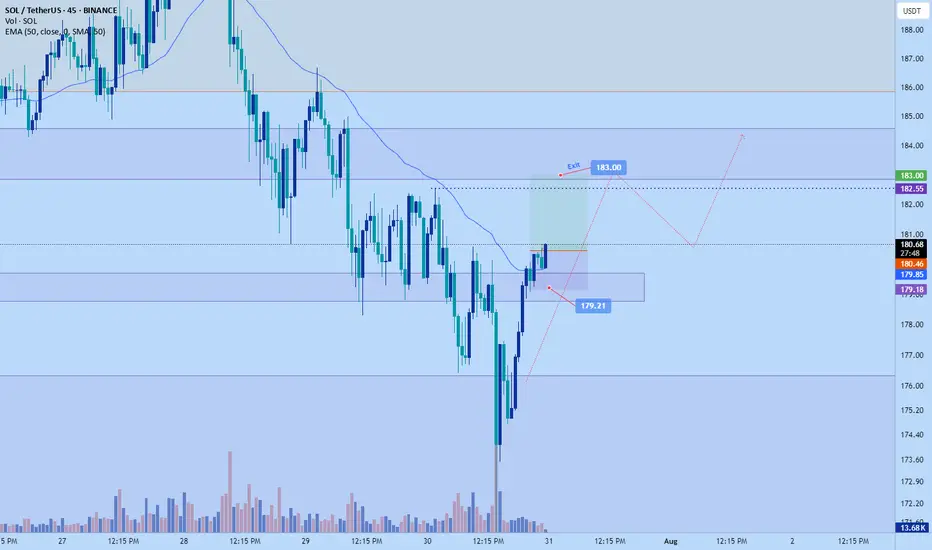
Solana scalp long to $183Just now opened a scalp long position on solana. Bulls are taking back control breaking resistance levels and no clear sign of exhaustion yet.
Sl: $179.21
Tp: $183
Roughly 2 RR
DTT strategy applied. - Direction , target and timing
Soul for souls Our BTC target was on spot and exceeded our expectations
Alts will follow and now everything looks set and more clear could be the real alt season,
Anyhow my target for soulusdt and I was being conservative I do expect it to go higher but that down to preference
Enjoy
