SOLANA → Consolidation before resistance. An attempt at growth?BINANCE:SOLUSDT.P is testing the resistance of the trading range, with pre-breakout consolidation forming, indicating that buyer interest in the coin is emerging.
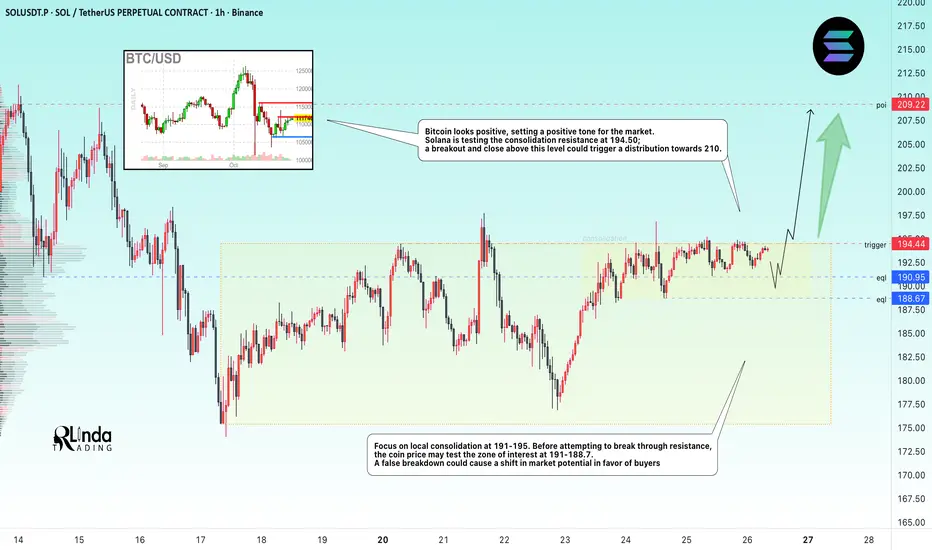
Bitcoin looks positive, which sets a positive tone in the market. Solana is testing the resistance of consolidation at 194.50; a breakout and close above this level could trigger a distribution to 210.
Focus on local consolidation at 191-195. Before attempting to break through resistance, the coin price may test the zone of interest at 191 - 188.7. A false breakout could cause a shift in market potential in favor of the buyer, which in turn could trigger a breakout of 195 and growth.
Resistance levels: 194.5, 209
Support levels: 190.1, 188.7
A retest of resistance, consolidation after growth, and no reaction to bears are positive signs that a breakout attempt may be realized. A close above 194.5 - 195.0 would be a good sign for growth.
Sincerely, R. Linda!
Trade ideas
[SeoVereign] SOLANA BEARISH Outlook – October 27, 2025Hello everyone,
This idea presents a bearish (short) outlook on Solana as of October 27.
Currently, Solana has entered a short-term overheated zone,
and we are beginning to observe a gradual inflow of selling pressure.
First Basis — (DEEP) GARTLEY Pattern
Solana is currently located within the PRZ (Potential Reversal Zone) of a (DEEP) GARTLEY pattern.
This zone is typically recognized as the terminal phase of a short-term upward wave,
where a trend reversal to the downside often occurs due to overbought conditions.
Second Basis — WAVE.M = WAVE.N × 0.786
The ongoing M-wave has formed approximately 78.6% of the length of the previous N-wave,
which represents a classic reversal structure commonly observed within the GARTLEY pattern.
Therefore, entering a short position within this range is considered technically valid.
Accordingly, the average target price is set around 184.97 USDT.
Depending on future price developments,
I will provide further updates on refinements to this idea and position management strategies.
Thank you for reading.

The Next Explosion, Hidden Clues in Price BehaviorCan you really feel the next Bitcoin explosion just by reading the charts?
The market looks calm, but deep down something big is shifting.
When everyone expects a crash, history shows that’s when the biggest moves begin.
Hello✌️
Spend 2 minutes ⏰ reading this educational material.
🎯 Analytical Insight on Solana:
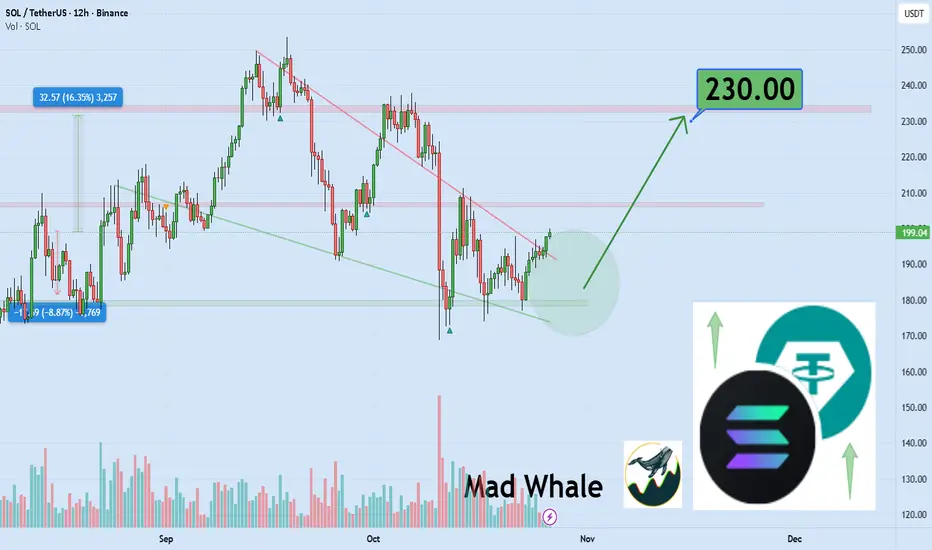
BINANCE:SOLUSDT is testing a key daily support; holding this zone could spark a 16% rally, targeting $230. 📈🛡️
Now , let's dive into the educational section,
🌋 The Calm Before the Storm
The crypto market is like the ocean before a tsunami quiet but full of hidden energy. On higher timeframes, candles look small and boring, yet trading volume is rising. That mix of silence on the surface and pressure underneath is exactly what happens before every strong bull run.
💡 Hidden Clues in Price Behavior
Bitcoin’s price has been building quiet support for weeks, while big transactions are slowly increasing in the background. This usually means that smart investors are buying without drawing attention. Rising volume with little price movement is often the first signal that accumulation has started.
🚀 Bitcoin The Engine of the Next Explosion
In every cycle, Bitcoin moves first. Breaking major resistance levels and holding above them is a sign of growing confidence. When Bitcoin dominance starts to drop and altcoin volume goes up at the same time, that’s when the whole crypto market gets ready for a collective takeoff.
🧠 Trader Psychology During Market Silence
Most traders fear a quiet market, but experienced ones see it as the best setup. When the media talks about stagnation and panic, the big players are quietly building long positions. The difference between average and professional traders is simple: one sees silence as danger, the other as opportunity.
🔍 The Path to Spotting the Next Big Move
To catch the move early, start with volume. When volume rises at support levels without breaking previous lows, it usually means smart money is buying. A positive divergence between price and RSI often appears right before momentum flips. Then watch for a bullish MACD cross on the daily chart when all three signals align, the explosion is close.
⚙️ TradingView Tools That Reveal Market Explosions
TradingView offers powerful tools that can help you detect big moves before they happen.
1. Volume Profile
Shows where most buying and selling happened. Heavy zones are usually where whales make their decisions.
2. MACD
Reveals when market momentum is changing direction. A bullish cross in the negative zone often signals the start of a reversal.
3. RSI
Measures the strength of buyers versus sellers. When RSI breaks above 50, a new bullish phase is often beginning.
4. Alert System
Highly underrated! Set alerts for your favorite indicators so when they align, you get notified instantly.
5. Multi-Timeframe Analysis
Use multiple timeframes to avoid fake signals. Comparing daily and 4-hour charts gives a much clearer picture of big moves.
⚡ Summary
All signs point to a massive move ahead. Bitcoin’s calmness is deceiving, but the data doesn’t lie. Stay patient, follow your signals, and you might witness one of the strongest uptrends in years.
🧭Golden Tips for Smart Traders
Patience beats excitement. The biggest profits go to those who wait for confirmation, not those who rush in
Ignore the crowd’s emotions. When the mood is darkest, opportunities are often the brightest.
Trust the chart, not your fear. The market always tells the truth if you take the time to listen.
✨ Need a little love!
We pour love into every post your support keeps us inspired! 💛 Don’t be shy, we’d love to hear from you on comments. Big thanks, Mad Whale 🐋
📜Please make sure to do your own research before investing, and review the disclaimer provided at the end of each post.
SOLUSDT: Bullish Persist, Aims For $211 And Above ?Here is why..
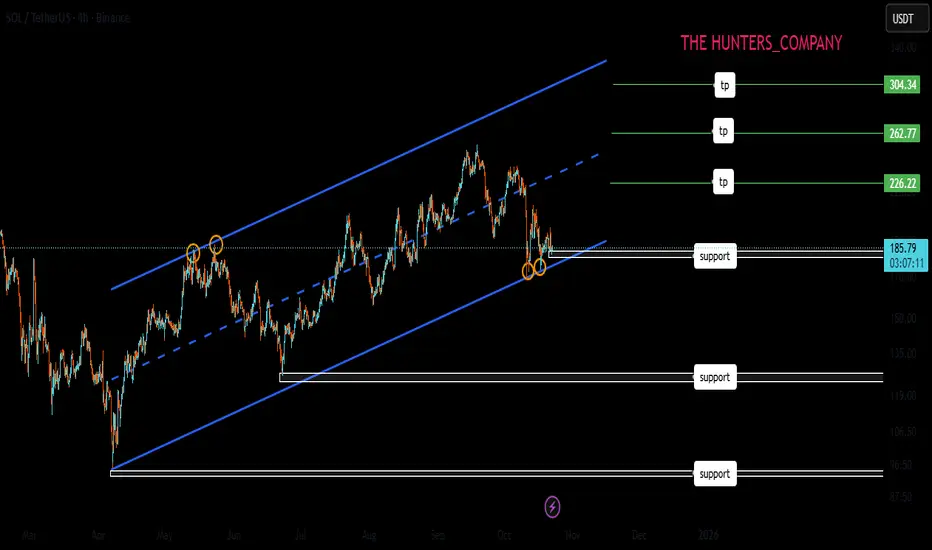
SOLUSDT have been trending in a long upward channel for the past few months, as we can observe in the chart formation. the pair has repeatedly respected the higher lows region.
Currently the price is rising slowly, heading towards $211 which seems to be the next potential target. however it might extends its bullish move above the anticipated level, in regards to the trendline.
Follow up and share your thoughts on this..
Thanks for reading.

Solusdt Sell The trend on major time frames is clearly bearish and we are currently at the top of the trend on the 2-hour time frame, so the most logical idea is to sell this currency pair.

SOLANA BULLISH MOVEMENTCheck this out!
Solana is forming a bullish movement. Lets wait for more movement if our technical analysis will be playing out.
Lets goo ^^

Is Solana Ready for a Technical Breakout or Just a Fake Pump?🎯 SOL/USDT Wealth Strategy Map | The Gentleman Thief's Playbook 💎
📊 Market Overview
Asset: SOLANA/USDT (SOL/USDT)
Trading Style: Swing/Day Trade Hybrid
Market Sentiment: Bullish Pending Breakout Setup 🚀
🎭 The Setup (As Told by a Professional Thief)
Dear Ladies & Gentlemen, gather 'round for today's calculated heist...
🔓 The Entry Plan
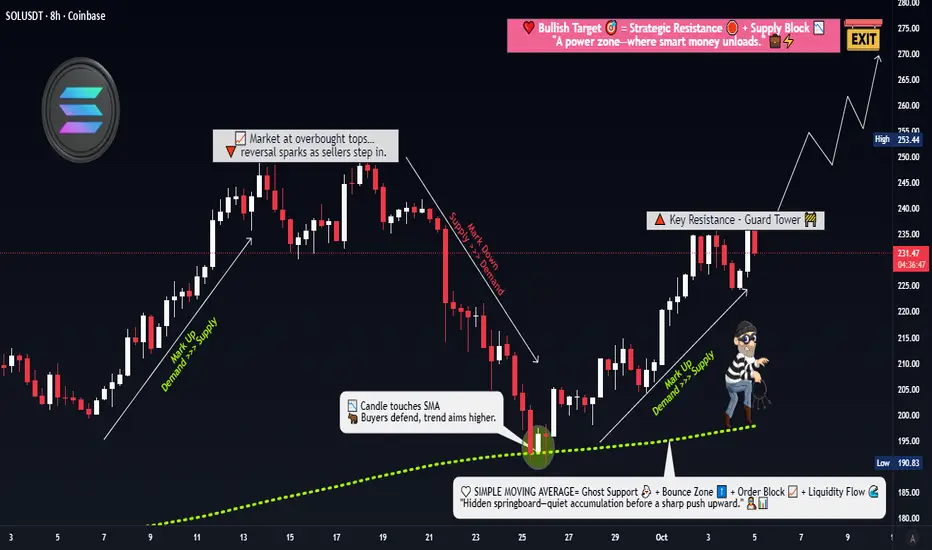
Breakout Zone: $240
Entry Strategy: ANY price level AFTER confirmed breakout above $240
💡 Why this matters: We're watching for resistance to crack like a vault door. Once $240 breaks with volume, the path to riches opens.
🛡️ Risk Management (The Thief's Insurance Policy)
Stop Loss: $220
⚠️ Important Notice: This is my thief-style SL, but YOU are the master of your own vault. Set your risk tolerance based on YOUR capital and comfort level. Make money, take money — at your own calculated risk.
🎯 Profit Targets (Where We Cash Out)
Primary Target: $270 (Our recommended exit)
Technical Target: $280 (Strong resistance + overbought territory + potential trap zone)
📌 Strategic Exit Reasoning:
$270 offers a clean 12.5% gain from breakout
$280 presents multiple bearish factors: strong resistance, overbought conditions, and classic bull trap setup
Smart thieves escape with profits before the alarm sounds 🚨
⚠️ Important Notice: This is my thief-style TP, but only YOU can decide when to take profits. Your money, your rules, your risk.
🔍 Technical Analysis Deep Dive
Key Levels to Watch:
Resistance: $240 (current), $270 (target), $280 (danger zone)
Support: $220 (our safety net)
The Correlation Play 📈
Related Pairs to Monitor:
CRYPTOCAP:BTC (Bitcoin) - The market's king affects all. If BTC pumps, SOL typically follows with 1.5x volatility
CRYPTOCAP:ETH (Ethereum) - Direct competitor in smart contracts; inverse correlation on capital rotation
CRYPTOCAP:AVAX (Avalanche) - Similar L1 narrative; watch for sector rotation signals
SEED_DONKEYDAN_MARKET_CAP:MATIC (Polygon) - L2 competitor; check for broader altcoin momentum
💡 Correlation Strategy: If BTC holds above $65K while ETH consolidates, SOL historically outperforms due to capital flow seeking higher beta plays.
⚡ The Gentleman Thief's Trading Philosophy
This isn't gambling — it's calculated robbery from the market's inefficiencies. We enter with precision, manage risk like professionals, and exit before greed becomes our enemy.
Remember:
✅ Breakouts need volume confirmation
✅ Risk management is non-negotiable
✅ Profits aren't real until you take them
✅ The market doesn't care about your feelin
📢 Community Engagement
✨ "If you find value in my analysis, a 👍 and 🚀 boost is much appreciated — it helps me share more setups with the community!"
⚖️ Legal Disclaimer
IMPORTANT: This is a "thief-style" trading strategy shared purely for educational and entertainment purposes. This is NOT financial advice. Trading cryptocurrencies involves substantial risk of loss. Past performance does not guarantee future results.
You are solely responsible for your own trading decisions. Always:
Do your own research (DYOR)
Never invest more than you can afford to lose
Understand the risks before trading
Consider your personal financial situation
The author is not a registered financial advisor and assumes no liability for your trading outcomes.
Trade safe, steal smart, exit elegant. 🎩💰
#SOLUSDT #Solana #CryptoTrading #SwingTrading #DayTrading #TradingStrategy #Breakout #TechnicalAnalysis #CryptoSignals #AltcoinSeason #SOL #USDT #CryptoAnalysis #TradingView #PriceAction #CryptoChart #BullishSetup
SOLUSDT.P - October 26, 2025Based on the 4-hour chart, the price appears to be consolidating within a triangle after a sharp decline. A long bias is supported by the potential for a breakout above the upper trendline.

SOL at Support, History Could Repeat$SOL/USDT Analysis
SOL continues to respect its long-term rising support line beautifully. Each time it has accumulated around this trendline, we’ve seen a strong rally follow, and the same pattern seems to be forming again.
Right now, SOL is in another accumulation phase, holding well above the key support zone. If history repeats itself and the price sustains this level, we could see another explosive move toward new highs.
DYOR, NFA
Thanks for reading! Appreciate your support and engagement 🙏

SOLANAI usually focus on higher timeframe setups, but I’ll start sharing short-term targets too. Right now, CRYPTOCAP:SOL is trading inside a clean descending channel pattern, and the short-term target is $280, offering around 50% profit from current levels if momentum continues.

CBDCs as Digital AssetsIntroduction
In the rapidly evolving landscape of global finance, digitalization is redefining how value is created, stored, and exchanged. Among the most transformative innovations in this domain is the Central Bank Digital Currency (CBDC) — a digital form of sovereign money issued by a nation’s central bank. Unlike cryptocurrencies such as Bitcoin or Ethereum, CBDCs are centralized, fully regulated, and backed by the monetary authority of a country. As financial systems shift toward more digital and decentralized infrastructures, CBDCs are emerging not only as new payment tools but also as significant digital assets that may redefine global trade, investment, and monetary policy.
This essay explores the concept of CBDCs as digital assets, their structure, design models, global adoption trends, potential benefits, risks, and their future implications for economies and financial systems worldwide.
Understanding CBDCs: Concept and Structure
A Central Bank Digital Currency (CBDC) is a digital version of a country’s fiat currency, representing a direct liability of the central bank. It can be used by individuals, businesses, and financial institutions as a means of payment, store of value, and unit of account — the three fundamental functions of money. Unlike commercial bank deposits or cryptocurrencies, CBDCs are risk-free because they are backed by the full faith and credit of the issuing government.
CBDCs typically exist in two primary forms:
Retail CBDCs: Designed for public use, enabling citizens and businesses to conduct transactions directly with the central bank through digital wallets.
Example: The Bahamian Sand Dollar, Nigeria’s eNaira, and China’s e-CNY.
Wholesale CBDCs: Used primarily by financial institutions for interbank settlements, cross-border transfers, and clearing operations.
Example: Project Helvetia by the Swiss National Bank and Project Jura by the Banque de France.
As digital assets, CBDCs are tokenized representations of sovereign money that exist in digital form on a secure ledger — either centralized or distributed. They can integrate with blockchain technology or function on traditional centralized databases, depending on the design choice of the issuing central bank.
CBDCs vs. Cryptocurrencies and Stablecoins
To understand CBDCs as digital assets, it is essential to distinguish them from other digital currencies:
Cryptocurrencies (e.g., Bitcoin, Ethereum) are decentralized, not backed by any authority, and rely on market demand for valuation.
Stablecoins (e.g., USDT, USDC) are privately issued tokens pegged to fiat currencies but not directly guaranteed by central banks.
CBDCs, on the other hand, combine the trust and stability of fiat currencies with the efficiency and speed of digital technology.
This hybrid nature positions CBDCs as state-backed digital assets that can bridge the gap between traditional financial systems and the emerging digital economy.
The Economic Rationale Behind CBDCs
Central banks worldwide are exploring CBDCs for several economic and strategic reasons:
Enhancing Payment Efficiency:
Traditional payment systems, especially cross-border transactions, are slow and costly. CBDCs can streamline these processes by enabling real-time settlements and reducing dependency on intermediaries.
Financial Inclusion:
CBDCs can extend financial services to unbanked populations by allowing anyone with a mobile phone to access digital payment systems, especially in developing nations.
Maintaining Monetary Sovereignty:
The rapid rise of private digital currencies and foreign stablecoins poses a challenge to national monetary control. CBDCs enable central banks to retain authority over the money supply and ensure economic stability.
Reducing Transaction Costs:
With blockchain or distributed ledger technology (DLT), CBDCs can minimize clearing and settlement costs, promoting more transparent and efficient financial ecosystems.
Combating Illicit Activities:
Digital traceability enables better monitoring of transactions, helping authorities curb money laundering, tax evasion, and terrorism financing.
CBDCs as Digital Assets in Financial Markets
As digital assets, CBDCs possess unique attributes that can transform both domestic and international finance. Their programmable nature and compatibility with other tokenized assets open the door to new financial models and asset ecosystems.
1. Tokenization and Programmability
CBDCs can be programmed with smart contracts, enabling automated execution of financial transactions — such as interest payments, tax collection, or subsidy distribution — without intermediaries. This programmable feature turns CBDCs into intelligent digital assets capable of interacting with decentralized finance (DeFi) systems, digital bonds, and other tokenized securities.
2. Integration with Digital Asset Markets
CBDCs can serve as the foundation layer for broader digital asset ecosystems. They can facilitate instant settlement of tokenized assets, streamline securities trading, and enhance liquidity management. For example, central banks could use wholesale CBDCs to settle government bond trades in real time, reducing counterparty risks.
3. Cross-Border Payments
In global trade, CBDCs could eliminate the inefficiencies of correspondent banking. Multi-CBDC arrangements, such as the mBridge project (involving Hong Kong, China, Thailand, and the UAE), are testing platforms where multiple CBDCs interact seamlessly. This could create a new class of digital reserve assets, enabling faster, cheaper, and more transparent cross-border settlements.
Global Adoption and Case Studies
Central banks across more than 130 countries — representing over 98% of global GDP — are exploring or piloting CBDC initiatives. Some notable examples include:
China (Digital Yuan / e-CNY):
The People’s Bank of China has been a pioneer in retail CBDCs, using the e-CNY for domestic transactions, public salaries, and pilot programs in major cities.
European Union (Digital Euro):
The European Central Bank aims to launch a digital euro to complement physical cash, ensuring privacy, security, and monetary stability in the Eurozone.
India (Digital Rupee / e₹):
The Reserve Bank of India launched pilot programs for wholesale and retail CBDCs in 2022, exploring use cases in interbank settlements, government payments, and retail transactions.
United States (Digital Dollar):
The Federal Reserve is researching potential frameworks for a digital dollar, emphasizing privacy, interoperability, and financial stability.
Bahamas (Sand Dollar):
The world’s first fully deployed retail CBDC, launched in 2020, aimed at improving financial inclusion across remote islands.
These global experiments highlight CBDCs’ potential as national digital assets that could reshape the structure of global payments and reserves.
Benefits of CBDCs as Digital Assets
Trust and Stability:
Being issued by central banks, CBDCs are backed by government guarantees, making them a more stable form of digital money compared to volatile cryptocurrencies.
Interoperability:
CBDCs can act as a universal settlement asset across various financial systems, improving coordination between banks, fintechs, and digital platforms.
Transparency and Traceability:
Digital ledgers enable authorities to monitor money flows in real time, enhancing fiscal transparency and reducing corruption.
Resilience and Innovation:
By introducing programmable features, CBDCs foster innovation in payment systems, encouraging new fintech products and digital services.
Cost Reduction:
The elimination of intermediaries lowers transaction fees and settlement times, particularly in international trade and remittances.
Support for Digital Transformation:
CBDCs align with broader trends toward digital economies, e-governance, and data-driven policy-making.
Risks and Challenges
While CBDCs offer vast potential, they also introduce new complexities and risks that central banks must manage carefully.
1. Privacy Concerns
CBDCs could enable governments to track every transaction, raising concerns about surveillance and data privacy. Designing systems that balance transparency with anonymity is critical.
2. Cybersecurity Risks
As digital assets, CBDCs are vulnerable to cyberattacks, data breaches, and technological failures. Ensuring secure, resilient, and tamper-proof systems is essential.
3. Financial Disintermediation
If individuals hold CBDCs directly with central banks, it may reduce the role of commercial banks in deposit-taking, potentially destabilizing credit markets.
4. Technological Inequality
Not all citizens have equal access to digital infrastructure. Poor connectivity and lack of digital literacy could limit CBDC adoption.
5. Global Fragmentation
Different technological standards and regulatory frameworks across nations could create fragmented CBDC ecosystems, hindering cross-border interoperability.
6. Monetary Policy Complexity
Introducing programmable money could complicate the transmission of monetary policy and raise new questions about interest rates on digital assets.
CBDCs and the Future of Monetary Policy
CBDCs provide central banks with new tools for implementing and monitoring monetary policy. For instance:
Direct Stimulus Distribution: Governments could issue programmable CBDCs for targeted economic aid, ensuring efficient and transparent delivery.
Interest-bearing CBDCs: Central banks could adjust interest rates directly on CBDC holdings, influencing spending and saving behavior more precisely.
Real-time Economic Data: Digital transaction data could provide policymakers with real-time insights into economic activity, enabling faster responses to inflation or recession.
However, this also raises concerns about excessive control and the need for robust governance frameworks to prevent misuse of power.
CBDCs and the Digital Asset Ecosystem
The emergence of CBDCs is not occurring in isolation. They are expected to interact with other components of the digital asset ecosystem, including:
Tokenized securities and commodities
Decentralized finance (DeFi) protocols
Blockchain-based identity systems
Digital wallets and payment gateways
By enabling secure settlement and universal interoperability, CBDCs could become the anchor of the global digital asset infrastructure — ensuring stability in a marketplace otherwise characterized by volatility and fragmentation.
The Future Outlook
The evolution of CBDCs represents more than a technological upgrade — it signifies a shift in the philosophy of money. As digital assets, CBDCs have the potential to transform the global financial order by:
Redefining the role of central banks in the digital economy
Enhancing global financial inclusion and efficiency
Introducing programmable, transparent, and instantaneous financial systems
In the coming decade, the success of CBDCs will depend on how well central banks address privacy, security, interoperability, and governance challenges while ensuring public trust and economic stability.
Conclusion
CBDCs, as digital assets, stand at the intersection of technology, economics, and policy. They combine the reliability of state-backed money with the innovation of blockchain and digital finance. By doing so, they promise to modernize financial systems, expand inclusion, and strengthen monetary sovereignty. Yet, their implementation requires careful balancing between innovation and regulation, privacy and oversight, and efficiency and stability.
Ultimately, CBDCs are more than just a new form of currency — they are the next evolution of money in the digital era. As nations continue experimenting and refining their models, CBDCs will likely play a pivotal role in shaping the future of the global financial system — transforming how we perceive, use, and store value in an increasingly digital world.
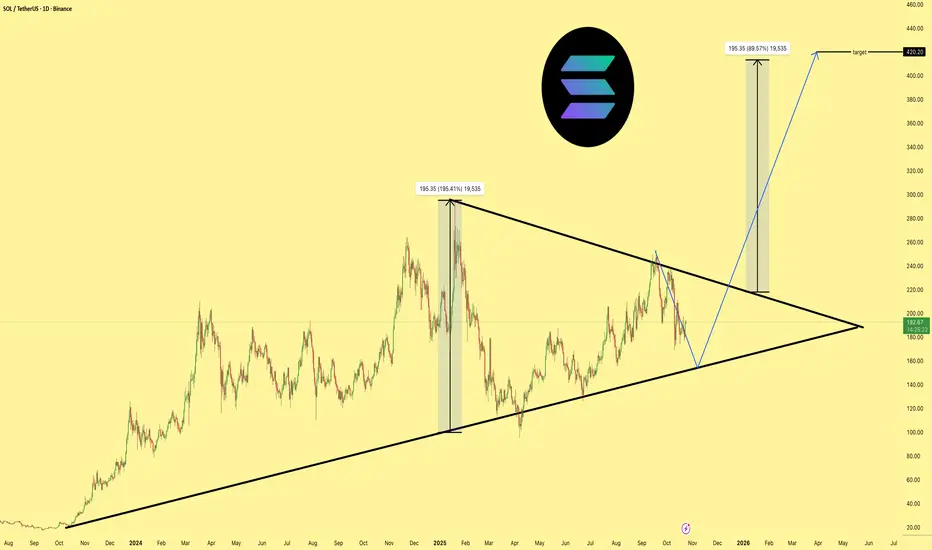
SOLCRYPTOCAP:SOL target remains $420, but there’s still room for a dip toward the $150 zone before the next leg up. Placing limit orders between $130–$160 is a smart move to DCA into your spot position. This strategy helps smooth out volatility and gives you a strong average entry.
Is A Bullish Crossover Next For Solana Price?Solana’s price stands at $187 at the time of writing, holding firm above the $183 support level. The altcoin remains range-bound, struggling to break through the key $192 resistance. However, price stability above support suggests growing resilience in the face of selling pressure.
If Solana’s bullish indicators gain traction, the price could climb past $192 and target $200 or higher. Strengthening support levels combined with improving investor sentiment could help SOL establish a sustainable uptrend.
Conversely, if momentum fails to build, Solana may drop below $183 to test $175. A further decline could extend losses toward $163. This would effectively invalidating the bullish outlook and signaling continued market weakness.

sol-usdtStill below this valid trend line
If it manages to break the trend line
it could continue to climb towards the psychological resistance of $200✔️🚀
Solana’s valid bottom is $175

Risk in Global Market TradingIntroduction
Global market trading has revolutionized the way capital flows across borders, offering investors opportunities to diversify portfolios and seek higher returns. However, with these opportunities comes a complex landscape of risk. In today’s interconnected world, financial markets are influenced not only by domestic economic indicators but also by global monetary policies, geopolitical developments, and systemic events that can ripple across economies within minutes. Understanding risk in global market trading is, therefore, not merely a technical skill—it is a strategic necessity for investors, policymakers, and institutions alike.
Risk in global markets can manifest in numerous forms: market volatility, currency fluctuations, liquidity constraints, credit defaults, geopolitical instability, and systemic failures. Each type of risk interacts with others in dynamic and often unpredictable ways. This essay explores the multifaceted nature of risk in global market trading, the major types of risks faced by traders and investors, methods of risk assessment and mitigation, and the evolving landscape of risk management in the age of technology and globalization.
1. Understanding the Concept of Risk in Global Trading
In finance, risk refers to the potential for loss due to uncertainty about future outcomes. In global trading, risks are magnified because of exposure to multiple markets, asset classes, and currencies. These risks can stem from both systematic factors—such as global recessions, inflationary pressures, or changes in monetary policy—and unsystematic factors like firm-level management inefficiencies or localized political issues.
Risk is inherent to every trading decision. Global market participants—from institutional investors and hedge funds to retail traders—must therefore adopt robust risk management frameworks to identify, quantify, and manage potential losses. The challenge lies not only in measuring risk but also in anticipating the speed and scale at which it can materialize in interconnected markets.
2. Major Types of Risks in Global Market Trading
a) Market Risk
Market risk, also known as systematic risk, refers to the potential loss arising from adverse movements in market prices, including equity prices, interest rates, and commodity values. In global markets, volatility is driven by a complex interplay of macroeconomic trends, investor sentiment, and technological innovation. For instance, the 2008 financial crisis demonstrated how global equity markets can collapse simultaneously due to interconnected leverage structures and liquidity shortages.
Market risk can be categorized into:
Equity risk: arising from fluctuations in stock prices.
Interest rate risk: caused by unexpected changes in central bank rates or bond yields.
Commodity price risk: influenced by supply-demand dynamics, trade policies, and energy market disruptions.
Effective hedging through derivatives such as options and futures contracts is a key strategy to mitigate market risk in global trading.
b) Currency (Exchange Rate) Risk
In global trading, currency risk—or foreign exchange risk—is one of the most significant factors affecting profitability. Traders dealing in multiple currencies face potential losses due to fluctuations in exchange rates. For example, an Indian investor holding U.S. stocks may see returns decline if the U.S. dollar depreciates against the Indian rupee, even if the stock prices themselves rise.
Exchange rate risk arises from three primary exposures:
Transaction exposure: when settlements in foreign currencies are affected by exchange rate changes.
Translation exposure: when multinational companies consolidate financial statements from subsidiaries in different currencies.
Economic exposure: reflecting the broader impact of exchange rate movements on a firm’s competitiveness and cash flows.
Traders often use forward contracts, currency swaps, or natural hedging (offsetting currency inflows and outflows) to manage foreign exchange risks effectively.
c) Credit Risk
Credit risk arises when a counterparty fails to fulfill its contractual obligations—such as in derivative transactions, margin trading, or securities lending. In global markets, the interdependence of institutions amplifies this risk. The collapse of Lehman Brothers in 2008 is a stark reminder of how the default of one major entity can trigger widespread systemic consequences.
Credit risk management involves assessing counterparties’ creditworthiness, setting exposure limits, and using credit derivatives such as credit default swaps (CDS) to hedge against potential losses.
d) Liquidity Risk
Liquidity risk occurs when traders are unable to buy or sell assets quickly enough to prevent or minimize losses. In times of financial stress, even highly rated assets can become illiquid, leading to sharp declines in prices. The global financial crisis demonstrated how liquidity dry-ups can paralyze entire markets.
There are two types of liquidity risk:
Market liquidity risk: when there are not enough buyers or sellers.
Funding liquidity risk: when an institution cannot meet short-term obligations due to cash flow shortages.
To mitigate liquidity risk, traders maintain diversified portfolios, establish credit lines, and implement stress-testing mechanisms that simulate liquidity crunches.
e) Political and Geopolitical Risk
Global trading is highly sensitive to political developments, regulatory changes, and international conflicts. Geopolitical risk encompasses factors such as wars, sanctions, trade disputes, and regime changes that can disrupt financial flows and investor confidence. For example, the Russia-Ukraine conflict significantly impacted energy markets, commodities, and foreign exchange rates worldwide.
Political risk also includes changes in taxation policies, foreign investment restrictions, or sudden nationalization of assets. Investors often mitigate these risks through geographical diversification, political risk insurance, and by closely monitoring global news and policy trends.
f) Operational and Technological Risk
Operational risk arises from failures in internal processes, systems, or human errors. In global markets that rely heavily on high-frequency trading (HFT) and algorithmic systems, technological failures can cause severe disruptions. Cybersecurity threats—such as hacking of trading platforms or data breaches—pose additional layers of operational risk.
To manage these risks, institutions invest in robust IT infrastructure, enforce compliance protocols, and develop contingency plans to ensure business continuity in the event of system failures or cyber incidents.
g) Systemic and Contagion Risk
Systemic risk refers to the potential collapse of an entire financial system due to the failure of interconnected participants. The globalization of finance has heightened this risk, as crises in one region can rapidly spread to others—a phenomenon known as contagion. The Asian Financial Crisis (1997) and the Global Financial Crisis (2008) illustrated how cross-border linkages in banking and capital markets can amplify local shocks into global turmoil.
Central banks and regulators attempt to contain systemic risk through macroprudential policies, capital adequacy requirements, and coordinated international responses.
3. Measuring and Managing Risk in Global Markets
Effective risk management relies on both quantitative analysis and strategic oversight. Some of the key methods include:
a) Value at Risk (VaR)
Value at Risk estimates the maximum potential loss of a portfolio over a specific time period with a given confidence level. It is a standard tool for quantifying market risk.
b) Stress Testing and Scenario Analysis
These techniques simulate extreme market conditions (e.g., a global recession, oil shock, or currency collapse) to assess how portfolios would perform under stress.
c) Diversification
Diversifying assets across geographies, industries, and currencies reduces exposure to any single source of risk.
d) Hedging with Derivatives
Options, futures, swaps, and other derivatives allow traders to offset potential losses from adverse price movements.
e) Risk-Adjusted Performance Metrics
Metrics such as the Sharpe ratio and Treynor ratio help traders evaluate returns relative to the level of risk undertaken.
f) Regulatory and Compliance Frameworks
Global financial institutions are governed by frameworks like Basel III (for banks) and MiFID II (for European markets), which set standards for risk management, leverage, and transparency.
4. The Role of Technology in Risk Management
Technological advancements have transformed risk management in global trading. Artificial intelligence (AI), machine learning (ML), and big data analytics enable real-time risk monitoring and predictive modeling. Algorithms can detect patterns of volatility, forecast potential price shocks, and execute hedging strategies within milliseconds.
Blockchain technology enhances transparency and reduces counterparty risks by providing immutable transaction records. Meanwhile, RegTech (Regulatory Technology) automates compliance processes, ensuring that firms adhere to global regulations efficiently.
However, technology itself introduces new risks—such as model risk (errors in algorithmic assumptions) and cyber risk—which require ongoing vigilance.
5. The Interconnected Nature of Global Risk
Global markets do not operate in isolation. An event in one market—such as a policy shift by the U.S. Federal Reserve or a slowdown in China’s economy—can influence currencies, commodities, and equities worldwide. The COVID-19 pandemic was a striking example of how health crises can evolve into financial crises, disrupting global supply chains and triggering market panic.
Therefore, traders and investors must adopt a holistic approach to risk, recognizing the interdependence of financial systems. Global coordination among regulators and central banks, along with international cooperation through institutions like the IMF and World Bank, is essential for maintaining stability.
6. Emerging Risks in the Modern Trading Landscape
The future of global trading brings new categories of risks:
Climate risk: Extreme weather events and regulatory shifts toward green energy affect asset valuations and commodity prices.
Cyber risk: Increasing digitalization exposes markets to hacking and data theft.
AI and algorithmic trading risk: Autonomous trading systems can cause flash crashes if algorithms malfunction.
Regulatory divergence: As nations adopt differing post-crisis regulations, cross-border compliance becomes complex.
Social and reputational risk: Public sentiment, ESG (Environmental, Social, and Governance) issues, and social media trends increasingly influence market behavior.
7. Strategies for Effective Global Risk Governance
An effective risk governance framework integrates strategic oversight with operational discipline:
Establish clear risk appetite and tolerance limits.
Develop independent risk management functions to oversee exposures.
Foster a risk-aware culture across all levels of an organization.
Continuously update risk models based on evolving market data.
Enhance communication and transparency between traders, regulators, and investors.
Conclusion
Risk in global market trading is both inevitable and indispensable. Without risk, there would be no return; yet unmanaged risk can lead to catastrophic losses. As globalization deepens and markets become more interlinked, traders face a web of challenges—from market volatility and currency fluctuations to technological vulnerabilities and systemic contagion.
The key to thriving in this environment lies in understanding, measuring, and managing these risks with precision and foresight. By combining advanced analytics, diversified strategies, strong governance, and adaptive technologies, market participants can navigate uncertainty and harness global opportunities while safeguarding their capital. In essence, successful global trading is not about avoiding risk—but mastering it.

SOLUSDT.P - October 23, 2025Price is testing resistance near $182.65; a breakout above this level could signal bullish continuation toward $184.81–$187.27, while rejection may trigger a retracement to $178.00–$177.66 support. Consolidation between these zones remains possible—plan and execute your trades accordingly with clear risk management.

SOLUSDT.P - October 22, 2025Price is attempting a short-term rebound from the 183.13-180.23 range after an extended decline, forming a potential counter-trend setup targeting multiple profit levels near 189.9, 192.0, 194.3, and 197.6. However, volatility remains high amid Trump's tariff narrative, making this a high-risk play that requires tight stop management and active monitoring.

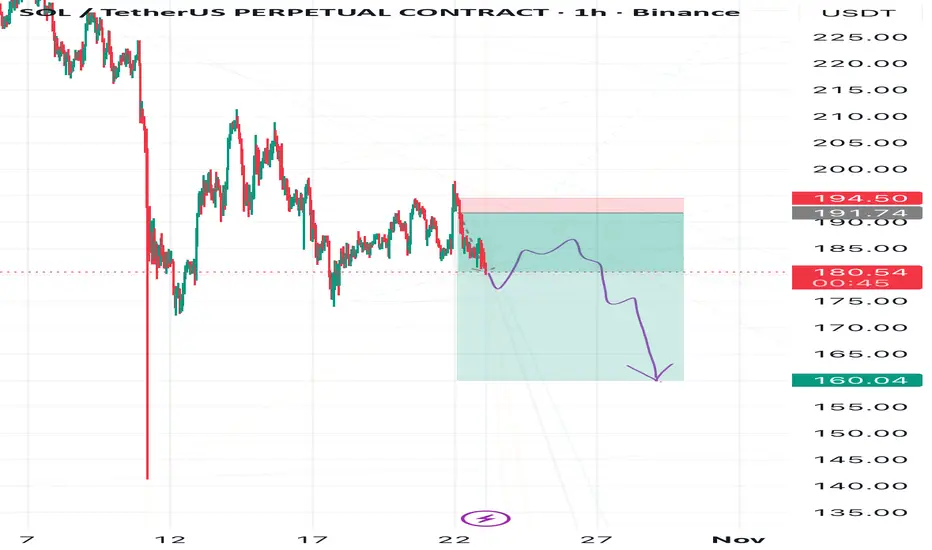
Don’t Trust the Twist — Solana’s Fall May PersistBe careful with Solana — the market might trick you into thinking a bullish reversal is forming.
In reality, the downtrend hasn’t finished yet.
A descending triangle is forming, and the breakout could be strongly to the downside.
🎯 Targets:
1️⃣ 164
2️⃣ 156
3️⃣ 138
❌ Invalidation: if price reaches the red zone marked on the chart
SOLCRYPTOCAP:SOL could dip to around $150 again, maybe just a quick wick before reversing. I think that move would be short-lived and followed by a strong 160% rally toward $420. It’s shaping up to be a great opportunity for patient entries before the next breakout wave.

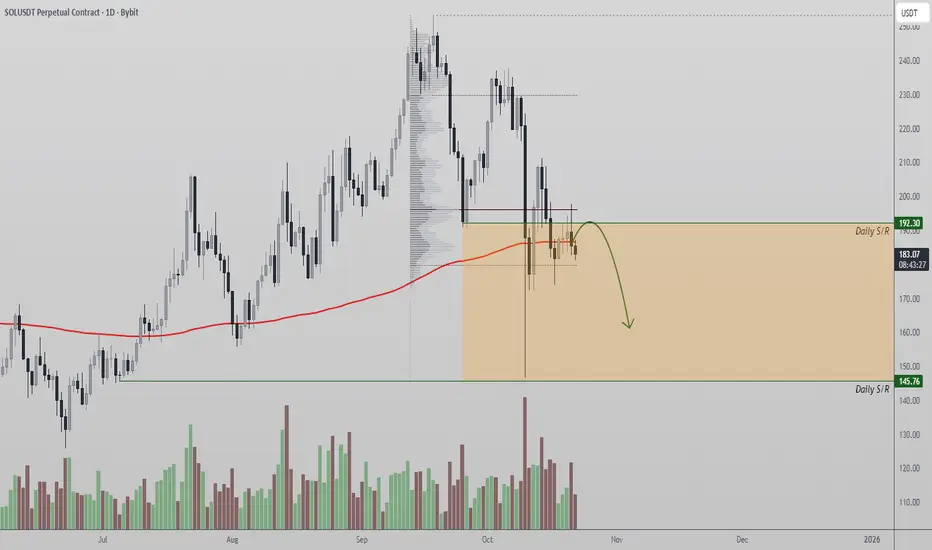
Solana Faces Strong Rejection at $192 ResistanceSolana price action is struggling to gain momentum above the $192 level, a critical zone packed with strong technical confluences. This region houses both the 200 Exponential Moving Average (EMA) and the Point of Control (POC), making it a decisive battleground for market participants.
The inability to reclaim this region suggests that bullish momentum remains limited in the short term. A rejection from this resistance could invite a deeper corrective phase, especially if buying pressure continues to fade near current levels.
Key Points:
- Major Resistance: $192, aligning with both the 200 EMA and POC, acting as a technical ceiling.
- Structural Weakness: Failure to reclaim this level limits upside continuation.
- Downside Target: Next high-timeframe support sits near $145, offering potential re-entry interest.
From a technical standpoint, Solana must close decisively above $192 to confirm strength and invalidate the current rejection bias. Until then, price remains vulnerable to a retracement toward lower liquidity zones.
What to Expect:
Expect further consolidation or minor pullbacks while below $192. A rejection from this region could accelerate a rotation toward $145, whereas a confirmed breakout would reestablish a bullish trajectory toward $210–$220.
Solana (SOL): Waiting For Ideal Buy Entry | Could Bounce +30%Looking for a long on SOL coin with our most famous strategy—wait for a break of structure/retest/another break of structure.
More in-depth info is in the video—enjoy!
Swallow Academy

SOL is the next big move? While Bitcoin is in a strong correction, bearish sentiment is reaching the highest levels in recent months, and alts are dropping to zero. It seems like the entire crypto market is dead — but is that really the case?
In fact, SOL is now the most bullish top token on the market, and it may try to update its ATH already this year. Here’s why:
➡️ While Bitcoin has already broken its structure, SOL still maintains its textbook-bullish structure, forming HH and HL.
➡️ The price continues to move in an ascending channel, while Bitcoin long ago broke down its ascending support and went significantly lower.
➡️ Money Flow shows a divergence with the price and an outflow of liquidity since July. But this happened across the market due to profit-taking after the summer rally.
➡️ Supply and demand analysis shows that there is still high demand for SOL even around current prices. Whereas in Bitcoin there is no demand at all until lower levels, and supply significantly prevails there.
➡️ SOL has almost completely closed the GAP from the drop, and a small range remains at $221–$209, which the price may want to test in the near future.
➡️ There is also a huge GAP above, which continues to attract the price.
Conclusion:
While BTC has already played out all catalysts to the maximum and is simply exhausted, with no liquidity to drive the price higher, and ETH’s rally died before it even started, SOL still maintains a bullish structure even in such periods.
🔥 Moreover, more time has passed since its last ATH than for BTC and ETH, since SOL was one of the first to move the market in this cycle. And most importantly — a decision on the SOL ETF is expected in November. I don’t expect billion-dollar inflows right away, but this is definitely a bullish catalyst toward the end of the year.

SOL ; What can be done?Hello friends
Given the decline we had, the price has been moving in an ascending channel for some time now, and now that the price is at the bottom of the channel and is on an important move, we can buy one step with risk and capital management, and in case of further correction, we can buy another two steps down and move with it to the specified targets.
*Trade safely with us*