SOL/USDT) Bullish trend analysis Read The captionSMC Trading point update
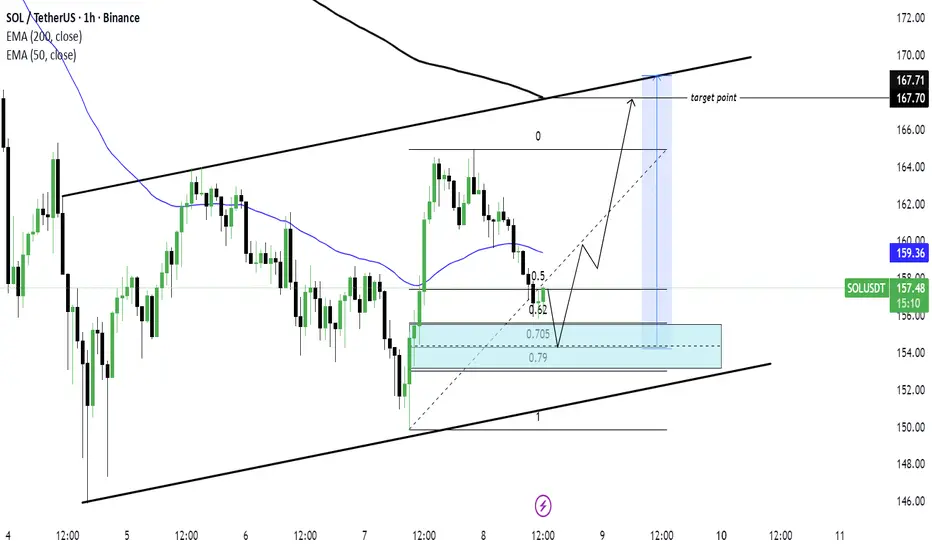
Technical analysis of SOL/USDT (1-hour timeframe) — a potential continuation move within an ascending channel.
Here’s the complete breakdown
---
1. Market Structure
Price is moving inside a rising channel, confirming a bullish structure with higher highs and higher
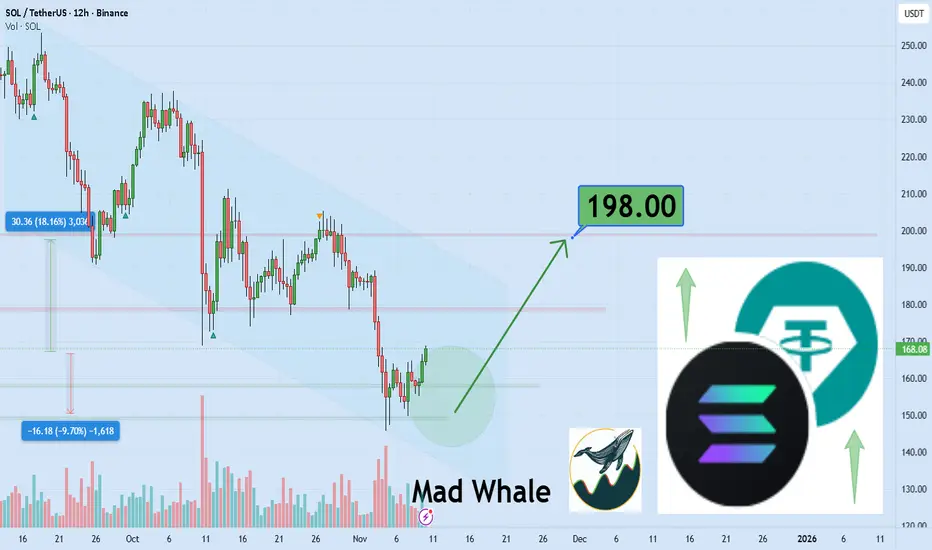
SOL is going to breakout from descending channel 18% gain,to198$Hi the support and resistances on the chart are based on the previous data and weekly candlesticks if BINANCE:SOLUSDT holds this last support the potential of 18% gain is logical toward 198$
SOLUSDT – When Buyers Start to Lose MomentumAfter an exciting short-term rally, Solana is beginning to show signs of losing steam , as buying pressure weakens around the $167–$170 zone — an area aligning with the long-term descending trendline .
The technical picture is tilting slightly in favor of the bears: price has been repeatedly reje

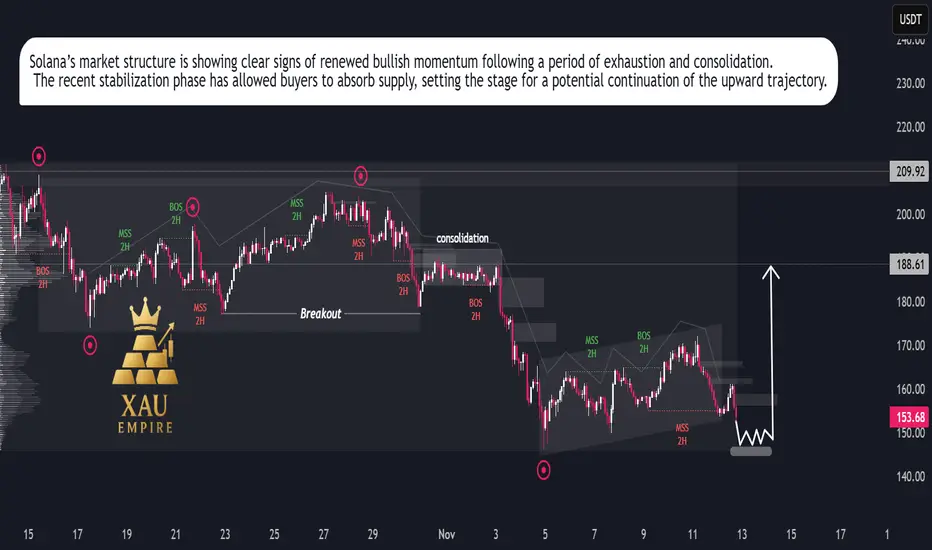
SOL/USDT – Bullish Momentum Rising, Rally Setup in ProgressSolana is showing renewed strength after an extended corrective phase, suggesting that the recent slowdown was a temporary reaccumulation rather than the start of a new downtrend. Price action has begun to stabilize, reflecting growing investor confidence and increasing participation from buyers at
SOL - Enough is Enough!📉After weeks of selling pressure , SOL is finally approaching a massive confluence zone around the $150 round number, which aligns perfectly with a strong weekly support area highlighted in blue.
⚔️This level has historically acted as a major pivot zone , and as long as SOL holds above it, I’ll be

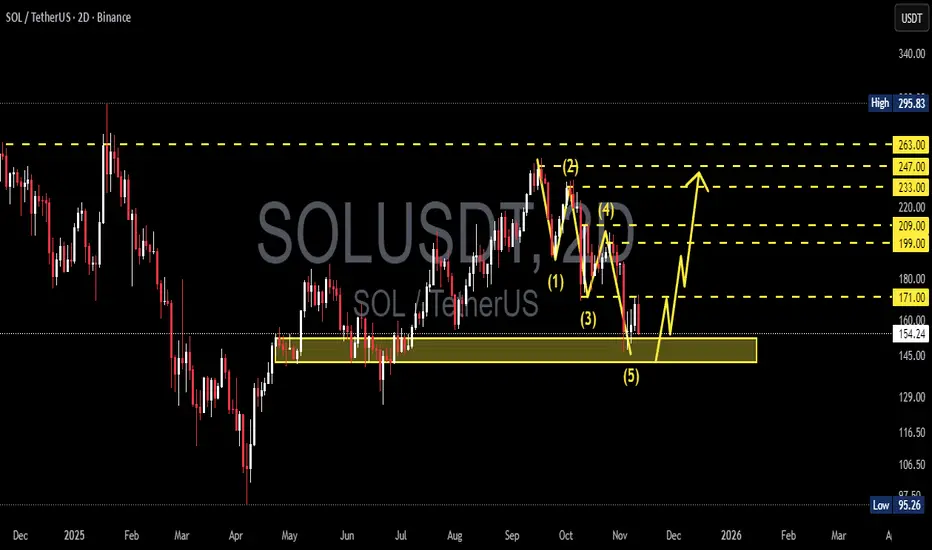
SOL/USDT — Will Solana Start a Major Reversal from Here?Solana (SOL/USDT) is now sitting at a critical turning point, as the market tests a major historical demand zone between 152–142 USDT. After completing a clear 5-wave impulsive decline, sellers appear to be losing momentum, while buyers are starting to react around this key area.
This yellow zone h
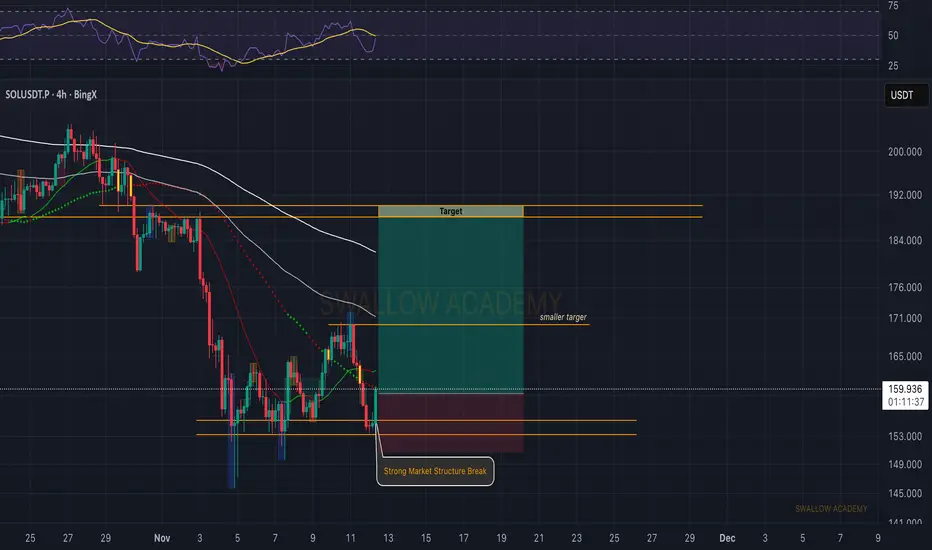
Solana (SOL): Formed Market Structure Break | Bullish TradeSOL showed a strong market structure break near the support area, hinting that buyers might be stepping back in. As long as this zone holds, we could be looking for a short-term bullish movement.
First smaller target sits around the previous minor resistance, while the main target would be the high
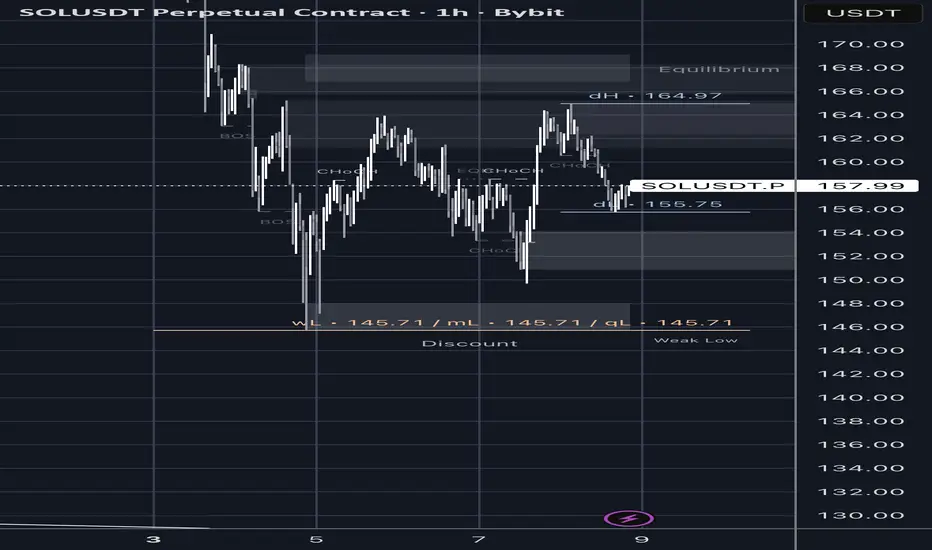
Lingrid | SOLUSDT Buying Opportunity at Psychological LevelThe price perfectly fulfilled my previous idea . BINANCE:SOLUSDT CRYPTOCAP:SOL is testing the lower boundary of market structure after multiple failed attempts to break the descending trendline. Price action shows a clear compression phase above the psychological $150 support, indicating potent

SOLI don’t think CRYPTOCAP:SOL will go any lower from here. It’s sitting on a major support level and looks ready to reverse. In my opinion, this feels like a classic shakeout before the next major uptrend. When everyone least expects it, CRYPTOCAP:SOL will start pushing higher.

SOL to 145 next week.SOL has been having meaningful support from 150 to 160, but when BTC breaches 100k next week we’ll wick to 145 to resume up and this will happen rather quickly. Be quick to catch it.
See all ideas
Summarizing what the indicators are suggesting.
Oscillators
Neutral
SellBuy
Strong sellStrong buy
Strong sellSellNeutralBuyStrong buy
Oscillators
Neutral
SellBuy
Strong sellStrong buy
Strong sellSellNeutralBuyStrong buy
Summary
Neutral
SellBuy
Strong sellStrong buy
Strong sellSellNeutralBuyStrong buy
Summary
Neutral
SellBuy
Strong sellStrong buy
Strong sellSellNeutralBuyStrong buy
Summary
Neutral
SellBuy
Strong sellStrong buy
Strong sellSellNeutralBuyStrong buy
Moving Averages
Neutral
SellBuy
Strong sellStrong buy
Strong sellSellNeutralBuyStrong buy
Moving Averages
Neutral
SellBuy
Strong sellStrong buy
Strong sellSellNeutralBuyStrong buy
Displays a symbol's price movements over previous years to identify recurring trends.