SOLUSDT: Get Ready For 300 Mark, This Time Reversal BigSOLUSDT has the potential to reach the 300 price range once it falls to our buying zone, defined by two horizontal white lines. Upon reaching this area we can target the 300 price level. Please exercise accurate risk management when trading cryptocurrencies.
For further analysis please like and comment.
Team Setupsfx_
Trade ideas

SOLUSDT: Liquidity Tightens – Every Pullback Drops Even Deeper!When talking about Solana right now, the clearest feeling is that the market is losing strength day by day . Recent news shows that SOL has dropped sharply in November, and large capital keeps exiting the market — turning every bounce into an excuse for holders to sell rather than a sign of reversal.
On the H4 chart, SOL is trapped inside a descending wedge , repeatedly rejected by the Ichimoku cloud — an area that has consistently blocked every recovery attempt. Each previous bounce has only led to an even stronger downward leg.
The $130 level is the nearest immediate resistance and also aligns with the descending trendline. If price pulls back to this zone, there is a high probability of fresh selling pressure emerging. When that happens, SOL could continue dropping toward the psychological support at $100 — the key target in the current bearish outlook.
In summary, with both negative news and a weak technical structure, the most reasonable strategy now is to follow the downtrend , wait for price to pull back into resistance to find cleaner entries, and avoid catching bottoms when the market shows no clear reversal signals.

SOL: Bearish Pressure Extends with Targets at 136.50 and 134.00 Hello everyone, SOL is moving within a persistent downside structure — not necessarily dramatic, but consistent and difficult to counter. With the broader crypto market softening, and BTC and ETH entering corrective phases, SOL has very little support to stabilise its price. On top of that, the market is waiting for key US data such as Q3 GDP and inflation figures, both of which could trigger stronger volatility and weigh further on sentiment.
On the H4 chart, the downtrend remains firmly intact. SOL continues to print lower highs and lower lows, confirming that sellers still dictate the direction of the market. Each time the price pulls back into the red FVG zones, selling pressure steps in immediately, pushing the price downward again. The fact that SOL is trading below a thick, downward-sloping Ichimoku cloud reinforces this bearish trend, while Volume Profile highlights heavy liquidity above current levels — a sign that distribution is still unfolding.
Given the current backdrop, the most reasonable scenario is that the decline continues. The 136.50 USD area stands as the first support, marked by a green FVG and dense liquidity — a region likely to attract a short-term reaction. If sellers remain dominant, the next target will be 134.00 USD, a stronger support zone with a higher probability of producing a more meaningful response.
SOL may bounce from these levels, but unless the bearish structure is broken, the advantage remains firmly with sellers. What about you — what signals are you seeing on your own chart?

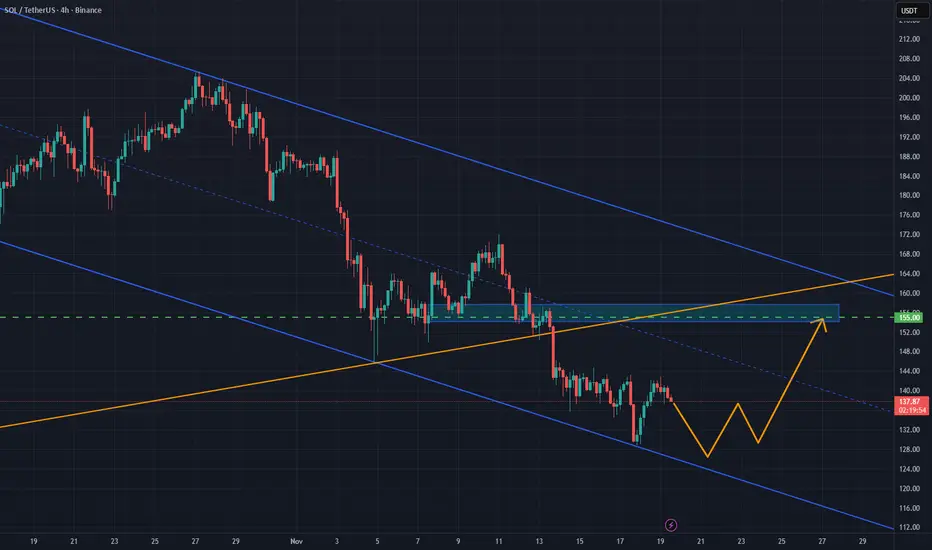
SOL/USDT: Relief Rally Builds After Rebound from Key SupportSOL/USDT bounced strongly from the 128–130 support zone, reacting off the lower boundary of its downward channel. While the broader trend remains bearish, this move signals early signs of accumulation. Holding above 130 could open a corrective rally toward 155, as oversold conditions unwind and short-term momentum favors a relief push.
❗️Risks:
– Losing 128–130 support reopens downside toward 120–115
– Volatility in BTC may cap gains
– Failure to reclaim the channel midpoint may stall the recovery
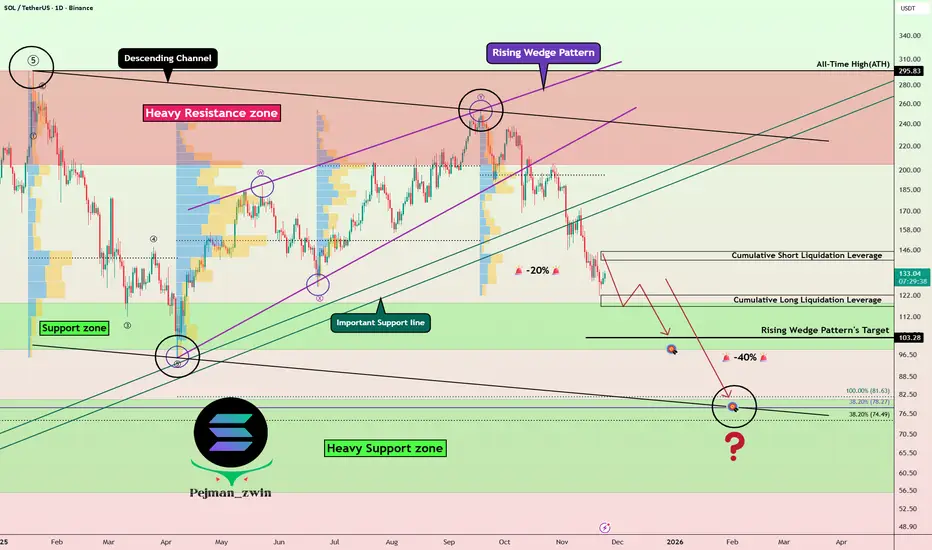
Solana Breakdown Roadmap—Is the Correction Just Getting Started?Today, I analyze the Solana( BINANCE:SOLUSDT ) project and explore its roadmap for the coming days and weeks, so stay tuned!
Solana, with the help of the Rising Wedge Pattern, has successfully broken through its important support lines and is currently moving near the Support zone($118-$98).
From an Elliott Wave perspective, it seems that Solana has completed its five main waves and is now in a corrective phase.
Given the current cryptocurrency market conditions, I expect Solana to break through the Support zone($118-$98) and at least reach the target of the rising wedge pattern, potentially dropping down to $80.
Additionally, it’s worth noting that the SOLBTC( BINANCE:SOLBTC ) pair is also showing a bearish trend, which means that if the broader crypto market declines, Solana could face even greater losses.
First Target: $107
Second Target: $83
Stop Los(SL): $174
Cumulative Long Liquidation Leverage: $122-$119
Cumulative Short Liquidation Leverage: $150-$145
💡 Please respect each other's opinions and express agreement or disagreement politely.
📌Solana Analyze (SOLUSDT), Daily time frame.
🛑 Always set a Stop Loss(SL) for every position you open.
✅ This is just my idea; I’d love to see your thoughts too!
🔥 If you find it helpful, please BOOST this post and share it with your friends.
SOLI do not think we will go lower then this, the support is huge and the setup is too clean. This is one of the best accumulation zones you will ever get.

SOL — Deep Pullback Into Major SupportSOL has been in a steady freefall over the past weeks. On the higher timeframes the key support and resistance zones are very clearly defined. The $250 level acted as a big resistance area, with multiple rejections showing sellers were firmly in control up there.
On the downside, the $125 support zone has shown clear strength, with bulls defending this area and producing strong bounces each time price revisited it.
The swing low at $126 presents an attractive long opportunity, especially with the sell-side liquidity and the quarterly level at $124.54 sitting just below, adding further confluence. Additionally, the anchored VWAP from the $8 low lies around $114, aligning almost perfectly with the 0.886 Fibonacci retracement at $113.3, providing deeper support should price extend lower.
Long Entry Zones:
0.786 Fib: $129.13
0.886 Fib: $113.3
Why the 0.786–0.886 Zone Is a Major Reversal Area
The 0.786–0.886 Fib zone is one of the best spots to look for a reversal after a deep pullback. It’s where strong trends often take their final dip before bouncing.
Here’s why it works so well:
It’s the typical “deep correction” zone in strong trends.
Price usually sweeps sell-side liquidity here before reversing.
Many harmonic patterns use this exact area as their turning point.
It often lines up with anchored VWAPs or volume nodes, adding extra support.
It’s basically the capitulation zone where weak hands exit right before a bounce.
Overall, it’s a clean area with clear invalidation and great R:R → perfect for spotting high-probability reversal setups.
_________________________________
💬 If you found this helpful, drop a like and comment!

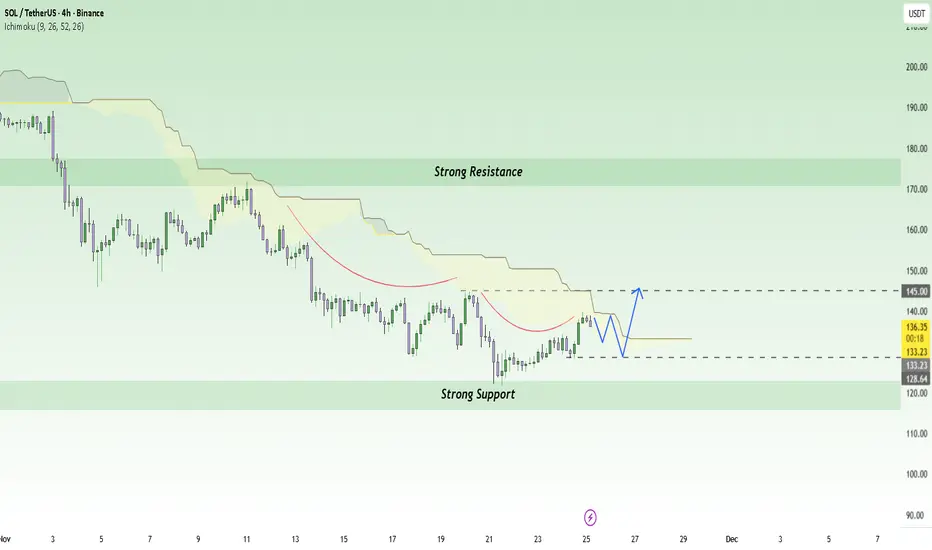
SOL/USDT: Growth Fueled by Inflows and Network ExpansionNews: The Solana spot ETF in the U.S. has seen a significant inflow of capital , with over $476 million USD coming in over 17 consecutive days. At the same time, the Solana network has reported strong revenue growth , reaching around $2.85 billion USD . These factors have bolstered investor confidence in Solana, creating a favorable environment for the upward trend of SOL/USDT.
Chart: On the H4 chart, SOL/USDT is currently trading within a strong uptrend channel , supported by the Ichimoku cloud at 133.23 USD. The price is in the support zone around 128 USD, and there is potential for a strong rebound if it continues to hold above this level. If SOL/USDT maintains this trend, the next target could be 145 USD, where there is strong resistance in the short term.
Outlook: With positive macro factors and a clear technical structure , SOL/USDT could continue its strong uptrend, aiming for the 145 USD resistance level in the near future, as long as the price stays above 128 USD.
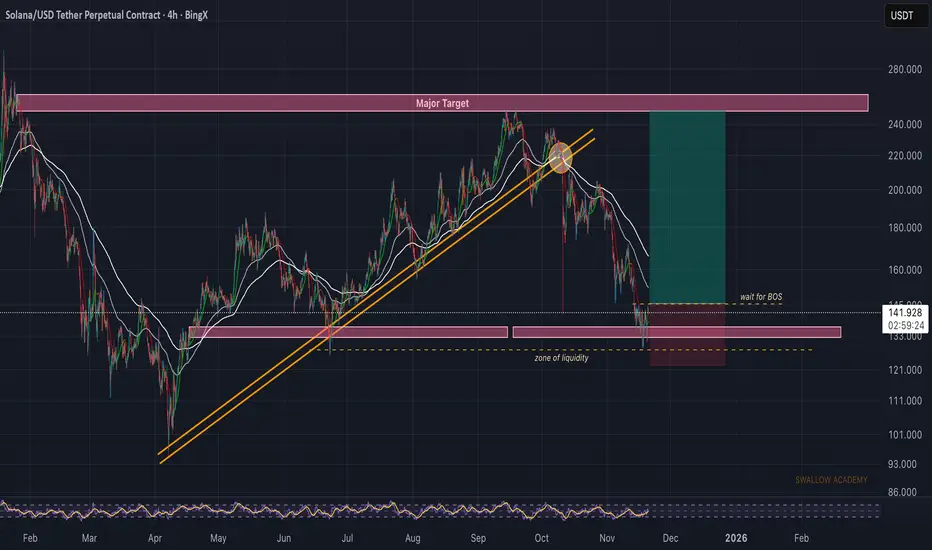
Solana (SOL): Looking For Proper Break of StructureSOL had a decent bounce from a liquidity zone, where buyers showed some reaction. For now we’re waiting for a clean BOS to confirm that buyers are actually stepping back in to fully overtake this area.
If we get that BOS, the plan is simple—look for a retrace entry and aim for the major target above (and maybe the EMAs as well before the major target).
Swallow Academy
SOL first target 200$ and only after breakout 300$As observed on the chart, SOLUSDT has demonstrated significant resilience at the major daily support zone near $110, establishing a solid foundation for the current upward movement. The path toward the $200 resistance level appears well-defined, with the asset showing strong bullish momentum.
However, to advance beyond this level, a decisive breakout above the $200 resistance accompanied by substantial trading volume will be essential. Such a confirmation would signal sustained buying pressure and potentially open the path toward higher targets, with $300 emerging as the next significant technical objective. Until then, the $200 level remains a critical barrier that requires validation before anticipating further expansion.
DISCLAIMER: ((trade based on your own decision))
<<press like👍 if you enjoy💚

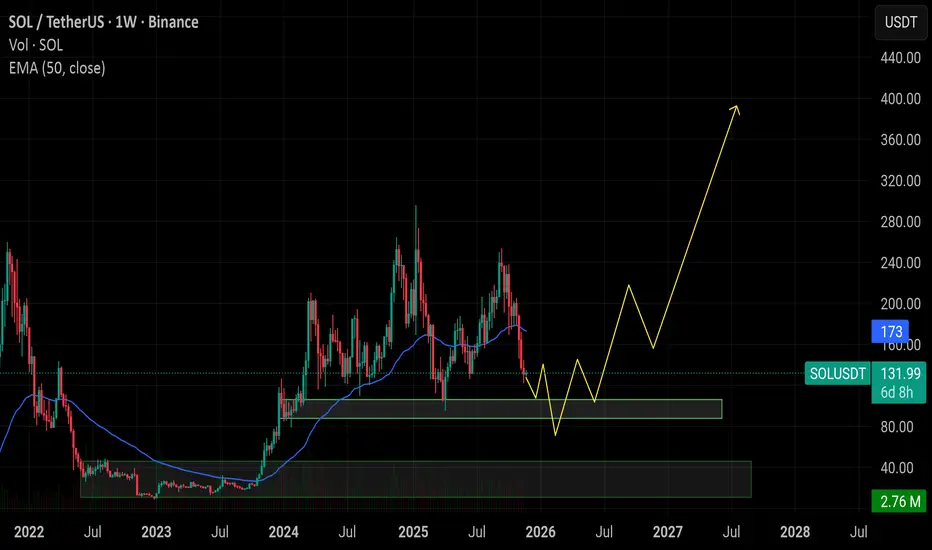
$SOL weekly structure shows a possible liquidity sweep toward CRYPTOCAP:SOL weekly structure shows a possible liquidity sweep toward the green demand zone before trend reversal. Current move looks corrective, not a trend change. If buyers defend the zone, market can enter an accumulation phase leading to a strong bullish expansion toward 2026-27. Long term outlook remains positive as long as the demand zone holds. Patience over panic.
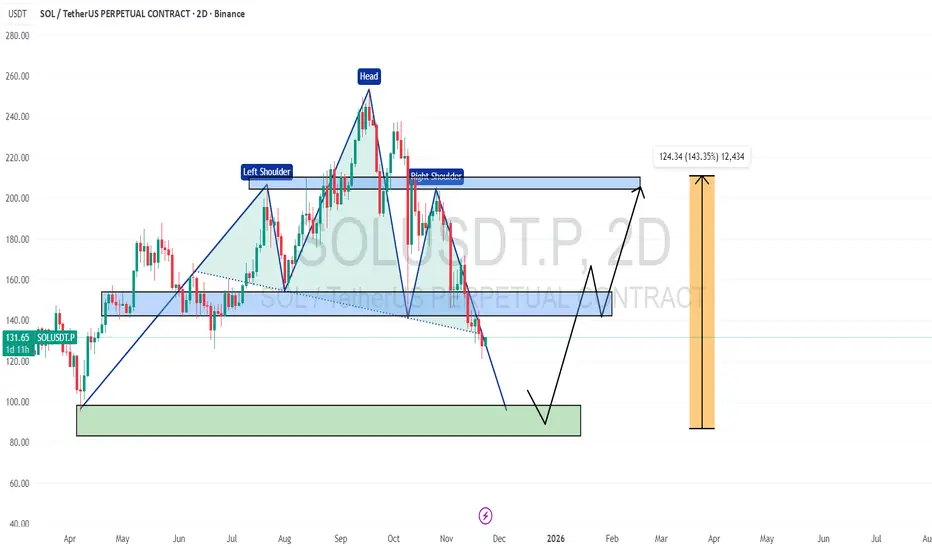
SOL USDT 2D CHART UPDATE 📌 CRYPTOCAP:SOL 2D Chart shows a head & shoulder pattern✅
📌 If this continues, the price may continue to decline ✅
📌 However, a bullish reversal is expected from the support zone below ✅
If this happens, the price may go back to the $150, $200+ range 🔥🚀
trong impulsive move supported by high volumeSOL has broken above a key intraday resistance level with a strong impulsive move supported by high volume. This breakout indicates renewed bullish momentum. After the breakout, price is retesting the structure, offering a clean continuation entry. As long as the retest holds, the bullish trend is expected to extend toward the next liquidity zone. Stop-loss is placed below the breakout structure to protect against a failed retest.
SOL-USDTIt had a good channel breakout and also a good pullback to the $135 level yesterday.
However, right now it's ranging between $135 and $144 🕯
Here, Solana needs to determine its path. If it breaks $144, the next target would be $160 🔼🔼💲💲
And if it goes below $135, the correction could continue down to $127 🔽🔽💲

SOL Short 1D Rebalancing the bearish inefficiency is likely to lead to further development of the downward movement.

SOL USDT SHORT SIGNAL---
📢 Official Trade Signal – SOL/USDT
📉 Position Type: SHORT
💰 Entry Price: 127.28
---
🎯 Take-Profit Targets (Partial Exits)
TP1 = 121.53
TP2 = 116.85
TP3 = 111.66
TP4 = 106.28
TP5 = —
TP6 = —
---
🛑 Stop-Loss: 131.00
📊 Timeframe: —
⚖️ Risk/Reward Ratio: 5.79
💥 Suggested Leverage: 5× – 10×
---
🧠 Technical Analysis Summary
SOL has entered a strong supply zone around 127–129, showing clear signs of weakness and rejection.
Bearish wicks on lower timeframes indicate exhaustion of buyers and a likely downward retracement toward liquidity zones below.
TP levels align with major support levels and liquidity pockets from previous structure breaks.
Momentum indicators are showing bearish divergence, supporting a short setup.
---
⚙️ Trade Management Rules
Take partial profit at TP1
Move Stop-Loss to Break-Even once TP1 is hit
Trail SL gradually as price approaches deeper targets
Avoid re-entry if price hits SL at 131
---
⚠️ Important Risk-Management Note
✔️ When TP1 is hit, the Stop-Loss is moved to the Entry Price (Break-Even).
This is a standard professional risk-management rule.
❗ If the price hits TP1 and later reverses to break-even, this is NOT a loss.
It simply means the trade closed with zero risk after securing progress.
🔐 Our priority is always capital protection before big profits.
---
📌 TradingView Hashtags
#SOLUSDT #SOL #TradingView #CryptoSignal #ShortSetup #TechnicalAnalysis #FuturesTrading #Altcoins
---

Solana monthly head and shoulders pattern Solana is showing a clear head and shoulders on the higher timeframe. A break of the neckline around $125 would see an eventual target of $60. This would represent a 50% reduction in price.

Solana hitting range lows. SOL price has pulled back into a major high-volume demand zone that supported every major rally in 2023–2024. The bearish divergence at the top played out cleanly, and now SOL is sitting on the first real test of this macro block.
Momentum indicators are resetting at historical reversal levels and showing early signs of a shift. As long as SOL holds the upper side of this demand zone, this remains an accumulation area, not a breakdown.
A bounce here sets up a mid-range reversal. A break below the liquidity shelf opens the door to the deeper demand block.
Watching for:
Higher low + momentum flip = bullish confirmation.

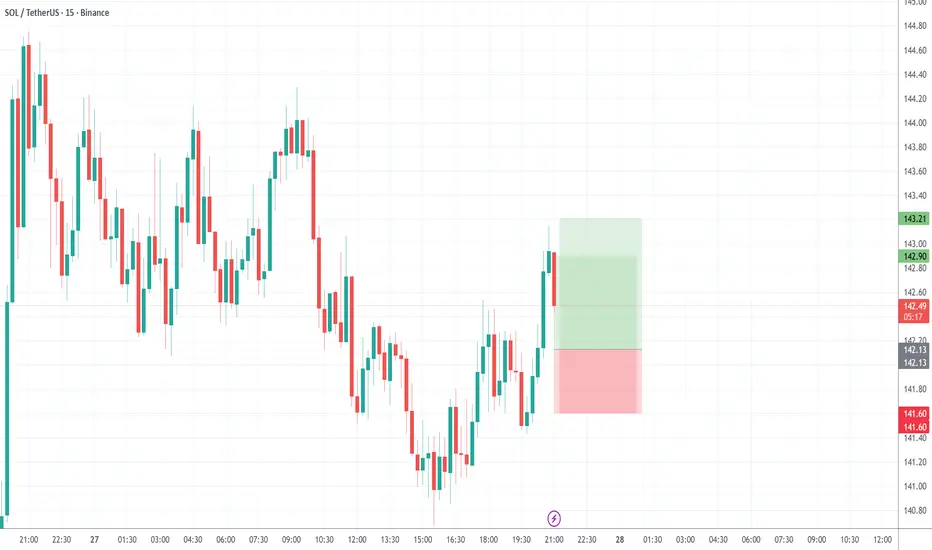
SOL/USDT LONG setup 1️⃣ Support Bounce
buy limit Entry: 142.10 – 142.30
Stop loss: 141.60
TP: 142.90 – 143.20
Confirmation: bullish engulfing / strong rejection wick on 1m
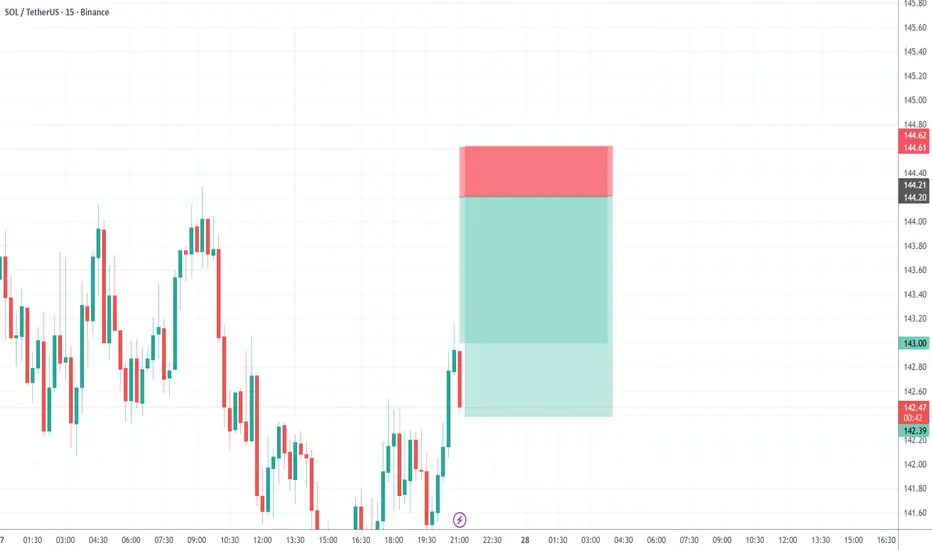
SOLUSDT SHORT Scalping SetupsResistance Rejection
Entry: 143.80 – 144.20
Stop loss: 144.60
TP: 143.00 → 142.40
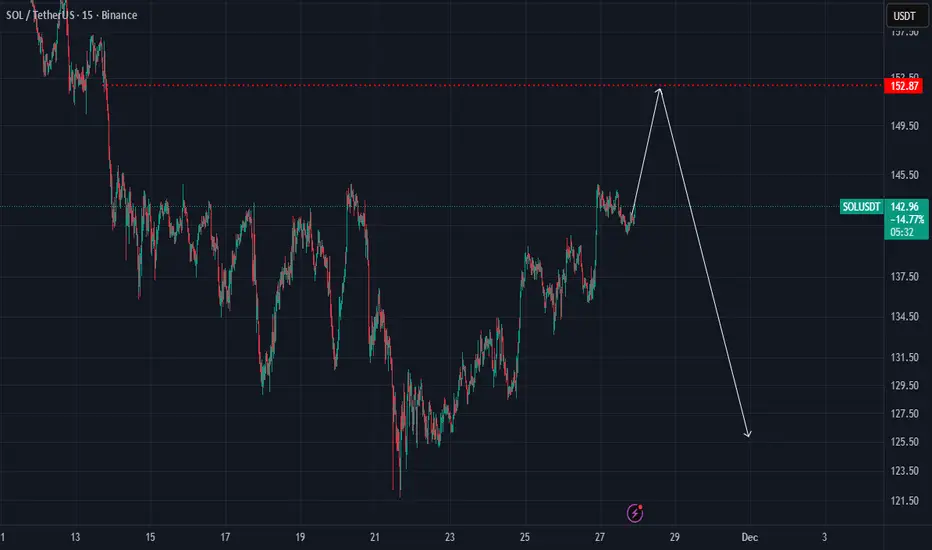
SOL - Time for a pullback SOL - Time for a pullback
Before we take a new short we need a pullback and range
only after we can take a new short trade
Key resistance 171

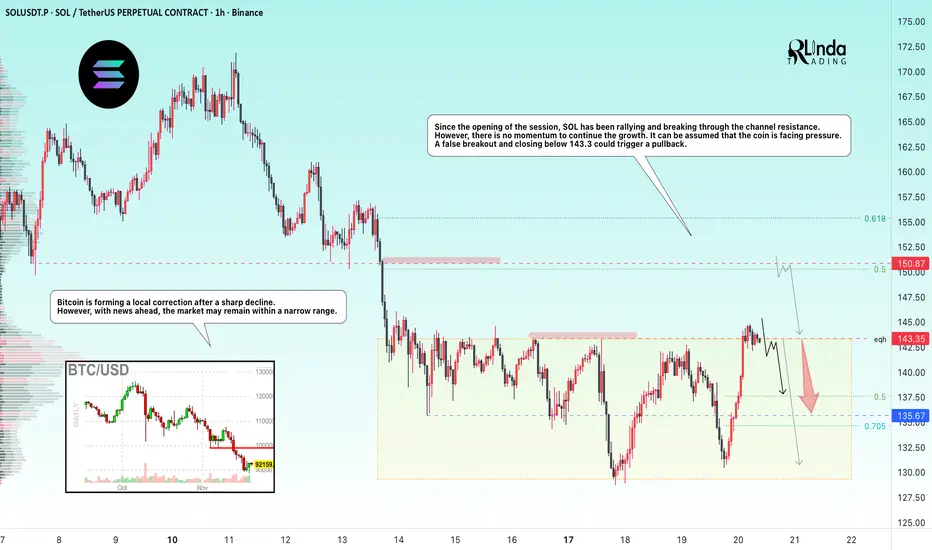
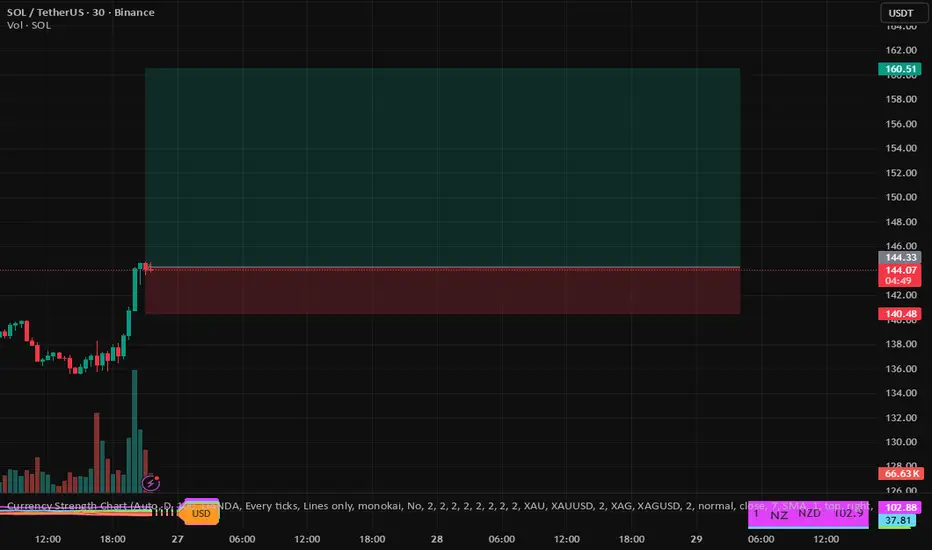
SOLANA → Manipulation - false breakout of resistance BINANCE:SOLUSDT.P flew up to resistance at 143.35 at the opening of the session and attempted to break through it, but bears may not let the price rise ahead of the news...
Bitcoin is forming a local correction after a sharp decline. However, news is ahead and the market may remain within a narrow range.
From the opening of the session, SOL rallies and breaks through the channel resistance, wasting 75% of its intraday growth potential. However, there is no momentum to continue the growth. It can be assumed that the coin is facing pressure. A false breakout and closing below 143.3 could trigger a pullback.
Resistance levels: 143.35, 150.87
Support levels: 135.67, 130.0
Two key levels for countertrend movement: 143.35 - 150.87. If the liquidity pool does not stop the price at the nearest level, then 150.87 can be considered as an additional level for trading a false breakout.
However, news on unemployment is coming soon, and the market may react quite aggressively. Therefore, if there are no trading opportunities before the news, I recommend refraining from action for an hour and waiting out the storm...
Best regards, R. Linda!