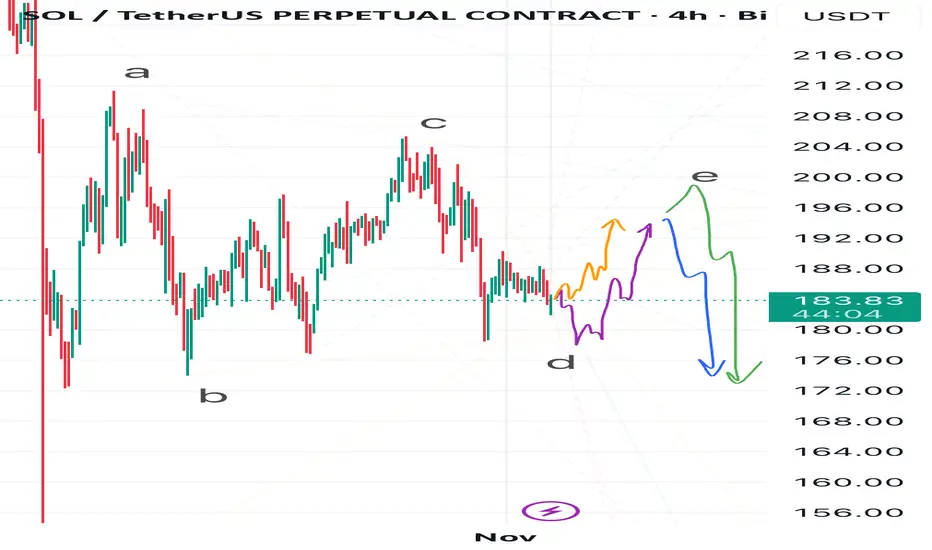
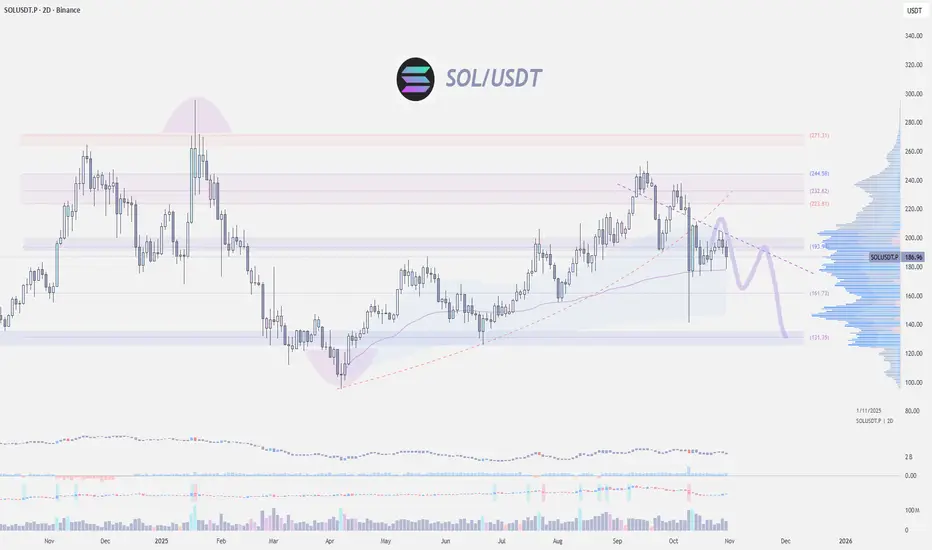
Solana Swing — D or E in the Ring?I see several possible scenarios for Solana at the moment.
In my view, either wave D of the corrective ABCDE triangle has already formed, and the price will follow the orange path, starting to build wave E —
or wave D isn’t complete yet, and Solana might still drop toward 178 or even lower, following the purple path, before beginning wave E.
As for wave E, I also see two possible outcomes:
• The green path, where wave E extends up to around 200,
• Or the blue path, where wave E ends near 194–196, followed by a downside breakout from the triangle, sending Solana toward ~170 or even lower.
💬 Which scenario do you find more likely? Share your thoughts in the comments!
Trade ideas

[SeoVereign] SOLANA BEARISH Outlook – November 03, 2025I would like to share my Solana idea as of November 3.
This idea is an extension of the one from October 27. The short positions entered on the 27th will be closed in profit in connection with this idea, and I plan to add some additional positions at the same time.
Basis — FIBONACCI 0.786 Retracement & Breakdown Around 176 USDT
Currently, Solana is showing a clear breakdown signal after reaching the 0.786 retracement level relative to the previous upward wave (around 176 USDT).
This zone represents a typical transition area where upward momentum becomes exhausted,
indicating the potential for a trend reversal.
Accordingly, I set the average target price around 154 USDT.
Further position management and updates will be provided depending on market developments.
Thank you for reading.

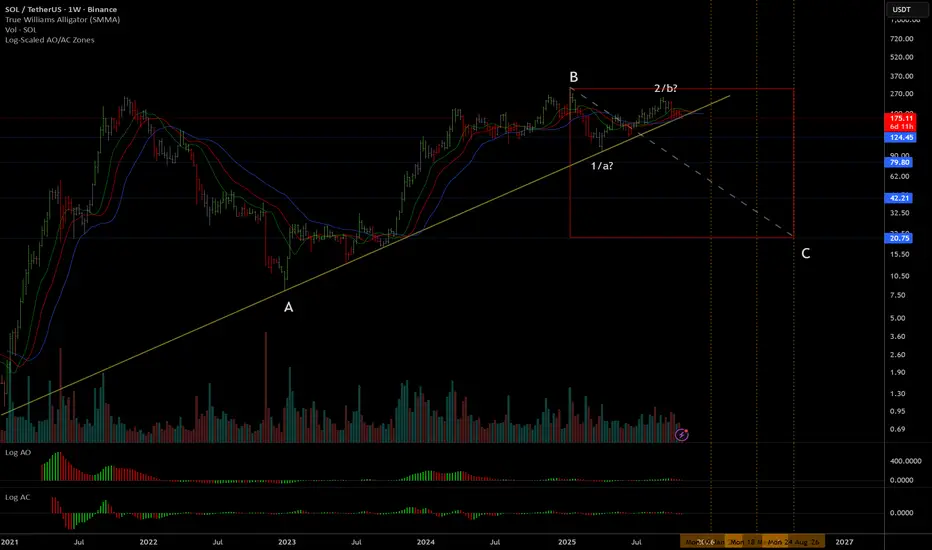
Solana Multi-Year BreakdownSOL is breaking down from this multi-year trendline which has 4 solid touch points. It's difficult to say how low it will go, worst case is probably around $20, but there are definitely other paths it could take as well.
Without forecasting the exact future price, I will say that probabilities are favoring a continuation of the downtrend which began in January after Trump launched his memecoin on Solana.
After we see how fast and far this drops, we can probably get a better idea of what is developing here. Right now, it looks like wave-B ended in January, and we are in a very large wave-C now, but there are some other possibilities as well. The wave-B possibility is closest to the middle so that's the one I am favoring now.
#SOL/USDT The Next Explosion, Hidden Clues in Price Behavior
#SOL
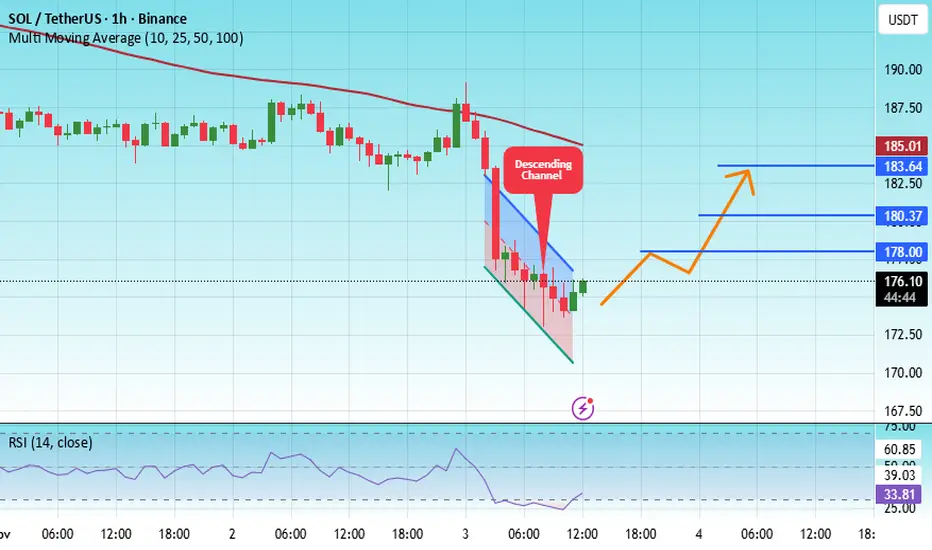
The price is moving within an ascending channel on the 1-hour timeframe and is adhering to it well. It is poised to break out strongly and retest the channel.
We have a downtrend line on the RSI indicator that is about to break and retest, which supports the upward move.
There is a key support zone in green at 172.80, representing a strong support point.
We have a trend to stabilize above the 100-period moving average.
Entry price: 175.50
First target: 178
Second target: 180
Third target: 183
Don't forget a simple money management rule:
Place your stop-loss order below the support zone in green.
Once the first target is reached, save some money and then change your stop-loss order to an entry order.
For any questions, please leave a comment.
Thank you.
Solana — Triangle Tale Before the Pale As you might remember from my previous publications, I’m expecting Solana to decline toward 164 and possibly even lower.
At the moment, I’d like to see it around 178, and depending on how the move toward this level develops, I’ll decide on my next steps — which you’ll see in my upcoming updates.
I have a thought that after reaching 178, Solana might move upward first, forming a corrective triangle, and only later drop to 164 or even below.
The invalidation zone for the current plan is marked in red on the chart.
📉 Follow me so you don’t miss my next analyses and scenario updates

SOL USDT LONG SIGNAL---
📢 Signal Alert
🔹 Pair: SOL / USDT
📈 Trade Type: Long
💰 Entry Zone: 175.75
🎯 Take-Profit Targets:
TP1 = 178.53
TP2 = 182.14
TP3 = 187.54
🛑 Stop-Loss: 171.69
📊 Timeframe: 1H
⚖️ Risk/Reward Ratio: ≈ 3.0
📌 Suggested Leverage: 5x–10x
🔄 After TP1 is reached, move Stop-Loss to Entry to secure profits.
---
🧠 Technical Analysis Explanation
SOL is showing strong bullish continuation momentum after bouncing from the 171.50 demand zone, where buyers stepped in aggressively.
The market has broken above the short-term descending channel, confirming a trend reversal on lower timeframes.
The entry level at 175.75 aligns with the retest of the breakout zone and the EMA 50, which acts as dynamic support.
RSI has crossed above 50, indicating renewed bullish momentum, while volume shows increasing buyer participation.
Take-profit levels are based on major resistance zones and Fibonacci extension projections from the last impulse move.
The stop-loss at 171.69 is set just below the key support area to prevent losses in case of a false breakout.
---
⚙️ Trade Management Tip:
Always confirm entry with a bullish candle pattern (e.g., engulfing or hammer) before executing.
Use partial take-profits and adjust your stop-loss progressively as price advances toward higher targets.

SOL-USDTAnd again reaching the bottom of $175
If the consolidation candle closes above this level again 💰💰
The price will have the ability to return to $200
To enter the long, confirmation and consolidation must occur

Solana going to rise very fast over the next few days, 235-245Divergences and strength of the come back in now in the 6hr charts are going to lead to a surge in prices again as we possibly even go to a new high from here with Solana and BTC possibly

SOL/USDT Update — Bullish Trend Structure and Resistance Ahead“🚨 Solana vs Tether: Bullish Heist on SOL/USDT 💰”
📊 Description
Market: SOL/USDT
Bias: Bullish (Swing / Day Trade)
✅ Trade Plan
Entry: 🎯 Any good support / demand area — stay alert & flexible.
Stop Loss: 🛡️ “Thief SL” @ 160.00 USDT — this is my SL, not yours. Manage your own risk!
Targets (TP):
• 🎯 Target 1: 215.00 USDT
• 🏁 Target 2: 240.00 USDT
⚠️ Heads up: Use your discretion. Do not blindly follow my SL/TP — trade responsibly, at your own risk.
🔍 Key Insights / Logic
🚧 Expect resistance & traps near 215–240 — don’t get stuck in overbought zones.
📈 Momentum is building; structure is favorable on retests.
🔊 Watch volume on impulsive moves — rising volume = strength.
🔄 Related pairs / correlation watch:
• BINANCE:SOLBTC — strength vs BTC strengthens the bullish case.
• BINANCE:ETHUSDT — altcoin momentum may carry SOL upward.
• BINANCE:BNBUSDT — BNB strength can support ecosystem flow.
✨ “If you find value in my analysis, a 👍 and 🚀 boost is much appreciated — it helps me share more setups with the community!”
#SOL #SOLUSDT #Solana #CryptoSwing #CryptoDayTrade #AltcoinAnalysis #TradingViewIdeas #CryptoFun

SOLUSDT – Is the Sun Rising Again for Solana?Solana found strong footing,and bulls seem to be warming up again 🔥
But careful if it slips back below 174.60, the sun could set a bit earlier than expected 🌅😅

Reserves and Their Role in Controlling InflationIntroduction
Inflation — the sustained rise in the general price level of goods and services — is a central concern for every economy. When prices rise too quickly, purchasing power declines, savings lose value, and economic uncertainty increases. To manage inflation, policymakers and central banks rely on several tools, and reserves play a crucial role among them.
Reserves, in an economic and financial sense, refer to the assets or holdings that a central bank or a nation keeps to stabilize its currency, support the banking system, and influence liquidity in the economy. They are the backbone of monetary policy — providing a safety net during crises and a lever to control inflationary or deflationary pressures.
This article explores what reserves are, the types of reserves, how they interact with the broader economy, and most importantly, how they are used as instruments to control inflation.
1. Understanding Reserves
1.1 Definition
Reserves are the portion of assets that financial institutions or nations hold and do not actively circulate in the economy. They are typically kept in the form of:
Foreign exchange reserves (foreign currencies, gold, IMF Special Drawing Rights)
Bank reserves (funds held by commercial banks with the central bank)
Strategic reserves (such as oil or commodities held by governments for stability)
Monetary reserves (central bank’s holdings that back the issuance of currency)
In the context of inflation control, foreign exchange reserves and bank reserves are most relevant.
2. Types of Reserves and Their Economic Importance
2.1 Bank Reserves
Bank reserves refer to the cash or deposits that commercial banks hold with the central bank. These reserves are essential for meeting withdrawal demands, ensuring liquidity, and adhering to regulatory requirements.
Required Reserves: The minimum percentage of deposits that banks must hold and not lend out, set by the central bank.
Excess Reserves: Any reserves that banks hold beyond the required minimum.
2.2 Foreign Exchange Reserves
Foreign exchange reserves are assets held by a central bank in foreign currencies. These reserves include:
U.S. dollars, euros, or yen
Gold holdings
IMF’s Special Drawing Rights (SDRs)
These reserves help stabilize a nation’s currency and manage exchange rate volatility, both of which directly affect inflation levels.
2.3 Strategic Reserves
Governments often maintain reserves of essential commodities like crude oil, food grains, and fertilizers. These strategic reserves protect the economy from supply shocks, which could lead to cost-push inflation if shortages occur.
3. How Reserves Influence Inflation
Reserves act as a monetary control mechanism. By adjusting reserve requirements, managing liquidity, and using foreign reserves strategically, a central bank can control money supply — the key driver of inflation.
3.1 The Link Between Money Supply and Inflation
According to the Quantity Theory of Money, expressed as:
MV = PQ
Where:
M = Money supply
V = Velocity of money
P = Price level
Q = Output
If money supply (M) increases faster than economic output (Q), prices (P) rise — leading to inflation.
Hence, controlling money supply via reserves becomes a vital anti-inflationary tool.
4. Mechanisms: How Reserves Help Control Inflation
4.1 Reserve Requirement Ratio (RRR)
The reserve requirement is the percentage of deposits that banks must hold with the central bank and cannot lend.
When inflation is high, central banks increase the reserve ratio, reducing banks’ capacity to lend.
→ This decreases money supply and dampens spending, cooling inflation.
When inflation is low or the economy is slowing, the ratio is reduced to encourage lending and spending.
For example, if the Reserve Bank of India (RBI) raises the Cash Reserve Ratio (CRR), commercial banks have less liquidity to issue new loans, thereby reducing credit growth and inflationary pressure.
4.2 Open Market Operations (OMO)
Central banks use reserves to buy or sell government securities:
Selling securities → absorbs liquidity → reduces money supply → controls inflation.
Buying securities → injects liquidity → increases money supply → combats deflation.
Thus, OMOs are a dynamic way of using reserves to regulate inflation without drastic policy shifts.
4.3 Managing Foreign Exchange Reserves
Foreign reserves can indirectly control inflation through exchange rate management:
When a currency depreciates, import prices rise, increasing inflation (imported inflation).
Central banks can use foreign reserves to buy their own currency, strengthening it and reducing inflationary pressure.
Conversely, when inflation is low, the central bank may allow the currency to weaken slightly to boost exports and growth.
4.4 Sterilization Policy
When a country experiences large foreign capital inflows, it increases domestic money supply and may fuel inflation.
To counter this, central banks conduct sterilization — selling government securities to absorb the excess liquidity created by foreign inflows.
4.5 Interest Rate Adjustments Using Reserves
Reserves influence interbank liquidity, which affects interest rates.
When reserves are high, liquidity is ample, and short-term rates fall — boosting spending.
To control inflation, the central bank may reduce liquidity (through higher CRR or OMO sales), pushing up rates and discouraging borrowing.
5. Case Studies: Reserves in Action
5.1 India – Reserve Bank of India (RBI)
The RBI actively uses CRR and Statutory Liquidity Ratio (SLR) to control inflation.
For instance:
During the 2010–2011 period, when inflation crossed 9%, RBI raised CRR to restrict liquidity.
Conversely, in 2020 (pandemic period), RBI reduced CRR from 4% to 3% to ease liquidity and support economic recovery.
Additionally, RBI manages over $650 billion in forex reserves, which it uses to stabilize the rupee and prevent imported inflation caused by a depreciating currency.
5.2 United States – Federal Reserve System
The U.S. Federal Reserve influences inflation through reserve balances and open market operations.
During high inflation (e.g., post-2021 pandemic period), the Fed reduced excess reserves in the banking system through Quantitative Tightening (QT) — selling bonds and raising interest rates to control money supply.
5.3 China – People’s Bank of China (PBOC)
China maintains one of the world’s largest foreign exchange reserves (over $3 trillion).
It uses these reserves to:
Stabilize the yuan’s exchange rate
Control import-export price volatility
Manage inflation driven by currency movements
6. Relationship Between Reserves and Exchange Rate Stability
Exchange rate stability is directly linked to inflation control.
A strong domestic currency reduces the cost of imported goods and keeps inflation low.
A weak currency, on the other hand, makes imports expensive, triggering inflation.
By holding substantial forex reserves, central banks can intervene in currency markets — buying or selling domestic currency to maintain a stable exchange rate and prevent inflationary shocks.
7. The Role of Gold and Commodity Reserves
Gold reserves historically backed national currencies and still act as a hedge against inflation.
When inflation rises globally and fiat currencies lose value, central banks often increase gold reserves to preserve asset value and stability.
Similarly, commodity reserves like oil and grains help governments buffer supply-side shocks, which are a major cause of inflation spikes (e.g., oil crises or food shortages).
8. Challenges and Limitations
While reserves are powerful tools, their use in inflation control faces several challenges:
8.1 Limited Effectiveness in Supply-Side Inflation
Reserves can control demand-pull inflation (caused by excessive spending) but are less effective against cost-push inflation (caused by supply shocks like oil price hikes).
8.2 Risk of Over-tightening
Excessive tightening through high reserve requirements or OMO sales can stifle credit growth and economic expansion, leading to recession.
8.3 Foreign Exchange Volatility
Using forex reserves for inflation control via currency stabilization can deplete reserves quickly if global market pressures persist.
8.4 Sterilization Cost
Sterilization operations (offsetting capital inflows) can be expensive and may strain central bank balance sheets.
9. Coordinated Use of Reserves and Other Tools
For effective inflation management, reserves are used in conjunction with:
Interest rate policy
Fiscal discipline
Supply-side reforms
Targeted liquidity management
A well-coordinated monetary-fiscal framework ensures that reserves act as a stabilizing force rather than a reactive one.
10. Future Outlook: Reserves and Inflation in the Global Economy
In today’s interconnected world, inflation control is not just a domestic concern.
Global commodity prices, exchange rate fluctuations, and capital flows can all influence inflation levels.
As digital currencies, blockchain-based payment systems, and cross-border trade evolve, the composition and management of reserves will also transform.
Central banks may diversify away from traditional reserves like the U.S. dollar and hold multi-currency baskets, digital assets, or even climate-linked reserves to ensure sustainable control of inflation.
Conclusion
Reserves — whether held by central banks, governments, or financial institutions — form the foundation of monetary stability. They serve as both a defensive shield and an active instrument in combating inflation.
By managing bank reserves, foreign exchange holdings, and strategic commodities, policymakers can influence liquidity, exchange rates, and overall price stability.
However, the effectiveness of reserves depends on timely policy coordination, global conditions, and domestic fiscal discipline.
In essence, reserves are not merely a pile of assets — they are a reflection of a nation’s economic strength, policy credibility, and capacity to maintain price stability. Through prudent reserve management, central banks can ensure sustainable growth while keeping inflation under control — achieving the delicate balance every economy strives for.
Solana Price Action Turns BearishSolana’s market structure shows a gradual weakening of bullish momentum after an extended upward phase earlier in the month. The asset experienced a breakout that temporarily fueled optimism among traders, but recent sessions indicate a loss of strength as sellers began to dominate. The volume profile suggests that market participants are shifting focus from accumulation to potential distribution, reflecting caution ahead of broader market developments.
Price movements over the past few weeks show that Solana has transitioned from impulsive bullish waves into a corrective environment. This phase reflects uncertainty and potential repositioning by large holders. The consolidation seen mid-cycle indicates a period of balance before a directional move resumes. Current activity implies that short-term liquidity adjustments are occurring, and volatility may expand in the coming sessions.
Market sentiment remains sensitive, with investor confidence depending largely on macroeconomic flows and digital asset liquidity trends. Solana’s performance continues to mirror broader crypto risk appetite, where speculative behavior is being tempered by cautious profit-taking. If momentum continues to decline, extended corrective movement could unfold as participants await new catalysts.
Overall, the report indicates that Solana is entering a controlled phase of distribution where institutional participants may be preparing for another medium-term adjustment in valuation.

sol-usdtIt has had a good rise from its well-known support at $175.
For this rise to continue towards $197, the $190 level needs to be broken to activate the $197 to $200 target 📈
Solana's short-term supports are $183 and then the $175 floor.

SOLANA BUY Between : 170$ - 100$ and HOLD For Long term
Please support the idea by pressing the like button and writing your opinion in the comment box
Good Luck 🤍
Old Signal 👇🏻

SOL (4-HOUR): TRIANGLE breakout, RETESTED, UPTRENDCRYPTOCAP:SOL zoomed in on the 4-HOUR chart is looking much better than most major cryptos. In an UPTREND after a TRIANGLE #Breakout and with a HIGHER LOW on the pattern's upper trendline.
Once again, lots of SUPPORT below, all kinds of it. It's ready to start a new cycle upwards, no ELLIOT WAVE count yet though, but the correction seems to be complete.
Obviously, a lot depends on CRYPTOCAP:BTC , so hopefully no dip below the 200 MA there. There could be a potential flash-crash in the market, so my STOP loss is manual, using candle closes (below $170) rather than a set level.
My targets will be based on ELLIOT WAVES once a solid count appears, but for now, I'm watching these levels: $206 (rejection here again could be brutal, and breakout above a volatile one), $234 (TRIANGLE target), and the zone between $254 and $264.
We’ll see how it goes — easy with the stakes, lots of chaos in the markets, no PCE numbers today due to the GOVERNMENT #shutdown in the US.
💙👽

SOL/USDT: Bearish Channel Holds as Price Faces Mid-Range ResistSOL/USDT is consolidating inside a downward channel, with a clear sequence of lower highs and impulse legs defining the structure. Price is currently hovering near mid-range resistance, showing hesitation below the descending trendline.
A rejection at this level could lead to a move back toward the $169 support, completing the projected downside leg. The broader tone remains bearish while channel boundaries continue to guide and limit momentum.

$SOL (4-HOUR): LONG $187, reasoning. CRYPTOCAP:SOL has had $154M in #ETF inflows this week, not bad for the first few days on the market. But this is not a reason for a LONG ($187) I have just opened.
The original plan was to LONG the $205 breakout for a while, but a HIDDEN BEARISH RSI divergence flashed and the $205 resistance got retested, printing a LOWER HIGH again, and the price dipped to retest the 200 MA + the ascending trendline (confluence of SUPPORT).
It was the 4th retest this month and it has been solid, each time giving us a HIGHER LOW as well.
I highlighted in light-blue also a horizontal SUPPORT ZONE and #solana has been sitting inside of it, so there is plenty of support of all kinds, including a GOLDEN POCKET ($172 - $176).
A sequence of 2 HIDDEN BULLISH OBV divergences triggered this LONG at the end.
And below the pocket is where I would EXIT this trade — 2 or 3 candle closes (4-hour ones, not the daily ones) and I'm out.
I also highlighted an interesting fractal of price action: notice the Q4 2024 resemblance to the current behaviour — DOWNTREND toward the same horizontal support ZONE supported by the 200 MA, followed by a huge SURGE.
This is quite a risky trade due to the general market circumstances, and I will monitor the reaction very closely around $200 again, and possibly add to size on a BREAKOUT as originally intended.
💙👽
#long

$SOL (DAILY): LON $187 (STOP LOSS: below $170)Longing CRYPTOCAP:SOL here at $187.
Reasoning within 30 minutes in the next post.
Modest stake, SL: two 4-hour candles below $170.
💙👽

Solana at a Make-or-Break LevelSolana couldn’t sustain momentum above $200 and now holding the critical level $170.
CRYPTOCAP:SOL is sitting at a make-or-break level — failure to reclaim the $200 zone or a clean break below $170 would be a concerning signal for bulls.
A decisive breakdown below this area could trigger a deeper retracement toward $150, with the worst-case scenario being a full retest of the $130 range — aligning with the previous demand zone and high-volume node.
SolanaPrice of Solana has formed a bullish triangle. A classic target would be at around $400. But if it's alseason now like on ZCash then the target should be way higher.

SOL (31/10/25 - Long position) TP1($189.98) - filled "Single Prints" from 30/10/25
TP2($193.64)- confluence (Oct. POC + weekly VWAP + previous week VAH + crucial Fibonacci on 4h time frame), good level to Scalp short if not crazy buying volume (depends on the context)
TP3($199.99) - psychological level, October's VWAP, weekly POC, 4h time frame fibonacci confluence
SL($175.00)

SOL-USDTWith the correction of Bit
Solana also came to test $175 once again and this support prevented the correction well again 🕯🕯
If nothing special happens in the crypto market, it can continue to rise like a flash towards $197-200
