SOL USDT LONG SIGNAL---
📢 Official Trade Signal – SOL/USDT
📈 Position Type: LONG
💰 Entry Price: 131.34
---
🎯 Take-Profit Targets (Partial Exits):
TP1 = 133.70
TP2 = 136.87
TP3 = 140.35
TP4 = 143.90
TP5 = —
---
🛑 Stop-Loss: 128.00
📊 Timeframe: 15m
⚖️ Risk/Reward Ratio: 4.47
💥 Suggested Leverage: 5× – 10×
---
🧠 Technical Analysis Summary
SOL is currently showing strong bullish momentum after holding the 131.00 support zone and forming a clean higher-low structure on the 15m timeframe.
Buyers are stepping back in as price pushes above short-term EMAs, creating a favorable long opportunity.
Liquidity pools sit above 133.70 and 136.87, making TP1 and TP2 highly probable targets.
A breakout through 136.87 may fuel continuation toward 140.35 and higher liquidity at 143.90.
Market structure remains bullish unless price closes below the 128.00 invalidation zone.
---
⚙️ Trade Management Rules
✔️ Take partial profit at TP1
✔️ Move SL to Break-Even once TP1 is hit
✔️ Trail SL as price approaches upper targets
✔️ Avoid re-entry if SL gets hit
✔️ Always confirm short-term market structure before entering
---
⚠️ Risk-Management Note
Once TP1 is reached, moving SL to Break-Even is essential.
If price reverses and tags BE, the trade ends with zero loss, fully protecting capital.
🔐 Capital protection is priority #1.
---
📌 TradingView Hashtags
#SOLUSDT #SOL #CryptoSignal #LongSetup #TradingView
#TechnicalAnalysis #FuturesTrading #Altcoins
--
Trade ideas

SOLANASOLUSDT 📉4H
SELL
Entry 135
SL 144
TP 113
Should you find this analysis insightful, I invite you to like or leave a comment. Constructive feedback and suggestions are greatly appreciated. For further analyses, please follow me at @ydnldn.

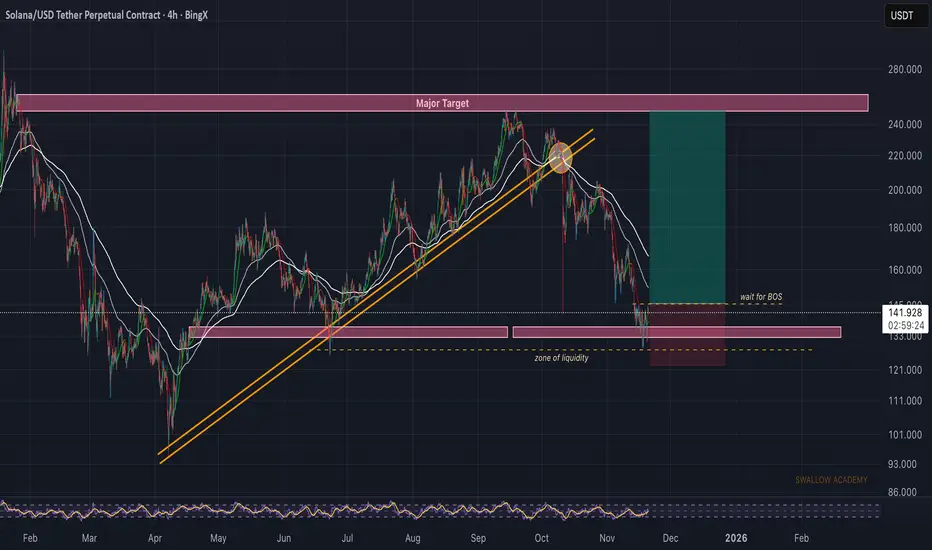
Solana (SOL): Looking For Proper Break of StructureSOL had a decent bounce from a liquidity zone, where buyers showed some reaction. For now we’re waiting for a clean BOS to confirm that buyers are actually stepping back in to fully overtake this area.
If we get that BOS, the plan is simple—look for a retrace entry and aim for the major target above (and maybe the EMAs as well before the major target).
Swallow Academy
SOL/USDT: Strong Uptrend – Short-Term Buy Opportunity!We are witnessing an excellent opportunity on the SOL/USDT chart, as Solana (SOL) continues to maintain a strong upward trend. In the context of a gradually stabilizing cryptocurrency market and positive news about Solana's ecosystem development, SOL is entering a significant price increase phase.
Currently, SOL/USDT is trading within an ascending channel and has broken out of the 140.00 support zone . The price is fluctuating around 143.66, close to the 140.00 support, which could see a slight pullback before continuing the upward momentum.
The next target for SOL/USDT in the short term is 155.00, where it might encounter some resistance. However, if the price maintains above 140.00, there is a high probability that SOL could continue its strong upward momentum towards 156.00 and even beyond.
Trading Strategy:
Buy SOL around the 140.00–143.00 range, with a short-term target of 155.00 and 156.00.
Set stop-loss if the price breaks below 139.00, as this is a crucial support level within the current uptrend channel.
In conclusion, SOL/USDT is maintaining a solid uptrend, and with positive signals from both technical indicators and fundamental factors, buying around the support zone is a reasonable strategy to capitalize on the upward movement.

solusdt can start bullish SOL can start a bullish move from 123.44. The 94.66 level is a critical zone.

Lingrid | SOLUSDT Critical Support Zone Reversal WatchBINANCE:SOLUSDT rebounded from the 128–130 support zone after a clean reaction on the lower boundary of the downward channel. The market structure still leans bearish overall, but the recent rebound above the 130 signals early accumulation pressure. If price maintains support above 130, a corrective rally toward the 155 resistance zone becomes the next likely scenario as oversold conditions unwind. Broader momentum suggests a short-term bullish relief move since the market is approaching major demand zone.
⚠️ Risks:
Losing the 128–130 support zone may reopen downside toward 120–115.
Strong BTC volatility could limit the strength of any bounce.
Failure to reclaim midpoint levels of the channel may stall bullish attempts.
If this idea resonates with you or you have your own opinion, traders, hit the comments. I’m excited to read your thoughts!

SOL : MAYBE BUY...Hello friends
Well, you see that after the heavy price drop, buyers entered and broke several key resistances, and now there is a clear triangle left, which if broken by the buyers, the price can move to the targets specified.
Please note that this is not a buy or sell signal and is only reviewed from a technical perspective, so observe risk and capital management and avoid emotional behavior.
*Trade safely with us*

SOL/USDT (30-minute)..
✅ Targets Visible on My Chart (Already Marked by me)
My TradingView chart for SOL/USDT (30-minute) shows two downward “Target Points” marked with blue arrows:
1. First Target Zone:
• Around $128 (approx).
• Marked just below the current price break of the trendline.
2. Second / Deeper Target Zone:
• Around $120–121.
• This is the larger measured move shown by the longer blue arrow.
🧭 What the Chart Suggests (Just Based on What I Drew)
Price appears to have broken the ascending trendline.
Targets seem to be drawn using a measured-move / range projection.
Cloud (Ichimoku) shows price dipping into bearish zone


SOL-USDT
It has already grown to its target at 144.
Right now, it's under an important resistance.
There are two scenarios ahead ✌️
One is breaking the marked resistance and rising towards the next target at $157 🔼🔼
The second scenario is that it gets rejected from this resistance and consolidates below it, which means a correction back to 135 is possible again 🔽🔽
So we need to wait for either a breakout or a failure at a lower timeframe 📊📊💲💲


SOLCRYPTOCAP:SOL has $215 as the next key resistance level. Once that breaks, the structure opens up cleanly and a move toward $400 plus should come with ease. Momentum is building and the chart supports continuation.

SOL USDT LONG SIGNAL---
📢 Official Trade Signal – SOL/USDT
📈 Position Type: LONG
💰 Entry Price: 138.26
---
🎯 Take-Profit Targets (Partial Exits):
• TP1: 140.95
• TP2: 143.60
• TP3: 146.20
• TP4: 149.85
• TP5: 153.75
• TP6: —
---
🛑 Stop-Loss: 132.78
📊 Timeframe: 15m
⚖️ Risk/Reward Ratio: 2.89
💥 Suggested Leverage: 5× – 10×
---
🧠 Technical Summary
SOL is forming a bullish structure after bouncing from the 136–138 demand zone, confirming intraday higher lows.
Momentum indicators show early strength, supporting a continuation toward upper resistance levels:
140.95 → 143.60 → 146.20 → 149.85 → 153.75
A breakout above TP1 increases the probability of hitting extended targets.
---
⚙️ Trade Management Rules
✔ Take partial profits at TP1
✔ Move SL to Break-Even after TP1 is reached
✔ Trail SL as price approaches higher targets
✔ Avoid re-entry if SL hits
✔ Confirm market structure before entering
---
📌 TradingView Hashtags
#SOLUSDT #SOL #CryptoSignal #LongSetup
#TradingView #FuturesTrading #Altcoins #TechnicalAnalysis
---

SOLCRYPTOCAP:SOL is looking strong with support holding firmly. From the current level, the setup supports more than 200 percent in potential gains once momentum shifts. This is one of the cleanest support reactions on the chart right now.

SOLUSDT long tradeENTRY: 142.20
STOP LOSS: 140.80
TP1: 143.80
TP2: 145.30
RRR: ~2.4:1
🔍 MULTI-TIMEFRAME ANALYSIS
1m:
Strong micro structure break + engulfing candle reclaim around 142.00
Liquidity sweep below short-term low (fakeout at 141.90–142.00 zone)
Reclaim with higher low forming (valid sniper zone at 142.20)
5m:
Bullish engulfing from demand zone (below 141.00) with volume spike
Clean breakout reclaiming mid-structure range
Price holding above previous resistance turned support (142.00 zone)
15m:
Bounce off higher low in a bullish range after deep pullback
Recovery after sweep of major support zone near 138.00–139.00
Confirmed reversal + clean impulse suggests continuation toward upper range

SOL / USDT : Accumulation zone for upcoming rallySol / USDT is currently trading at an attractive discount and is looking promising for a strong rally once the market stabilizes and shows bullish momentum.
This zone can offer a good opportunity for accumulation, but patience and confirmation are important.
Do your own research before investing. This is just my opinion.

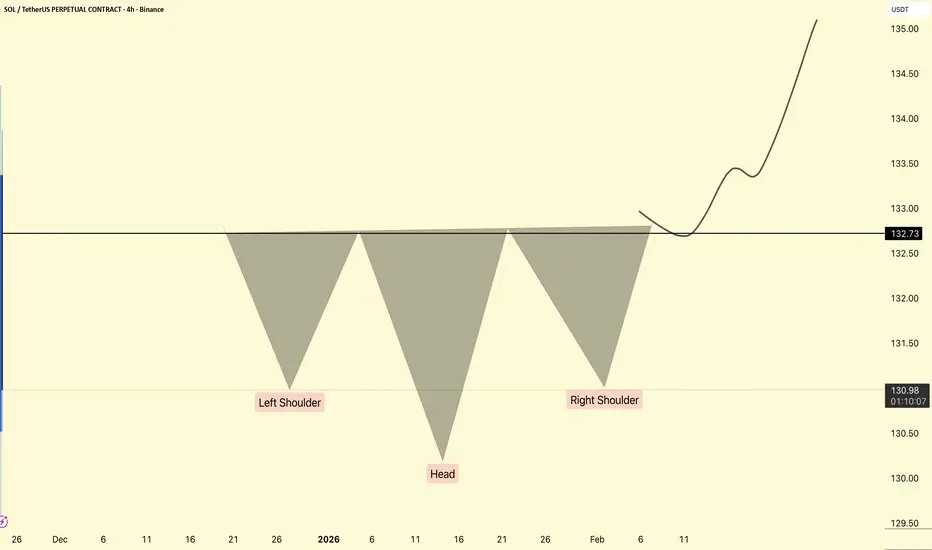
Inverse Head and Shoulders PatternThe inverse head and shoulders pattern is a technical analysis tool used to signal a potential trend reversal from a downtrend to an uptrend.
The inverse head and shoulders pattern is characterized by three consecutive troughs, with the middle trough (head) being the lowest and the two outer troughs (shoulders) being higher and nearly equal. This formation indicates that the downtrend is nearing its end, and a reversal to an uptrend may occur soon. Identifying this pattern can provide traders with a valuable signal to enter a new long position or exit a bearish trade, making it an essential part of technical analysis.
The inverse head and shoulders pattern is the opposite of the head and shoulders pattern. Technical traders widely follow both formations due to their distinct shapes and clear signals as trend reversal patterns.
purches ideapurches idea
purches idea
purches idea
purches idea
purches idea
purches idea
purches ideavpurches ideapurches ideapurches ideapurches ideapurches ideapurches ideapurches ideapurches ideapurches ideapurches ideapurches ideapurches ideapurches ideapurches ideapurches ideapurches ideapurches ideapurches ideapurches ideapurches ideapurches ideapurches ideapurches ideapurches ideapurches ideapurches ideapurches ideapurches ideapurches ideapurches ideapurches ideapurches ideapurches ideapurches ideapurches ideapurches ideapurches ideapurches ideapurches ideapurches ideapurches ideapurches ideapurches ideapurches ideapurches ideapurches ideapurches ideapurches ideapurches ideapurches ideapurches ideapurches ideapurches ideapurches ideapurches ideapurches ideapurches ideapurches ideapurches ideapurches ideapurches ideapurches ideapurches ideapurches ideapurches ideapurches ideapurches ideapurches ideapurches ideapurches ideapurches ideapurches ideapurches ideapurches ideapurches ideapurches ideapurches idea

SOL - Time for a pullback SOL - Time for a pullback
Before we take a new short we need a pullback and range
only after we can take a new short trade
Key resistance 171

DeGRAM | SOLUSD will test the strength of the $150 resistance📊 Technical Analysis
● SOL/USD remains inside a broad descending structure with repeated rejections from the dynamic resistance line, preserving bearish dominance.
● Price is approaching the $150 zone, where previous flag and consolidation tops failed, making a reversal toward the $135–$130 support area highly probable.
💡 Fundamental Analysis
● Market rotation out of high-beta altcoins continues as investors reduce exposure amid rising volatility, limiting SOL’s upside potential.
✨ Summary
● Bearish bias below $150. Targets: $135 → $130. Resistance: $150.
-------------------
Share your opinion in the comments and support the idea with a like. Thanks for your support!

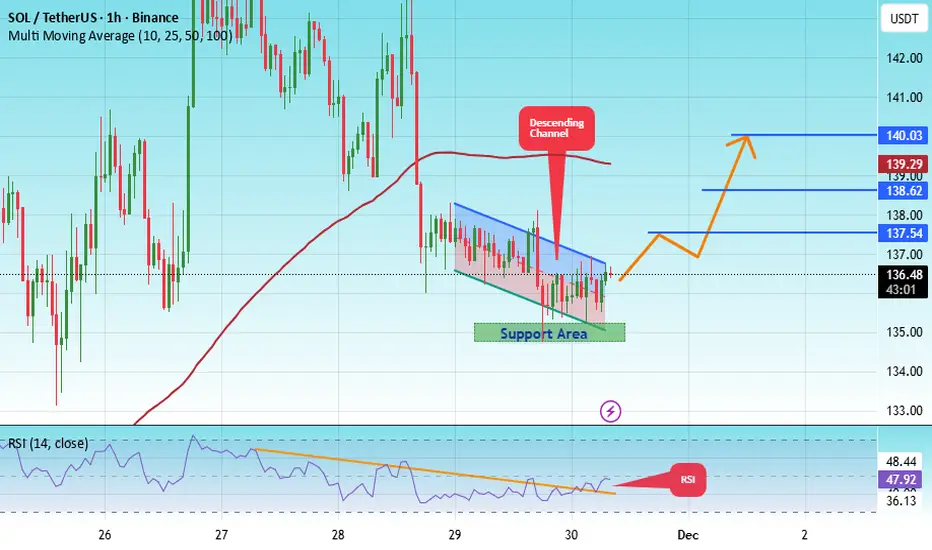
#SOL/USDT Final Liquidity Zone Before Expansion?#SOL
The price is moving in a descending channel on the 1-hour timeframe. It has reached the lower boundary and is heading towards breaking above it, with a retest of the upper boundary expected.
We have a downtrend on the RSI indicator, which has reached near the lower boundary, and an upward rebound is expected.
There is a key support zone in green at 135. The price has bounced from this zone multiple times and is expected to bounce again.
We have a trend towards stability above the 100-period moving average, as we are moving close to it, which supports the upward movement.
Entry price: 136.60
First target: 137
Second target: 138
Third target: 140
Don't forget a simple principle: money management.
Place your stop-loss below the green support zone.
For any questions, please leave a comment.
Thank you.
SOLUSDT – Push Down Again?Alright, are we going down again?
How far?
No clue. You don’t know. I don’t know.
Honestly, even Solana doesn’t know — it’s just vibing at this point. 😄
BUT… what we do know is that this week still looks pretty bearish overall.
Macro = trash.
Fear = extreme.
Traders = crying.
Perfect conditions for SOL to explore some lower real estate before even thinking about a pump.
I’m treating this as a mini swing / big scalp:
• lower RR
• higher win rate
• quick in, quick out
• don’t overthink it
🔎 What’s the plan?
We can easily push deeper this week, grab some liquidity, scare everybody, and then maybe — maybe — give us a bounce.
Or… we pump straight from here and make everyone who shorted feel pain.
Classic crypto.
And that’s exactly why:
⸻
⚠️ RISK MANAGEMENT > EGO
No predictions, no hopium, no copium — just proper risk.
Trade safe, enjoy the ride, and don’t let SOL send you to liquidation island. 😄🚀

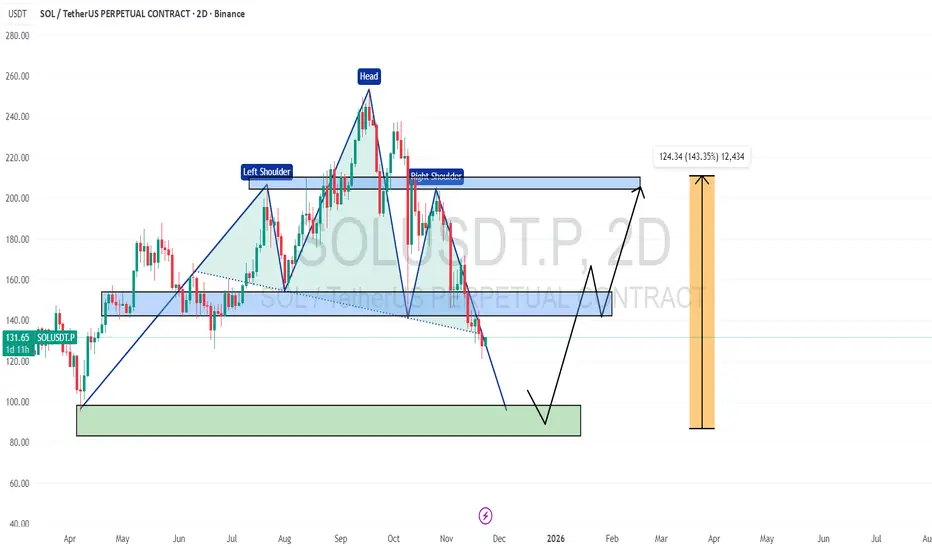
SOL USDT 2D CHART UPDATE 📌 CRYPTOCAP:SOL 2D Chart shows a head & shoulder pattern✅
📌 If this continues, the price may continue to decline ✅
📌 However, a bullish reversal is expected from the support zone below ✅
If this happens, the price may go back to the $150, $200+ range 🔥🚀