#SOLUSDT: A Big Move In Making Crypto Market Is BullishCrypto market remain bullish and as for the SOLANA we remain quite optimistic; currently price is trading at critical level and waiting for liquidity to emerge. We need strong volume for big price movement. Follow a strict risk management while trading crypto market.
Good luck and trade safe.
Team Setupsfx
Trade ideas
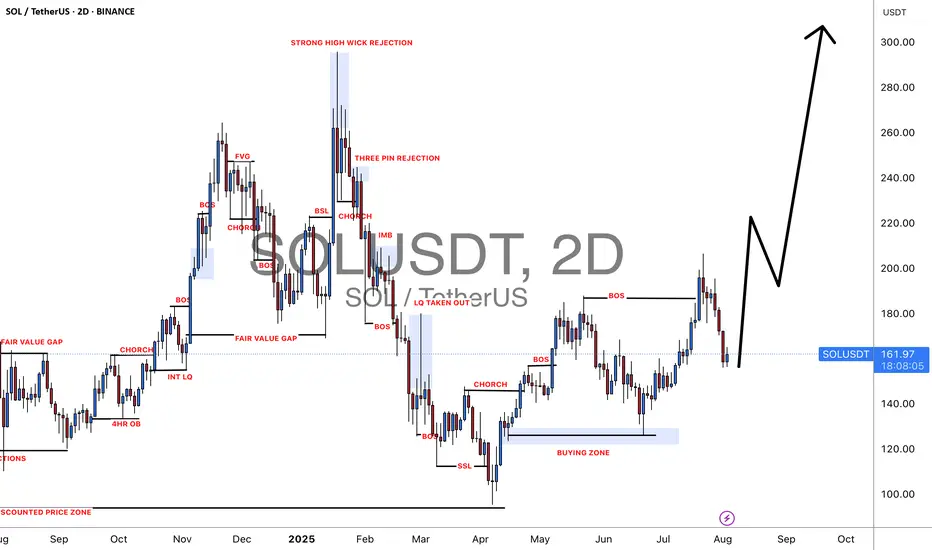
Possible scenario : Weekly pullback then 2 next TPHere are the potential two next take profit levels after the current pullback in the weekly timeframe.
SOL/USDT Intra day - Long IdeaBINANCE:SOLUSDT.P is showing a Bullish Divergence, if it breaks out, i am looking for longs :)

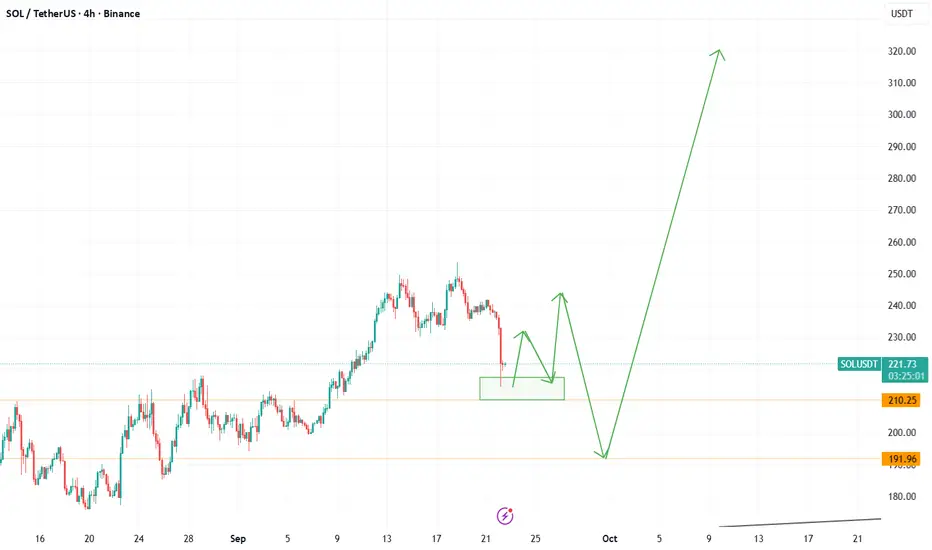
SOL/USDT: Pullback Toward Key Confluence Zone After Double TopSOL/USDT is currently retracing from the 250 resistance zone after forming a double top pattern, signaling near-term weakness. On the 4H chart, an upward channel intersects with a downward trendline, creating a critical confluence area between 200 and 210.
If the price rebounds from this zone, buyers may attempt a retest of 230, with potential to extend the move higher. The broader bullish structure remains intact as long as support at 200 holds, keeping the upside momentum in play

SOLANA → When will the sale end? Bullish trend...BINANCE:SOLUSDT.P is testing the key support zone of 210-215 amid a market decline. However, it is too early to say that the correction is over; additional signs are needed...
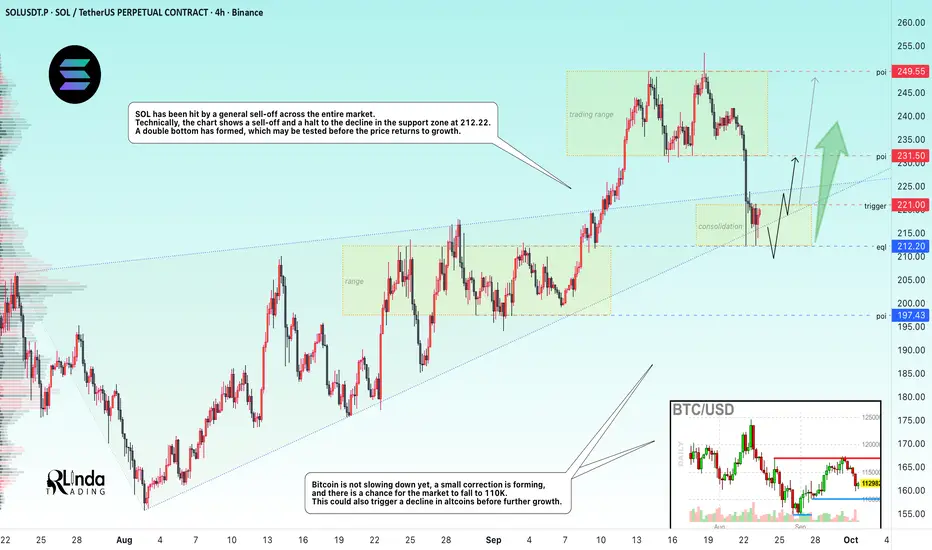
Bitcoin is not slowing down yet, a small correction is forming, and there is a chance for the market to fall to 110K. This could also trigger a decline in altcoins before further growth. SOL has been hit by a general sell-off across the entire market. Technically, the chart shows a sell-off and a halt to the decline in the support zone of 212.22. A double bottom has formed, which may be tested before the price returns to growth.
The current consolidation in the range of 212.0 - 221.0, the boundaries of which are of interest to the market, gives hope.
Support levels: 212, 200, 197
Resistance levels: 221, 231.5
A breakout of the local consolidation resistance and a close above 223.5 - 224 could trigger further growth within the bullish trend. Otherwise, MM may test the liquidity and support zone of 212.0 before the coin begins its recovery phase.
Best regards, R. Linda!
Lingrid | SOLUSDT Pullback Opens Long OpportunityThe price perfectly fulfilled my previous idea . BINANCE:SOLUSDT is retracing from the 250 resistance zone after forming a double top structure. 4H chart highlights an upward channel intersecting with a downward trendline, creating a key confluence around 200–210. If price rebounds from this zone, buyers could retest 230 and potentially extend higher. The broader bullish structure remains intact as long as the 200 support holds, keeping upside momentum in play.
⚠️ Risks:
A breakdown below 200 may shift bias back to the 165 support area.
Broader crypto market weakness could suppress bullish continuation.
Macro headwinds like stronger USD or risk-off sentiment could pressure $SOL.
If this idea resonates with you or you have your own opinion, traders, hit the comments. I’m excited to read your thoughts!

SOL Market Update📊 CRYPTOCAP:SOL Market Update
If SOL keeps retracing and arrives at the green support zone, watch for confirmation before entering long, as this is where buyers could step in and push the price up again.
🔹 Second important level is the red resistance zone — sellers are still active there. If the price returns to this zone, be aware of a possible retracement, but it could also be a potential short opportunity.

SOL riding the last wave to 300+ into Nov-Dec?Crypto might dip soon with SPX and pump much higher next month. Idea based on market patterns and fractals.
SOLANA short tradeI changed my mind on sol it rejects from fvg which signal weakness so i am in short

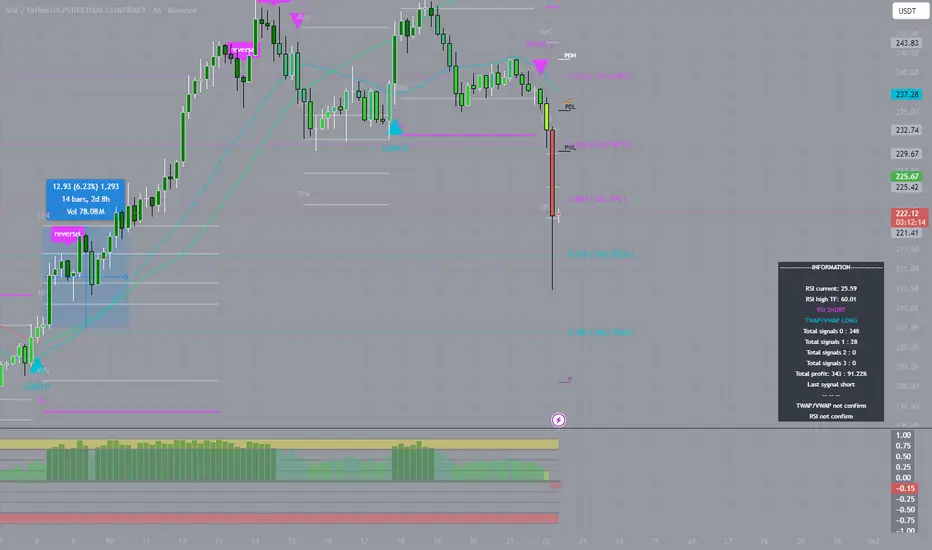
SOL: Clear ReversalOn September 15, I opened a short on the 4-hour chart at $237 with 10x leverage. The move down was quick: TP1 was closed at $233 and TP2 at $230. A $7 difference per coin, amplified by leverage, delivered a solid result. The maximum of the trade came exactly at $230 before the market reversed.
The focus here was not on trying to take everything but on following structure. Levels had been mapped in advance, and I executed step by step according to plan. This allowed me to control the trade calmly, without panic or guesswork.
When trading is built systematically, even sharp moves become manageable. It’s clear where to take profit, where to hold, and where to stop. With leverage, this becomes especially critical: risk stays under control, and decisions are made without emotional pressure.
The market will always move in its own way, sometimes offering more, sometimes less. But discipline and consistency make the outcome predictable. Every such trade proves that success comes not from luck, but from a systematic approach and the ability to stay on course.

SOL: Controlled Growth On September 8, I entered a long on the 4-hour chart at $206.16 with 15x leverage. The trade is still active, but the fourth profit level has already been secured at $222. The move was strong: about $16 per coin difference, with the maximum push before reversal reaching $248.
The key in this trade was not trying to squeeze everything out but strictly following the plan. Levels were defined in advance, and each of them worked out clearly. This allowed me to hold the position calmly, even as the market accelerated.
When trading is built on a systematic approach, decisions are made without rush. Clear profit-taking points, well-defined control zones, and structured scenarios guide the process. Even when using leverage, risk stays manageable, and emotions do not interfere with logic.
The market will always deliver moves bigger or smaller than expected. But discipline and structure make the outcome predictable. When trading shifts from chaos to a plan, every position becomes a step in a consistent strategy where results are defined not by chance but by the system.
Long trade
Trade Journal Entry
Pair: SOLUSDT
Direction: Buyside trade
Date/Session: Sat 20th Sept 2025, NY Session AM
Timeframe: 15-Min
🔹 Trade Details
Entry: 237.713
Profit Level: 281.830 (+18.53%)
Stop Level: 236.150 (-0.79%)
Risk-Reward (RR): 24.25
🔹 Technical Structure
Liquidity:
Price swept BSL (buy-side liquidity) before reclaiming demand.
Order Blocks / Demand Zone:
15m demand zone clearly defended at ~236–237.
Market Structure:
Consolidation → sweep → displacement higher.
Structure confirms buyside intent, aiming for 280+
🔹 Indicators
Volume: A spike at the sweep low indicates sell-side exhaustion and absorption.
Range Mapping: Previous highs aligned with profit target zone.
🔹 Narrative / Trade Rationale
Trade thesis based on stop run + reclaim of demand.
Target anchored to imbalance fill and range highs near 281.
Exceptionally high RR (24.25) due to tight stop relative to target.
✅ Bias: Long (buyside continuation).
📈 Target: 281.830 (+18.53%).
🛡️ Risk: -0.79%.

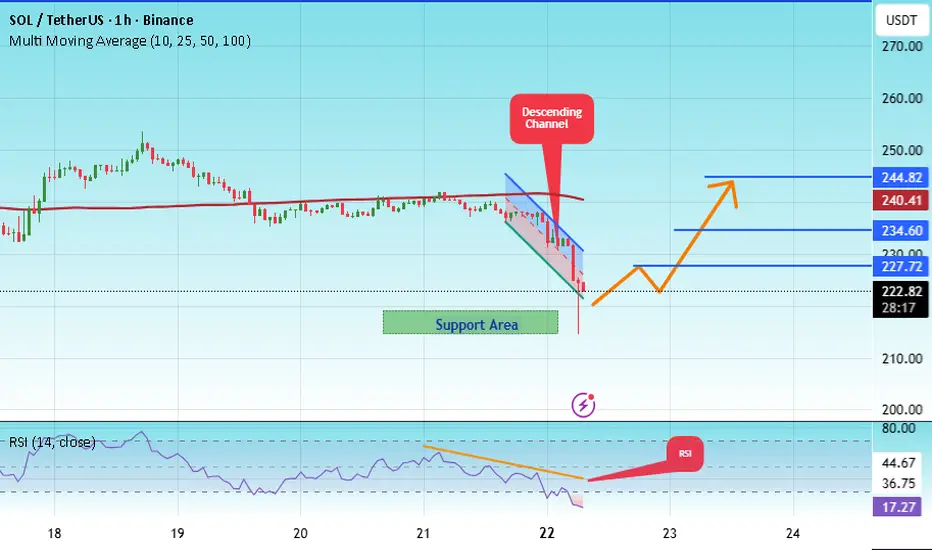
#SOL/USDT bullish structure formed at the chart#SOL
The price is moving within a descending channel on the 1-hour frame, adhering well to it, and is heading for a strong breakout and retest.
We have a bearish trend on the RSI indicator that is about to be broken and retested, which supports the upward move.
There is a major support area in green at 216, which represents a strong support point.
We are heading for consolidation above the 100 moving average.
Entry price: 218
First target: 227
Second target: 234
Third target: 244
Don't forget a simple matter: capital management.
When you reach the first target, save some money and then change your stop-loss order to an entry order.
For inquiries, please leave a comment.
Thank you.
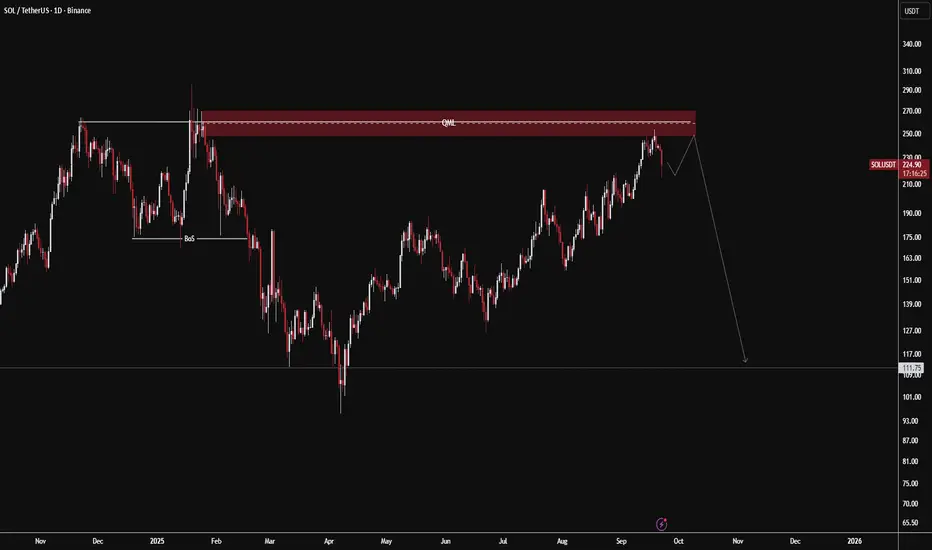
SOL/USDT – Daily OutlookSolana is now facing a critical Quasimodo Level (QML) around 260 – 270, a historically significant supply zone.
A strong rejection here could trigger a major downside move, potentially driving price back toward the 111 – 115 support area.
On the other hand, a decisive breakout and sustained move above QML would invalidate the bearish setup, opening the path for further bullish continuation.
At this stage, the QML acts as a make-or-break level for Solana. The next few daily candles will be decisive in determining whether SOL resumes its bullish trajectory or enters a sharp correction.
SOLANA ??sooo this is how i think write comment and let me know your idea
i dont use so many pattern and i thing its better to make levels and wait till they brake just using dynamic and static lines is enough BUT also you need to analyse candle by candle with EYES and use some basic candle patterns like pin bar and engulf is enough (how it worked for me)

SOLUSDT |15 m | Market Structure | Ongoing AnalysisAs of 21/09/2025
On the 15M chart, SOL is trading inside a range-bound zone, following the external LL + HL sequence from the 1H chart.
Within this range, we can see alternating HHs and HLs forming, which shows internal bullish intent, but no clean breakout has occurred yet. At the same time, price continues to respect the support zone (Internal + External BoS), suggesting buyers are active in defending this level.
📌 Current read:
The 15M structure is short-term bullish, but price remains capped by the internal BoS resistance. This makes the move more of a pullback/transition phase rather than a confirmed trend reversal.
A clean break above internal BoS would strengthen the bullish case, aligning with the defense at support.
A failure here and breakdown back below the support zone would resume the bearish external structure from the 1H chart.
For now, the 15M bias leans bullish, but higher timeframe context (1H) tells us to wait for confirmation before acting.

SOLUSDT | 1 H | Market Structure | Ongoing AnalysisSOL/USDT | 1H Time Frame (Higher TF – Swing Structure)
As of 21/09/2025
On the 1H chart, SOL had been forming HHs and HLs, but the last HL was broken, printing a LL. This confirms a bearish shift in the external structure.
However, instead of clean continuation, price has since moved into a range-bound consolidation zone.
The highlighted range reflects indecision, where the market is pausing after the initial bearish break. At the same time, price has been consistently bouncing off the support zone (marked Internal + External BoS). This suggests that buyers are actively defending this level, but we’ll wait for confirmation before calling it a reversal.
📌 Current read:
We are in a consolidation/pullback phase. The market is waiting for direction:
A break above the range could signal bullish retracement/continuation, confirming buyer strength.
A break below would confirm bearish resumption, in line with the external shift.
For now, patience is key until the higher timeframe provides a clear directional bias.

SOLUSDT under Bearish Pressure.SOL remains under bearish pressure after showing divergence on both MACD and RSI, signaling potential weakness despite holding near recent highs.
Key Levels:
Immediate support at 232.6 (Fib 0.618).
If broken, deeper downside targets lie at 218–215, with extension toward 210–206 zone.
Resistance remains at 239–245 zone.
📉 Idea: Short below 232–229 breakdown, targeting 218 → 210, with stops above 240–245 resistance zone.

SOL AGAIN/;Hello friends
You see that the price is stuck in a trading range and you must know that 80% of failures in trading ranges are fake!
Now, as the trading range lengthens, we can finally wait for its failure, and if it fails, the price will move by the same amount as the trading range.
*Trade safely with us*

SOL/USDTSolana cryptocurrency is worth buying at the $200 level, and if it holds support at that price, it could potentially rise to $300.
Currently, at $230, it's neither a good buying opportunity nor a good point to sell.

solana long to to $253.5solana long to to $253.5
Sl: 236.99
Time sensitive. Entered a while ago. Anticipating a bullish push this weekend based on the price action, currently breaking back above resistance onthe 4hr tf. If close above good chance we'll continue the pump higher

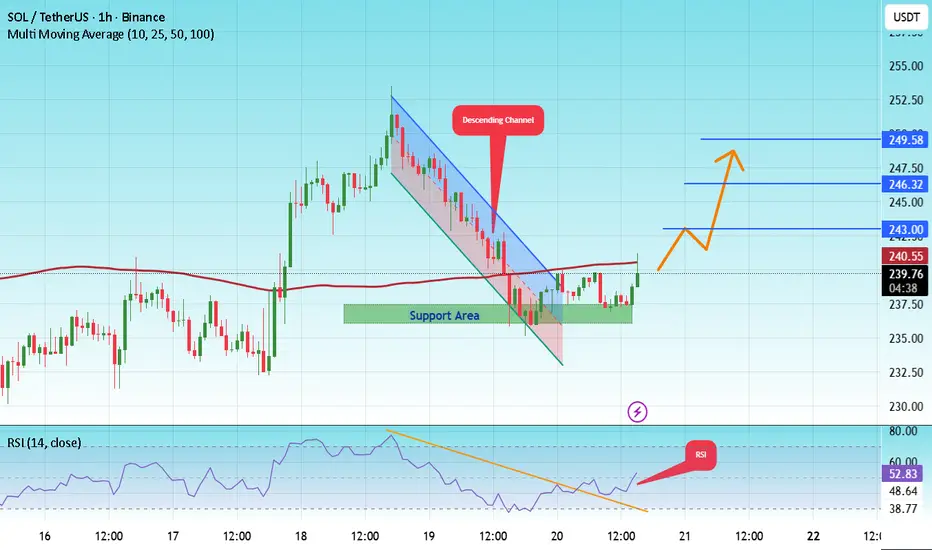
#SOL/USDT bullish structure formed at the chart#SOL
The price is moving in a descending channel on the 1-hour frame and is expected to break and continue upward.
We have a trend to stabilize above the 100 moving average again.
We have a downtrend on the RSI indicator that supports the upward move with a breakout.
We have a major support area in green that pushed the price higher at 236.
Entry price: 240.
First target: 243.
Second target: 246.
Third target: 249.
To manage risk, don't forget stop loss and capital management.
When you reach the first target, save some profits and then change your stop order to an entry order.
For inquiries, please comment.
Thank you.
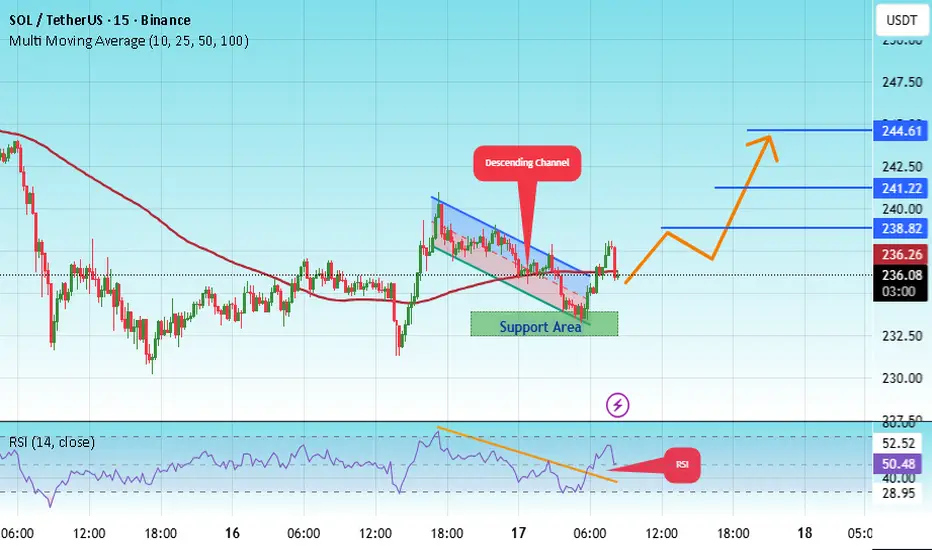
#SOL/USDT bullish structure formed at the chart#SOL
The price is moving within a descending channel on the 1-hour frame, adhering well to it, and is heading for a strong breakout and retest.
We have a bearish trend on the RSI indicator that is about to be broken and retested, which supports the upward breakout.
There is a major support area in green at 233, representing a strong support point.
We are heading for consolidation above the 100 moving average.
Entry price: 236
First target: 238
Second target: 241
Third target: 244
Don't forget a simple matter: capital management.
When you reach the first target, save some money and then change your stop-loss order to an entry order.
For inquiries, please leave a comment.
Thank you.