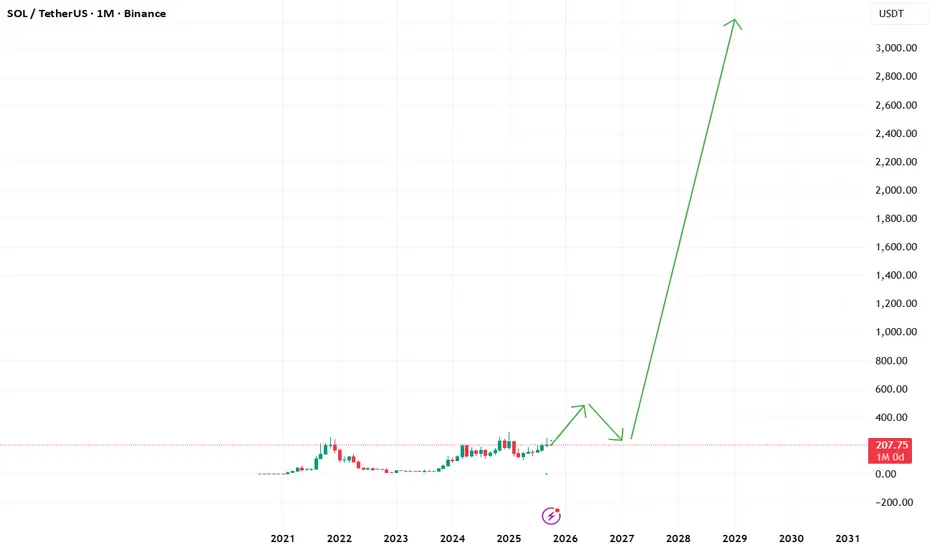
Solana Tests Key Support Could Jump 15% Target 240$Hello✌️
Let’s analyze Solana’s price action both technically and fundamentally 📈.
🔍Fundamental analysis:
Nine firms just filed for Solana (SOL) ETFs, and the SEC is fast-tracking reviews till mid-October.
Analysts expect up to $1.8B inflows in Q4, using ETH ETF history as a guide.
If approval comes, SOL could attract big institutions.🚀📊
📊Technical analysis:
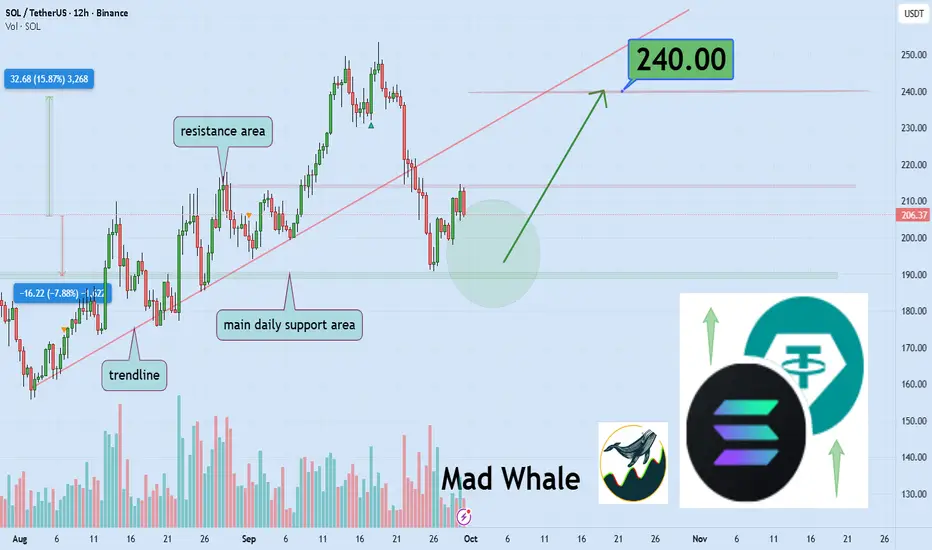
BINANCE:SOLUSDT is testing a key daily support; holding this zone could spark a 15% rally, targeting $240. 📈🛡️
📈Using My Analysis to Open Your Position:
You can use my fundamental and technical insights along with the chart. The red and green arrows on the left help you set entry, take-profit, and stop-loss levels, serving as clear signals for your trades.⚡️ Also, please review the TradingView disclaimer carefully.🛡
✨We put love into every post!
Your support inspires us 💛 Drop a comment we’d love to hear from you! Thanks, Mad Whale
SOLUST.P trade ideas
Solana Recovery: Watching 178.2 Solana is also showing price recovery after last week’s crash. The key level to maintain the upward correction is 178.2 . Volatility will likely decrease to previous levels over the next few days.
Support lies in the 168.8–175.5 range — in this area, I expect a quick recovery above 178 , otherwise, the decline may continue toward 155 . Resistance is in the 216–224 range, but the price has already reacted from the 200 level, so I’m watching for a potential breakout of the current high.

SOL-USDTThere was a pullback to the $226 level 🔽
If the trend line is broken, the correction could continue to the two green supports
The main and important support is around $200

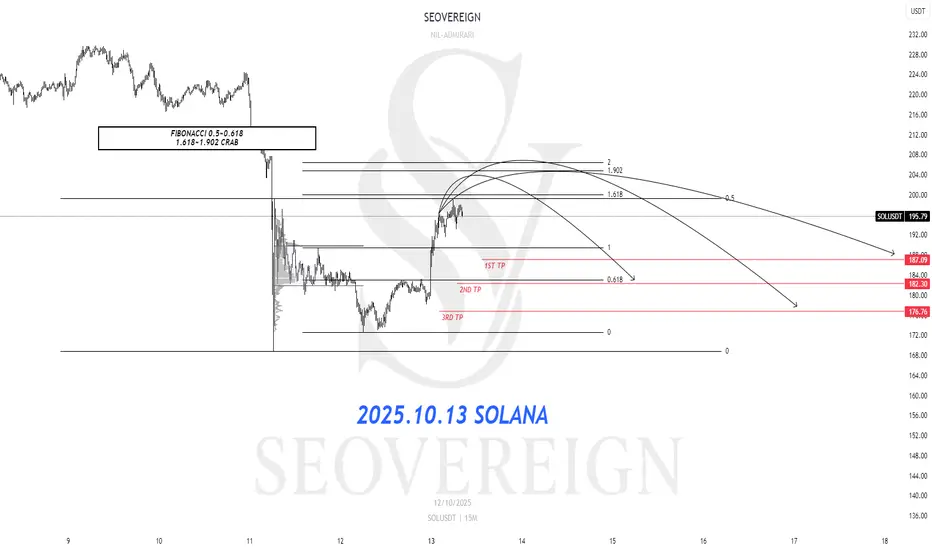
[SeoVereign] SOLANA BEARISH Outlook – October 13, 2025Today, I would like to share my bearish outlook on Solana as of October 13.
The first basis for this view lies in the 0.5–0.618 Fibonacci retracement zone.
This zone is known as a key area where, after a correction within an uptrend has completed, short-term rebounds tend to be limited and a bearish reversal often follows.
In particular, the 0.618 level—often referred to as the “golden retracement ratio”—typically serves as a strong resistance point where selling pressure re-emerges after an excessive pullback.
Currently, Solana’s upward momentum appears to be slowing within this 0.5–0.618 range, suggesting that the upper resistance pressure is gradually intensifying.
The second basis is the 1.618–1.902 CRAB pattern.
While the Potential Reversal Zone (PRZ) of a traditional Crab pattern is located at the 1.618 extension of the XA leg, it is often observed in real market conditions that prices extend up to the 1.902 level before a sharp reversal occurs.
This range indicates that the market has entered an overheated phase, and strong corrective waves frequently emerge when the pattern completes.
Accordingly, the average target price is set around 182 USDT.
Depending on how the chart unfolds,
I will provide further updates to this idea, including position management and any significant changes.
Thank you for reading.
SELLS*)Market Structure-MSS
*)POI/Key Level- Supply
*)Quasimodo(QM)
Note: the market is all about probabilities which also makes my analysis a probability.

$300 Solana Inevitable!Nice rejection on Solana. Now lets see if we will get the move to the downside for a nice long trade to target $300.
Calculate Your Risk/Reward so you don't lose more than 1% of your account per trade.
Every day the charts provide new information. You have to adjust or get REKT.
Love it or hate it, hit that thumbs up and share your thoughts below!
This is not financial advice. This is for educational purposes only.

SOLUSDTSOLUSDT
I expect the price to go to 250 zone, the latest hh and if the price is not making a new hh then i expect the price to go down to 212 zone and bounce from there if the support stay.

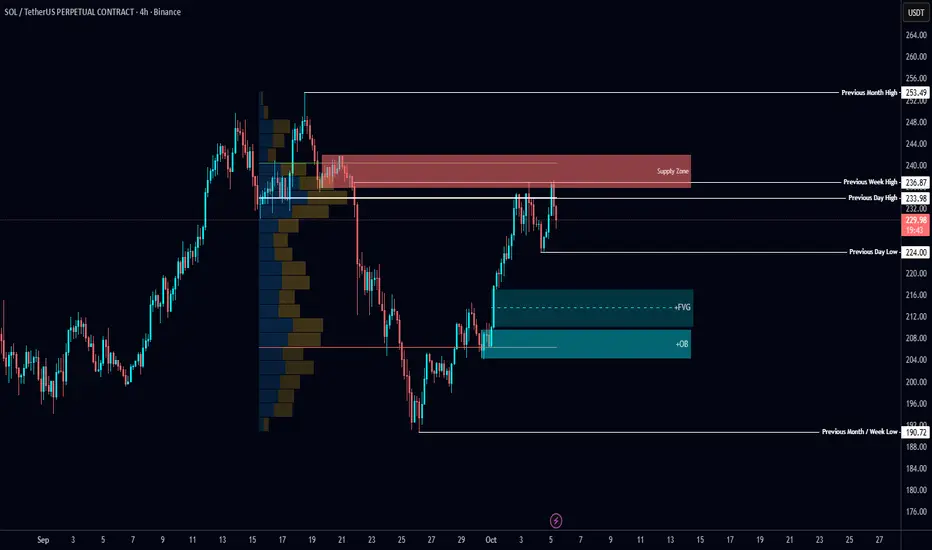
$SOL Analysis🚨 CRYPTOCAP:SOL Analysis 🚨
CRYPTOCAP:SOL tapped the Supply Zone and swept previous week’s high for liquidity 👀
Now trading below POC.
⚡ If this flips, an easy path opens to the previous month’s high.
📉 Otherwise, I’ll wait for confirmation to short and target bullish OB + FVG levels below.
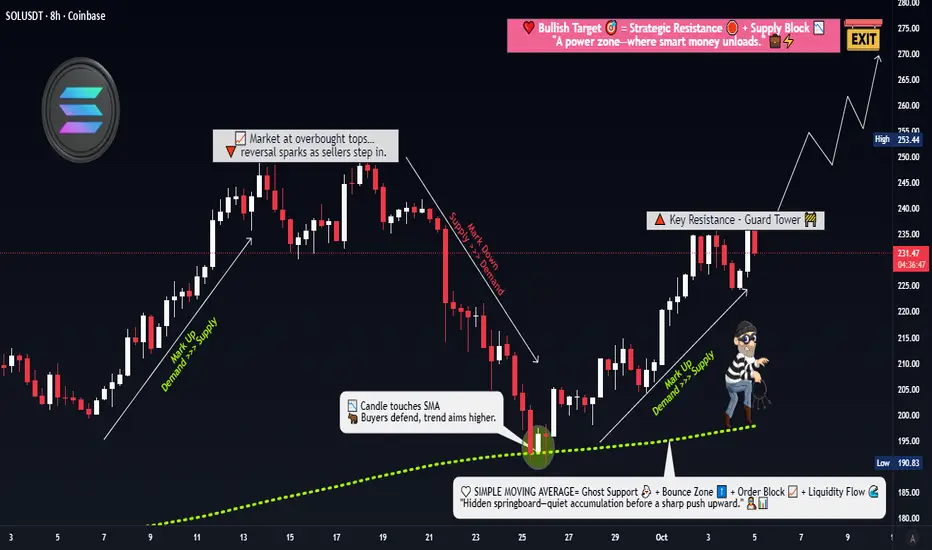
Is Solana Ready for a Technical Breakout or Just a Fake Pump?🎯 SOL/USDT Wealth Strategy Map | The Gentleman Thief's Playbook 💎
📊 Market Overview
Asset: SOLANA/USDT (SOL/USDT)
Trading Style: Swing/Day Trade Hybrid
Market Sentiment: Bullish Pending Breakout Setup 🚀
🎭 The Setup (As Told by a Professional Thief)
Dear Ladies & Gentlemen, gather 'round for today's calculated heist...
🔓 The Entry Plan
Breakout Zone: $240
Entry Strategy: ANY price level AFTER confirmed breakout above $240
💡 Why this matters: We're watching for resistance to crack like a vault door. Once $240 breaks with volume, the path to riches opens.
🛡️ Risk Management (The Thief's Insurance Policy)
Stop Loss: $220
⚠️ Important Notice: This is my thief-style SL, but YOU are the master of your own vault. Set your risk tolerance based on YOUR capital and comfort level. Make money, take money — at your own calculated risk.
🎯 Profit Targets (Where We Cash Out)
Primary Target: $270 (Our recommended exit)
Technical Target: $280 (Strong resistance + overbought territory + potential trap zone)
📌 Strategic Exit Reasoning:
$270 offers a clean 12.5% gain from breakout
$280 presents multiple bearish factors: strong resistance, overbought conditions, and classic bull trap setup
Smart thieves escape with profits before the alarm sounds 🚨
⚠️ Important Notice: This is my thief-style TP, but only YOU can decide when to take profits. Your money, your rules, your risk.
🔍 Technical Analysis Deep Dive
Key Levels to Watch:
Resistance: $240 (current), $270 (target), $280 (danger zone)
Support: $220 (our safety net)
The Correlation Play 📈
Related Pairs to Monitor:
CRYPTOCAP:BTC (Bitcoin) - The market's king affects all. If BTC pumps, SOL typically follows with 1.5x volatility
CRYPTOCAP:ETH (Ethereum) - Direct competitor in smart contracts; inverse correlation on capital rotation
CRYPTOCAP:AVAX (Avalanche) - Similar L1 narrative; watch for sector rotation signals
SEED_DONKEYDAN_MARKET_CAP:MATIC (Polygon) - L2 competitor; check for broader altcoin momentum
💡 Correlation Strategy: If BTC holds above $65K while ETH consolidates, SOL historically outperforms due to capital flow seeking higher beta plays.
⚡ The Gentleman Thief's Trading Philosophy
This isn't gambling — it's calculated robbery from the market's inefficiencies. We enter with precision, manage risk like professionals, and exit before greed becomes our enemy.
Remember:
✅ Breakouts need volume confirmation
✅ Risk management is non-negotiable
✅ Profits aren't real until you take them
✅ The market doesn't care about your feelin
📢 Community Engagement
✨ "If you find value in my analysis, a 👍 and 🚀 boost is much appreciated — it helps me share more setups with the community!"
⚖️ Legal Disclaimer
IMPORTANT: This is a "thief-style" trading strategy shared purely for educational and entertainment purposes. This is NOT financial advice. Trading cryptocurrencies involves substantial risk of loss. Past performance does not guarantee future results.
You are solely responsible for your own trading decisions. Always:
Do your own research (DYOR)
Never invest more than you can afford to lose
Understand the risks before trading
Consider your personal financial situation
The author is not a registered financial advisor and assumes no liability for your trading outcomes.
Trade safe, steal smart, exit elegant. 🎩💰
#SOLUSDT #Solana #CryptoTrading #SwingTrading #DayTrading #TradingStrategy #Breakout #TechnicalAnalysis #CryptoSignals #AltcoinSeason #SOL #USDT #CryptoAnalysis #TradingView #PriceAction #CryptoChart #BullishSetup
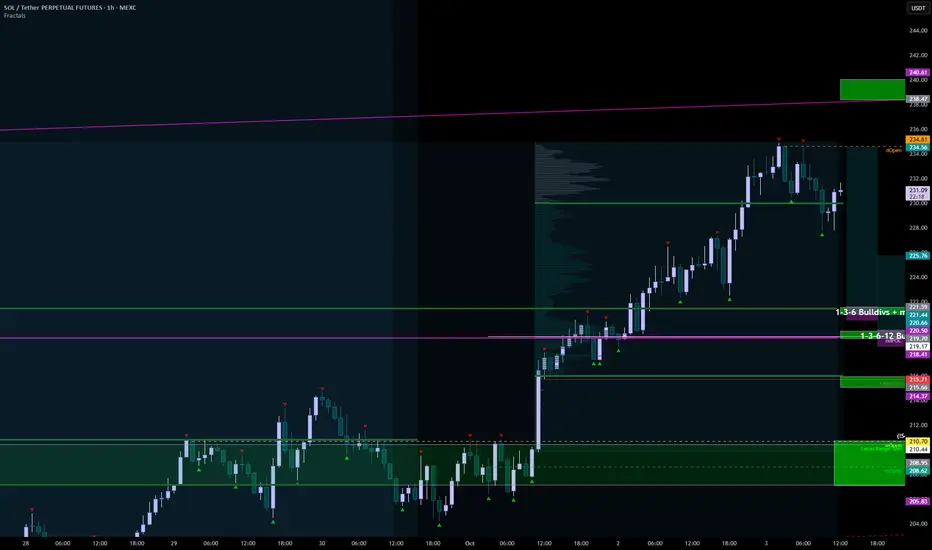
SOL 03.10At 3 AM (when else, only when we're sleeping) R1 reacted, with weakness in beardivs + mfd divs 1-3-6-12-24m, and corrected by 3%.
BUT
1) they left almost equivalent positions,
2) the daily session closed almost without a shadow above,
3) there are no diversifiers on the indicator, and there are fat mfds on mfd 1h and higher.
I think we'll go to 240, but there's a slight correction right now. At 240, it will be possible to part-take profit from the main long from 192. But how and when we'll get there is unclear. If Bitcoin starts to move into the 117-115 zones today within the console, Salt could even move from the current levels to the key support zone around 210, but for now, it needs to lose another 220 and 216 to do so.
Support zones:
221-221.5
219-219.6
215-215.9
207-210.7
Resistance zones:
238.4-240
255-256.4
Why Solana Could Surpass $300 in 2025–2026Hey guys, today I want to share my full view on Solana (SOL) .
For a long time, my main focus as an investor and trader was always on Bitcoin and Ethereum. But in the last 12 months, I started massively investing into Solana. The reason is simple: the ecosystem is not only recovering from its darkest days but is now proving real resilience, adoption, and growth.
When FTX collapsed in November 2022, Solana took one of the hardest hits. FTX and Alameda were among the biggest backers of the Solana ecosystem. When they went bankrupt, SOL crashed under $12 and many people stopped believing in its future. The market saw Solana as “FTX’s chain.” But fast forward to today, and we are witnessing a complete turnaround. Users are coming back, new protocols are being launched, and on-chain activity is stronger than ever.
In our crypto prop trading company , we’re building new infrastructure for our traders, and after careful research, we chose Solana as the best chain for implementation . Its speed, scalability, and near-zero fees make it the most practical blockchain to build on. And it’s not just us — many other companies and institutions are starting to integrate with Solana, which will bring even more growth in the months ahead.
⚠️ Quick disclaimer: This is not financial advice — only my humble opinion based on research, analysis, and experience.
Solana Price Action & Key Events (2022–2025)
To understand Solana’s current position, let’s look back at its journey over the last few years:
Bridge Breach (Feb 2022): The Wormhole bridge hack stole ~$325M, hurting trust in Solana DeFi.
DeFi Winter (May 2022): The Terra UST/LUNA collapse triggered a full liquidity crisis across all DeFi. Solana’s TVL drained fast.
FTX Implosion (Nov 2022): The turning point. FTX and Alameda went bankrupt, SOL crashed under $12, and the bear market bottom was defined.
Meme Season (Early 2024): Retail users came back with BONK and other meme coins. Solana’s speed and low fees made it the perfect hub for speculation.
WIF Mania (Spring 2024): Dogwifhat (WIF) went viral, volumes on Solana even surpassed Ethereum at times.
Pump.fun Frenzy (Apr 2024): Millions of tokens launched through Pump.fun, onboarding hundreds of thousands of wallets and driving record on-chain activity.
Full Recovery (2025): After two years of stagnation, SOL broke above $200 again, fully recovering to pre-FTX levels and proving that it can thrive as a community-driven, retail-driven chain.
Solana On-Chain TVL (Total Value Locked)
TVL (Total Value Locked) shows how much capital is locked in DeFi protocols on Solana — lending, staking, DEXes, and yield farming.
2021–2022: First boom, TVL surged past $10B.
2022–2023: Collapse after Terra and FTX, TVL fell close to zero.
2024–2025: Strong recovery — TVL passed $9–10B again, showing users are back and Solana DeFi is alive.
Why this matters: TVL growth proves Solana is not only about meme coins. Capital and liquidity are returning, and users are once again trusting the chain with real money.
Solana DEX Volume & Pump.fun Impact
In just one day, DEXs on Solana processed $10.3B in trading volume.
Pump.fun alone made up ~80% of that ($7.93B).
Pump.fun is unique because it allowed anyone to instantly create and trade tokens, onboarding massive numbers of new users. At its peak, Pump.fun had over 400,000 weekly active addresses , and even today it still makes up around 10% of all Solana DEX activity .
This shows two things:
Solana is the clear leader in retail-driven trading.
The ecosystem still needs broader use cases to sustain growth once meme speculation slows.
Futures Open Interest – Market Confidence
Open interest (OI) in Solana futures collapsed after FTX, but in 2024–2025 it came roaring back, growing alongside SOL’s price.
Positive: Rising OI shows traders trust Solana again, and rallies are backed by real activity.
Risk: Very high OI means higher liquidation risk. If markets turn, leveraged positions could cause sharp corrections.
Pump.fun Traders Data – Not Everyone Wins
According to Dune Analytics, 99.6% of Pump.fun traders never made more than $10K in realized profits . Only a small fraction hit big wins, while most made little or lost money.
This highlights the gambling-style nature of meme trading: it drives huge network activity but is not sustainable long-term. For Solana, the key is converting this short-term hype into long-term adoption.
Why Solana Could Rise in Late 2025–2026
Looking forward, here are the main reasons I believe Solana has strong upside potential:
1. Tokenization Boom
By 2033, $20T in assets could be tokenized.
Solana has the scalability, low fees, and adoption needed to be the leading infrastructure.
2. On-Chain Usage
Solana already surpasses Ethereum in active addresses and transactions (100M monthly users, 3.5B monthly txs).
More usage → more fees → higher staking yield → stronger SOL demand.
3. Institutional Adoption
Major players like BlackRock, Franklin Templeton, Visa, and PayPal are already launching tokenized products or stablecoin integrations on Solana.
4. Ecosystem Growth
Solana dominates in trading, token creation (60% of new tokens), and new sectors like AI agents.
From Pump.fun (retail) to xStocks and OnRe.finance (institutional), Solana is proving versatile.
5. Technology Roadmap
With Firedancer and other upgrades, Solana is moving toward 100k–1M TPS capacity, making it “internet-scale finance.”
6. Investment Case
SOL is scarce (~750M fixed supply), yield-bearing (7–13% staking), and directly tied to network growth.
Analysts project potential 4x–30x appreciation (short-term ~$900, medium ~$2,000, long-term ~$6,000).
Outlook – Target $300+
If 2022–2023 was about survival, and 2024–2025 was about recovery, then 2026 could be Solana’s breakout moment as the backbone of digital finance.
With on-chain activity at record highs, institutional adoption growing, and scalability improvements rolling out, a move above $300 in late 2025 or 2026 is not only possible but realistic.

SOULTOBER - Can SOL get ATH?Likely not now when I am posting the charts, - observe it clear, Small scalps to the top as mentioned as always


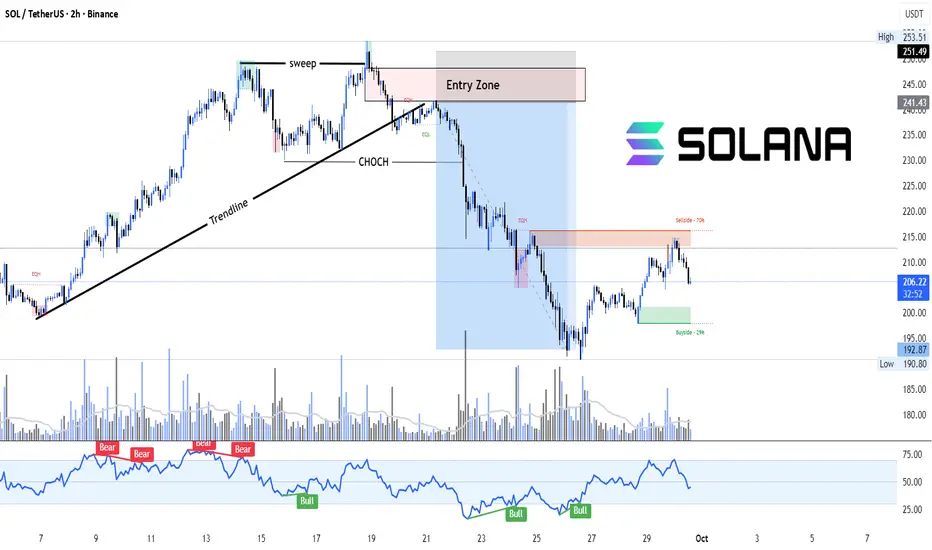
SOL: From Sweep to Selloff – Supply in ControlSolana (SOL/USDT) recently broke below a strong trendline after a liquidity sweep and clear Change of Character (CHOCH). Price retested the supply zone (Entry Zone) before continuing its downward move, showing a classic bearish market structure shift.
Currently, price is reacting from a sell-side zone (~70% retracement), with potential downside targets toward the buy-side liquidity (~29% retracement). RSI also reflects bearish divergence confirmation from the highs, aligning with the structural shift.
Key Highlights:
Engulfing candle + Trendline break + CHOCH confirmed bearish bias.
Entry Zone retest offered high-probability short setups.
Current rejection from supply signals further downside.
RSI divergence strengthens bearish case.
Solana long to $253.5Solana long to $253.5
Sl: 225.7
Tp: 253.5
Anticipating trend continuation back to the highs soon


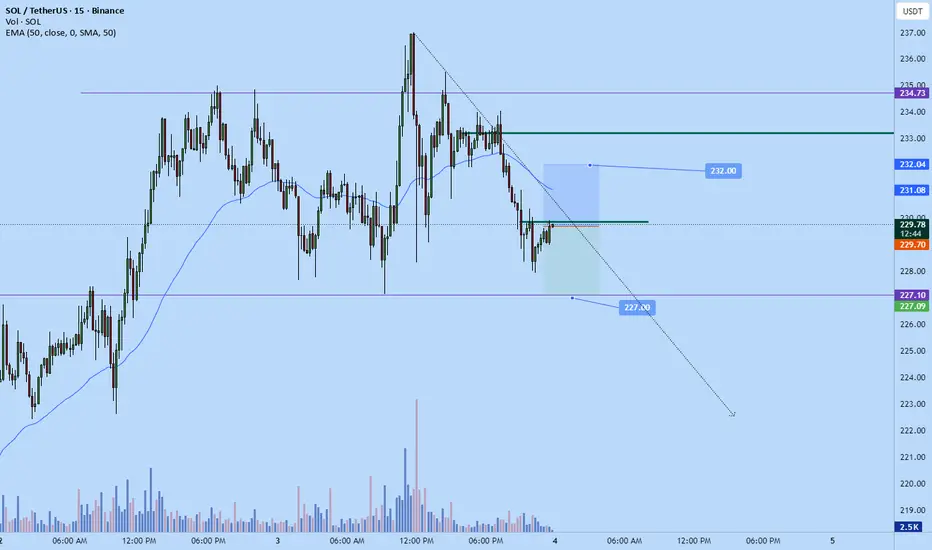
Sol scalp shortJust went short on sol
Scalping to $227
1:1
Sl: 232
Market correcting on daily tf. Likely will push down to $227 before any continuation back up
SOL: Ready for a Big MoveWe can see CRYPTOCAP:SOL is currently in a period of accumulation, just like it was back in 2021 before a massive rally . The key rising support line has been holding up strong, and after periods of accumulation, the price has consistently exploded upwards, reaching new highs.
Right now , the price is approaching its previous all-time high (ATH), and if history repeats itself, we could be in for another "boom" phase. The price is holding well above the key support, which strengthens the bullish outlook.
Keep an eye on the price action around the ATH level, if we break through, it could signal the next major leg up. This setup looks very similar to past accumulation phases that led to significant price jumps.
#PEACE
Stay tuned for more updates

DeGRAM | SOLUSD fixed above the $200📊 Technical Analysis
● SOL/USD rebounded from the $200 key level and the ascending channel’s support, rejecting a deeper correction.
● The structure suggests upside continuation, with $230 and $250 as targets, while the $200 demand zone remains critical support.
💡 Fundamental Analysis
● Solana’s growing DeFi activity and NFT volume support bullish sentiment, while broader crypto recovery improves risk appetite.
✨ Summary
SOL/USD holds above $200 support, eyeing $230–$250 on renewed momentum. Break below $200 invalidates the bullish scenario.
-------------------
Share your opinion in the comments and support the idea with a like. Thanks for your support!

Solana ready to break into new highsSolana- the most used crypto (90% of all blockchain activity! ) , which is already and going to be the future of all crypto starting from tokenized stocks till endless usecases, is about to break into new highs.
I expected SOL to be number 2 after bitcoin in terms of marketcap.
Over 233 Solana will hit 250Solana has not yet joined the latest wave of gains. If it breaks above 233, it will give up 7% in the spot market.

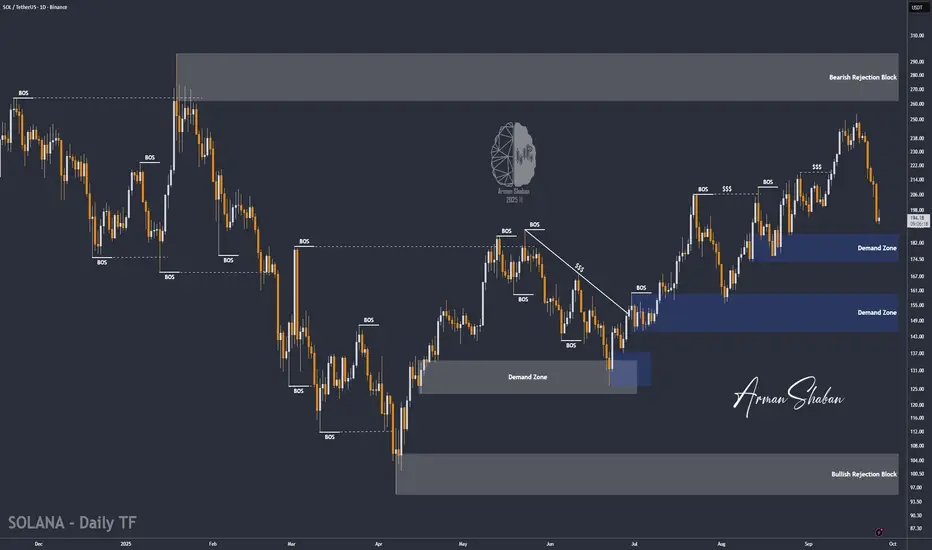
SOL/USDT | Solana Correction Could Spark Rally to $262 (READ)By analyzing the Solana chart on the daily timeframe, we can see that the price has continued its correction and is now trading around $194. As you can see, it’s getting close to the $173–$186 demand zone, and we need to watch whether this zone can trigger new buying pressure.
Personally, I expect a strong reaction from this area. If the price stabilizes here and shows the first signs of growth, the possible upside targets will be $205, $230, $242, $254, and $262.
Please support me with your likes and comments to motivate me to share more analysis with you and share your opinion about the possible trend of this chart with me !
Best Regards , Arman Shaban