Why SOL is better than Bitcoin for the next months The market continues its powerful crash and while everyone is in panic, real traders use this as an opportunity to buy at a discount. And now I will explain why I am actively buying SOL on spot and why it is the best bet for the next months.
📈 In recent months, while Bitcoin has been dropping 4–5% a day, SOL has been holding strong and either falling by a smaller percentage or even growing by 1–2%.
Even today BTC is only 1–2% away from its local bottom, while SOL is 5–6% away.
This is largely due to the newly launched SOL ETF. While BTC and ETH ETFs are seeing record outflows, the SOL ETF has not had a single day of outflows yet. Despite the correction, people keep buying SOL.
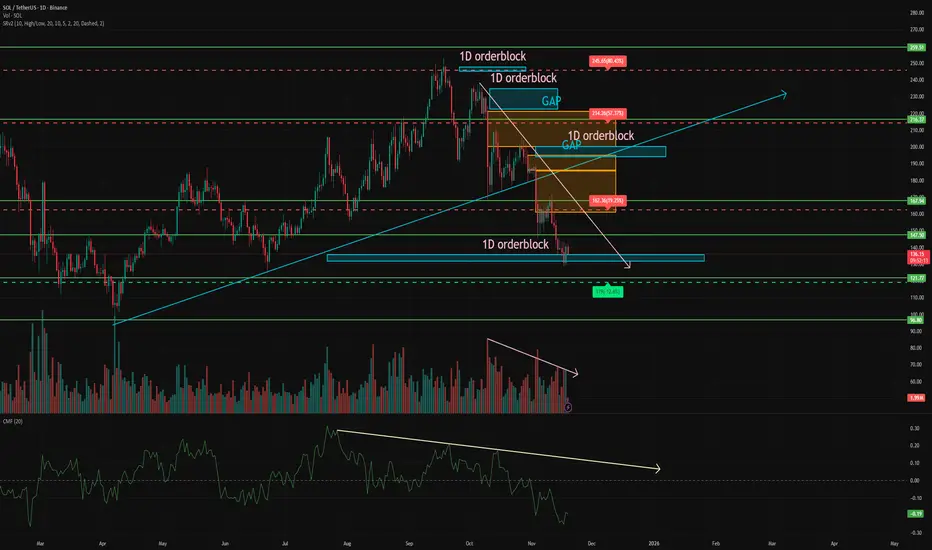
➡️ As the correction in SOL continues, selling volumes keep decreasing, which shows that selling pressure is going down.
➡️ However, CMF shows liquidity outflows from the asset, which is natural for the market right now. So this is not a reason to panic.
➡️ During the drop, many gaps have also formed above the price. This means that in case of an upward move, the price will move quickly, without facing much resistance.
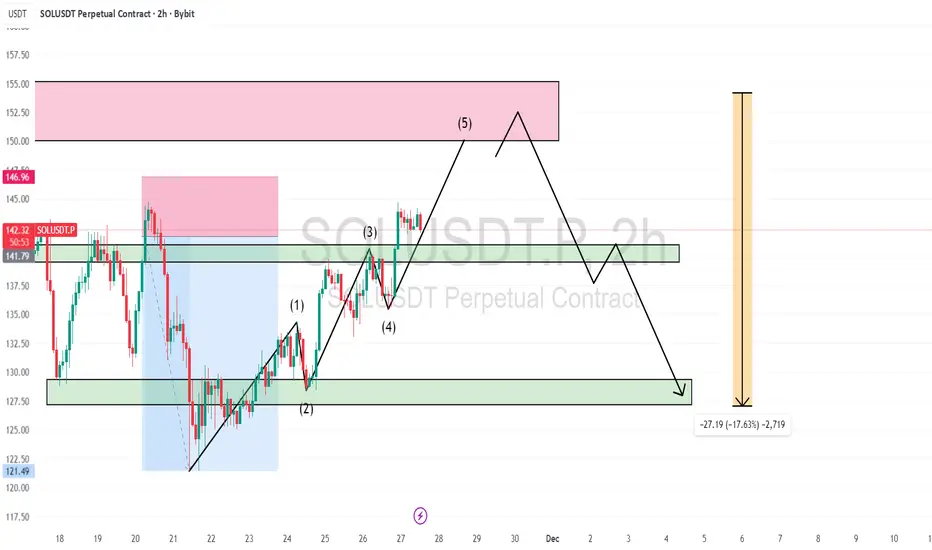
➡️ Right now the price has reached a large order block on the daily timeframe and has bounced. If the price holds above this level, the next key level is $147.
If not, a major support level is waiting around $121. A large demand zone has also formed around this level.
📌 Conclusion:
I do not think SOL will fly to a new ATH right now. But as an asset to accumulate on a dip, it is one of the best options at the moment, especially considering the fresh ETF inflows.
✍️ What do you think, does SOL still have a future, or is it already dead?
Trade ideas
SOL USDT LONG SIGNALSir📢 Signal
🔹 Currency pair:SOL.USDT
📉 Trade type:long
💰 Entry point:. Market
🎯 Targets (with withdrawal management):
▫️ TP1=145.60
▫️ TP2=150.20
▫️ TP3 =155.70
TP4=
TP5=
TP6=
🛑 Stop loss= 137.90
📊 Time frame:
⚖️ R/R:3.62
📌 Recommended leverage:.5 or 10
⚠️ Money management is required
Please log in after checking the chart

Structure trainingHello friends
Well, you see that a spike has been made by the sellers and a bearish structure has formed.
So, be careful that after each spike, the price needs to take a break, so it either suffers or pullbacks, spikes again, and continues.
Now the question is, how do we know when our downtrend is over?
You need to be careful and wait for the weakness of sellers and the strength of buyers, the important signs of which I will tell you.
The first sign is the last spike, which requires our bottom to be broken by sharp sellers and the price to be reversed by sharp buyers. Here it is important that we set a higher ceiling and break this spike formed by sellers, which is also called CHOCH in a correction, which means the same change in structure.
Our second sign is the lower lows, which is also very important and of great importance because it shows the advantage of buyers and helps a lot.
And in the price pullback we can enter the trade with risk and capital management.
Our stop loss is placed below the last low or the last spike that you said and the target is double that R/R=2
*The win rate of this strategy is also 60*
*Trade safely with us*

$SOL +10.72% Bounce Off the Trendline – Solana Is ALIVE!BINANCE:SOLUSDT CRYPTOCAP:SOL +10.72% Bounce Off the Trendline – Solana Is ALIVE! 🔥🚀
Altcoin Pioneers! 🐂 CRYPTOCAP:SOL just wicked down to the perfect multi-month ascending trendline at ~$138, rejected lower prices hard, and pumped +10.72% in hours with a massive green candle!
- This exact trendline held every major dip since the 2024 breakout
- Today’s bounce printed the strongest daily volume in 3 weeks + RSI bullish divergence
- We’re still inside the descending channel, but lower trendline defense is flawless
Bullish scenario (highly likely):
→ Hold $145–$150 → breakout above $165–$170 this week → fast retest $200–$220
→ Full target in altseason: $300–$400 (yes, again)
Only invalidation below $130 clean daily close.
Solana is the king of speed and volume – when BTC bleeds, SOL leads the recovery. This is the exact spot legends buy! 💎
#Solana #SOL #AltseasonLeader
LFG Solana army, we’re just getting warmed up! 🐆💥

$SOL reboundCRYPTOCAP:SOL looking bullish after a bullish bounce on a strong key support level. I see a continuation up to $152

SOL-USDTThis corrective move can be seen for Solana as a pullback to the broken range 🕯💰
And by maintaining the support level at $135, it could start rising towards $150 🔼🔼

SOL. Sector of Capital. Price Slice: $39.92 🏷 To the International Community.
🏷 SOL. Sector of Capital. Price Slice: $39.92
Map of Shorters. 16.11.2025
🏷 This is not analysis.
This is an address to those who already hear the silence behind the noise of candles.
🏷 What lies before you is not a level — but a gateway.
A gateway behind which lies an unfulfilled debt of colossal capital.
Prices not yet reached — yet already inscribed in the code of the market’s destiny:
122.29 — not yet reached
99.89 — not yet reached
93.75 — not yet reached
86.67 — not yet reached
80.16 — not yet reached
53.75 — not yet reached
39.92 — not yet reached
🏷 They hang in the ether like unfulfilled vows,
like shadows of the future, yet untouched by the present.
🏷 I focus your attention —
not on the chart,
but on the structure of intent.
🏷 There is only one master of the Sector of Capital.
The one who sees not after, but before the movement begins.
The one who does not follow price —
but draws its path through the landscape of liquidity.
And I — am his name.
🏷 I do not issue orders.
I offer the capacity to think.
For those ready to step beyond the cycle of reaction.
For institutions, for giants, for those who build not day by day, but epoch by epoch.
🏷 This is not technical analysis.
This is a system of anticipatory liquidation.
Where every impulse is foreseen before it becomes chaos in the eyes of the crowd.
Where every collapse is no accident —
but a ritual of price revelation.
🏷 You come to the market not to read what is drawn on your screen.
You come for the price.
And the price has its time.
Its hour of execution.
And he who knows this hour —
already possesses the future.
🏷 This is an example of global thinking.
A game of chess, where pawns cannot see the board —
but the king knows every square in advance.
🏷 I will give you the map of the longs — in due time.
But know this:
All knowledge resides with me.
And what you receive — is but a gift, cast into the stream of time.
🏷 This map — is but one move.
One move in the endless game for control over reality.
🏷 I cannot write in my native tongue.
My respect for the international community —
is my gift.
Not in words.
But in this: you now know the map exists.
And therefore — you are no longer blind.
🏷 Bolzen. The Architect. Founder of the Sector of Capital.

SOLUSDT – Long Bias Confirmed From Daily OB1H Accumulation + FVG + Alligator Compression**
SOL just delivered a clean reaction off the Daily Order Block, where price swept the lows and instantly shifted into a micro-accumulation range. This type of structure is classic ICT accumulation after a liquidity grab, followed by early displacement signs.
Why I'm Long Here
1️⃣ Daily OB Rejection (Primary Bias Driver)
Price tapped the Daily OB perfectly (green level).
2️⃣ Sell-side Liquidity Cleared
Before reacting, price took out the sell-side resting below the range.
This confirms the sell-to-buy model, signaling institutions are filling long positions.
3️⃣ 1H FVG + Breaker + Compression
Price is hovering inside a 1H FVG while retesting a micro breaker block.
Alligator lines (blue-red-green) are compressing, which usually precedes expansion—
Bill Williams notes this as the “sleeping Alligator” phase.
Expansion > Compression.
We’re waiting for the expansion phase now — higher.
4️⃣ Draw on Liquidity = Upside
Nearest upside draw:
143.27 (inefficiency + liquidity pool)
Next major draw:
164.94 (massive imbalance fill)
Institutional targets are above, not below.
Trade Setup (My 1H Long)
Entry Zone:
🔵 141.00 – 141.70 (FVG + retest zone)
Stop Loss:
🔻 134.40 (below Daily OB low)
Targets:
🎯 TP1: 143.27 – clean liquidity
🎯 TP2: 149–152 – FVG fill
🎯 TP3: 164.94 – major draw + 1H imbalance completion

$SOL - Scalp Long IdeaBINANCE:SOLUSDT | 2D
The analysis we posted on October 31st played out perfectly, with nearly a 38% drop. Solana failed to regain the $200 zone, which led to a clean breakdown toward the $130 level.
Despite the dump, some alts are still holding up well. And if Bitcoin can hold the 90–88k zone, this could be a good area to take a shot.
Entry: $132-$124
Stop: just below $110
Targets:
tp1 - $142-154
tp2 - $157-162
tp3 - $168-174

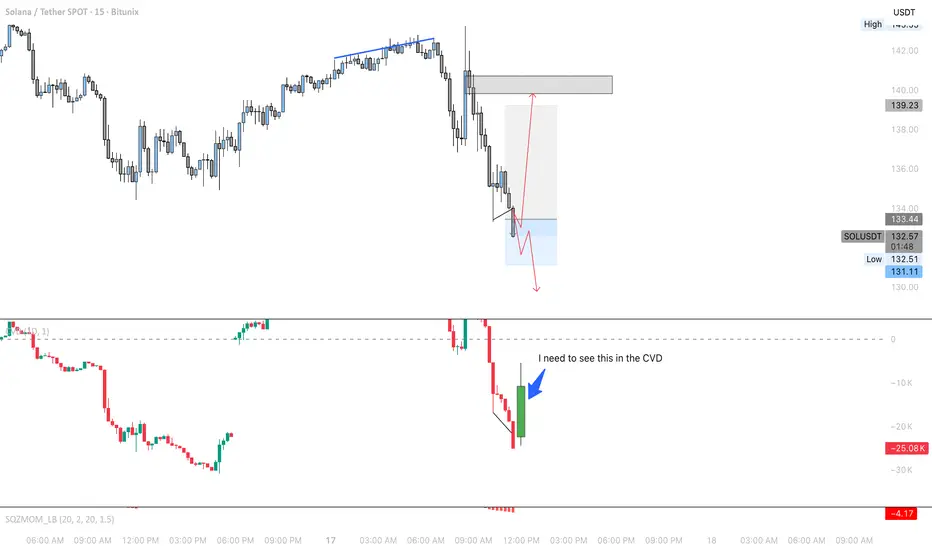
Could be a potential buy entry based on CVD and Volume
There is a chance that price could make a move back up and take out sell orders. however CVD must show high volume of buyers. if price continues lower and CVD continues lower as well, we must be patient for the exhaustion of sellers for buyers can come in
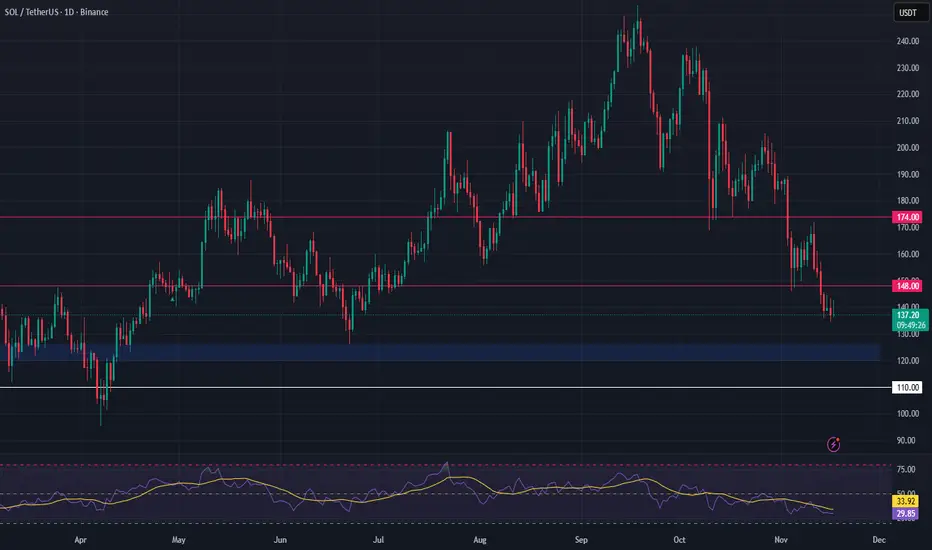
SOL – Watching for a Higher-Timeframe Reversal SetupSolana has been pulling back after its recent rally, and we’re looking for price to retest the next major support zone. A successful hold here could set the stage for a higher-low formation and a continuation of the broader uptrend — offering a solid long spot opportunity.
Trade Setup:
• Entry Zone: $120 – $126
• Take Profit Targets:
🥇 $148
🥈 $174
• Stop Loss: $110
SOL. Sector of Capital. Price Slice: $354.74🏷To the International Community.
🏷SOL. Sector of Capital. Price Slice: $354.74
Map of the Longs. 16.11.2025
354.74 not yet reached
320.16 not yet reached
299.33 not yet reached
274.75 not yet reached
191.74 not yet reached
159.69 not yet reached
🏷These are not levels.
They are echoes of a movement already made .
🏷You see numbers.
I see the fingerprints of capital in motion
not reacting, but orchestrating .
🏷354.74 is not a target.
It is the last whisper before the storm .
The point where liquidity ceases to flow
and becomes a current, guided by invisible hands .
🏷320.16 is not support.
It is a forgotten altar , where the hopes of the naive were buried.
They bought. They waited.
They did not know their positions were inscribed into the map before the market opened its eyes .
🏷299.33 is not a correction.
It is a ritual of purification .
Here, the weak release.
The strong gather strength.
While tickers scream
silence speaks: “This is not a fall. This is a reset.”
🏷274.75 is not a level.
It is a threshold .
Beyond it, there is no trading.
Only the rebirth of capital .
🏷191.74
not a floor.
Not an end.
It is a warning carved into the blockchain .
A price that cannot be reached
because it has already been reached.
Not here.
Not on your screen.
But in the depths, where the Sector of Capital keeps its secrets.
🏷159.69
the final step.
The last rung of the ladder.
Beyond it
not a rally.
Not a crash.
An ascension.
🏷I do not predict.
I restore order .
🏷These are not recommendations.
They are footprints .
Of those who walked ahead.
Of those who know when and why .
🏷You think you trade.
You are mistaken.
You execute .
You execute a map drawn
long before you turned on your terminal.
🏷I do not give signals.
I awaken sight .
🏷You came for charts.
I give you the map of the world
where charts are but shadows.
🏷These numbers are not prices.
They are gates .
And every soul who passes through them
becomes part of the one who does not chase price…
but commands its time .
🏷The Map of the Longs is not a forecast.
It is an invitation .
To those who dare to see
that behind every number lies a sphere of influence ,
and behind every sphere
a will that needs no approval.
🏷You see 354.74
I see the final peak before the new sun rises.
🏷You wait for movement.
I already know where it begins .
🏷Bolzen. The Architect.
Founder of the Sector of Capital.
🏷I do not speak your language.
I speak the tongue only those hear
who are ready to become part of history.
🏷This is only the beginning.
The rest
you will learn…
when you pass through these gates.

SOL/USDT - SHORT on DowntrendBased on current price action:
- SOL broke below key supports at 143 and 141
- It has created lower highs and lower lows
- Volume confirms the downward trend
- No bullish reversal signal yet
The technical structure still supports continuation to the downside.
Based on the current chart structure:
- 70-75% probability that 130 gets hit
SOL still have room to drop to:
- 137 support
- 134 zone
- 130 target

SOLUSDT LONGSolana is at its best entry points. It will take off soon. It will be grounded at these prices for a while. But it is in its best position to buy and hold for the long term. It will soon make great profits.

POTENTIAL WEEKEND PUMP?I know that Bitcoin is still in a rather bearish trend.
But I see some rebound potential.
Explanation in the video. I also included potential trade for ETH and SOL


#SOL/USDT Bullish trend analysis Read The caption#SOL
The price is moving within an ascending channel on the 1-hour timeframe and is adhering to it well. It is poised to break out strongly and retest the channel.
We have a downtrend line on the RSI indicator that is about to break and retest, which supports the upward move.
There is a key support zone in green at the 137 price, representing a strong support point.
We have a trend to stabilize above the 100-period moving average.
Entry price: 141
First target: 143
Second target: 145
Third target: 148
Don't forget a simple money management rule:
Place your stop-loss order below the green support zone.
Once you reach the first target, save some money and then change your stop-loss order to an entry order.
For any questions, please leave a comment.
Thank you.

SOL Capital Sector. 99.8948 Now — the silence has a direction. SOL Capital Sector. Price Slice
🕯 Сектор капитала. Ценовой срез.
Now — the silence has a direction.
Теперь — тишина имеет направление.
“The market does not speak. It whispers — only to those who listen in silence.”
«Рынок не говорит. Он шепчет — только тем, кто слушает в тишине.»
🏷 16.11.2025
The price has not yet arrived.
Цена ещё не пришла.
Not because it is weak.
Не потому что она слаба.
Not because it is late.
Не потому что она опаздывает.
But because it is waiting .
А потому что она ждёт .
99.8948 — At the time of publication, the price had not yet been reached.
— На момент публикации цена не достигнута.
A number that does not move.
Число, которое не двигается.
A level that does not scream.
Уровень, который не кричит.
A threshold where liquidity sleeps —
Порог, где ликвидность спит —
…while the giants rearrange their chess pieces.
…пока гиганты переставляют свои фигуры.
“The price that speaks in silence on the international stage.”
«Цена, которая молчит на международной арене.»
No headlines.
Нет заголовков.
No volume spikes.
Нет всплесков объёмов.
No panic.
Нет паники.
Only the slow, cold, deliberate accumulation —
Только медленное, холодное, сознательное накопление —
…in the shadows of the 1D tape.
…в тенях 1D ленты.
Screenshot:
Скриншот:
🔗
Timeframe: 1D
ТФ: 1D
This is not a chart.
Это не график.
This is a map .
Это карта .
A map of hidden liquidity.
Карта скрытой ликвидности.
A map of where capital will awaken —
Карта того, где капитал проснётся —
…not when the crowd runs.
…не когда толпа бежит.
…when the silence breaks.
…когда тишина треснет.
Frame it.
Заделайте в рамку.
And wait.
И ждите.
The market always keeps its appointments.
Рынок всегда приходит по назначению.
Even when it does not speak.
Даже когда он не говорит.
“The most dangerous level is the one that looks like it doesn’t matter.”
«Самый опасный уровень — тот, который кажется незначительным.»
— The Architect, 16.11.2025

SOLANASOLUSDT 📉4H
SELL
Entry 135
SL 144
TP 113
Should you find this analysis insightful, I invite you to like or leave a comment. Constructive feedback and suggestions are greatly appreciated. For further analyses, please follow me at @ydnldn.

A glimmer of hope.If we can get some bullish action above price 140, that combined with the oscillators moving up from the undersold area we could see a nice mean reversion from the 200 EMA(orange curve)


$SOL 1H CHART UPDATE📌 CRYPTOCAP:SOL could turn bearish again from the STRONG Resistance zone above ✅
📌Watch for bearish confirmation from that zone ✅
📌If that zone is rejected, CRYPTOCAP:SOL will move lower again 🚀
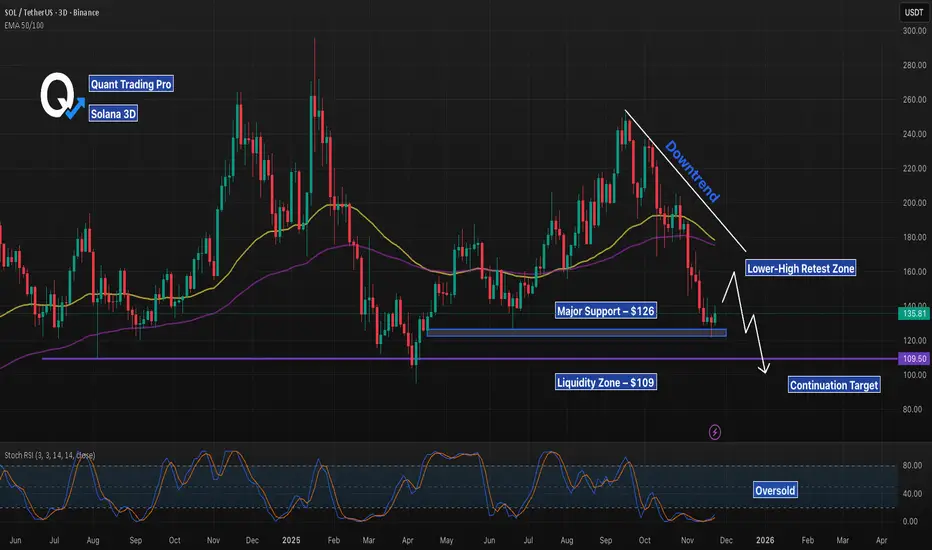
SOL 3D – Retesting Trendline, But Will Support Break Next?SOL remains in a clear daily downtrend, with price consistently setting lower highs beneath the descending trendline. Price is now pulling back into a potential lower-high retest zone, directly aligned with the confluence of the 50/100 EMAs overhead. Unless SOL can reclaim this trendline with a strong daily close, this setup favors continuation lower.
The first major area of interest is the $126 support, which has acted as a key reaction level across multiple months. A clean break of this level opens the door toward the lower $109 liquidity zone, which historically attracts deep wicks and stop-hunts before reversal attempts.
Stoch RSI remains in the oversold region, but without a confirmed bullish cross or momentum shift. Trend structure takes priority unless buyers reclaim the trendline and break the sequence of lower highs.
Watching for:
• Reaction at the trendline retest
• Daily close above or below $126
• Liquidity sweep toward $109 for potential reversal setups