SOL: Very clear Head & Shoulders pattern visibility📊If we compare the D1 charts on BTC and Solana, we can see that on Solana's chart, we have a MUCH MORE clear image of the Head and Shoulders formation - that is why it is always worth spending extra time to compare the correlating charts to get the full picture if some evidence is missing or hidden under the market noise.
⚠️This might be an indication of a strong drop even further if the BTC major 75k support line were to collapse. Be cautious!
Trade ideas

SOL-USDT
It is inside the same channel I told you about yesterday 💲💲
If it doesn't break above the top of the channel and the descending channel isn't broken 📊
The first support level is at $127, and if the correction continues, it might even go down to $121 🚨🔽

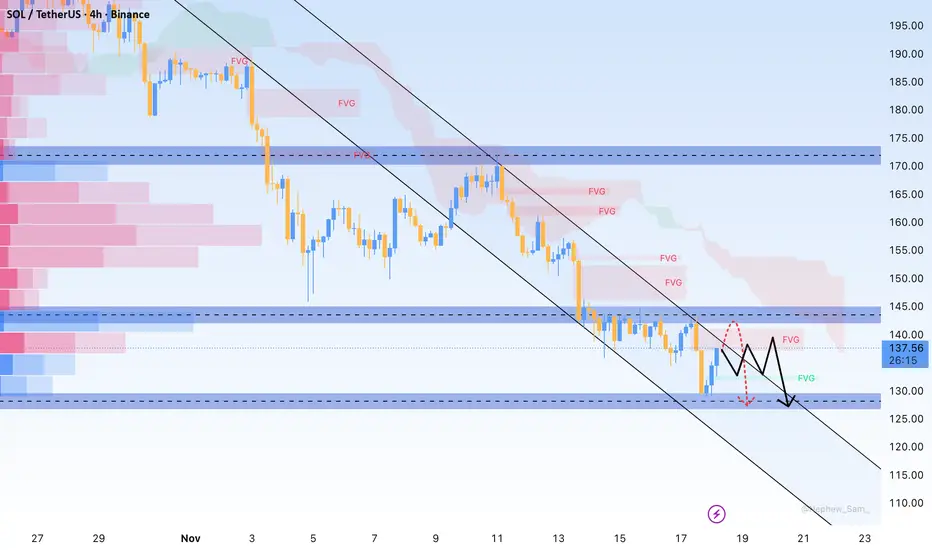
My plan to next mov of SOLMy outlook for SOL’s next move is that it will bounce hard, but heavy selling will likely come in during that move. In other words, a sudden sell-off might hit in the middle of the upward move; something that may look like a normal correction at first but turns out deeper than expected. After that, the price might climb a bit again, but we should wait and stay cautious until things become clearer.

Head and Shoulders forming for SOLHead and Shoulders forming for SOL
Possible bounce from here to 195$

SOL-USDT🔤🔤🔤
Solana is in a downtrend channel 💰💰
which has shown a good reaction at the channel's bottom.
Two important support levels for Solana are the $127 range and then $121 🔽📊
On the other hand, the first resistance is the top of this channel at $137, and if this is broken, the next target will be $143 📣🔼

SOLANA RETRACEMENT INCOMINGFollowing that impressive downward surge, a true force of momentum, we can reasonably anticipate a retracement upward to address those overlooked volume nodes left behind. Stay vigilant on the overall market structure; hold for a confirmed break, and cross-reference with the Cumulative Volume Delta (CVD) to time that short term pullback effectively. it's been a solid week so far, packed with solid setups, and the horizon promises even more to come.

SOLANA, November 15 Two Possible Correction Scenarios — One Outcome
In my view, Solana is currently forming a corrective structure.
At this moment, there are two scenarios:
🟧 Orange Scenario
The ABC corrective pattern has likely just completed, and Solana may follow the orange arrow toward 126 and potentially even lower.
🟪 Purple Scenario
The current flat ABC structure may actually represent wave A of a larger ABC correction — similar to what happened in Bitcoin right before its recent drop (see my recent BTC post where I expected 94K).
If this scenario plays out, Solana could first rise toward 144–146, and only then move down to 126.
I previously mentioned that I was waiting for Solana at 136 — and we’ve already seen that level.
I also expect 124, and possibly even lower.
But for now, I keep my short-term target at 126.
My global target is 112, but first, let’s see how exactly Solana approaches 126 — this will help confirm whether it truly intends to move below that level.
Let’s see which path Solana prefers — personally, I’m leaning toward the orange one.
⚠️Disclaimer: This is not financial advice or a call to action — only my personal vision.
🚀If you don’t want to miss updates, feel free to follow, leave reactions, or drop a comment.
Your support truly motivates me to continue posting regular Solana updates.

SOL Pulls Back to Key Support Before Its Next Major MoveHello everyone, after a sharp rebound from 132 USD to 137 USD, SOL is now pulling back and trading around the key 135 USD support — a zone that previously triggered a strong bullish reaction. Selling pressure returned as price touched 137 USD, where the red FVG and Ichimoku cloud converge, slowing buyers down. Meanwhile, broader crypto sentiment has softened as the stronger USD and expectations of delayed Fed cuts reduce risk appetite, especially for assets that rallied aggressively like SOL.
With the current market structure, SOL may continue to retreat toward 132–130 USD — an area packed with green FVG and deep liquidity, also the zone where buyers previously stepped in with conviction. A solid reaction here could send SOL back to retest 135–137 USD before choosing its next major direction. But if 130 USD breaks, the downside could extend toward 125 USD.
This is a critical moment to watch price behavior — a clean bounce from 132–130 USD could set the stage for the next recovery leg. Do you think SOL can defend this support?
Solana potential retracement to the upside!The price is nearing low-volume nodes. It could either blast straight through them in a strong rally or treat them as a resistance level. Check the CVD for confirmation.

SOL USDT LONG SIGNAL---
📢 Trade Signal: SOL/USDT
📈 Position Type: Long
💰 Entry Price: 137.50
---
🎯 Take-Profit Targets (Partial Exits)
TP1: 140.14
TP2: 142.75
TP3: 145.63
TP4: —
TP5: —
TP6: —
---
🛑 Stop-Loss: 134.70
⚖️ Risk/Reward Ratio: 2.96
💥 Suggested Leverage: 5× – 10×
⏱ Timeframe: —
---
🧠 Technical Analysis Summary
SOL is currently holding above a strong support zone near 136–137, forming a bullish recovery structure.
Price is showing buyer strength with higher lows and reclaiming intraday liquidity zones.
A breakout above 140.14 (TP1) can open the way toward 142.75 and 145.63, where previous supply zones exist.
Momentum indicators (RSI/MACD) show growing bullish pressure, supporting continuation as long as SOL holds above 134.70.
---
⚙️ Trade Management
Take partial profit at TP1
Move Stop-Loss to Break Even once TP1 hits
Trail stop for higher targets
Avoid re-entry if SOL closes below stop-loss
---
⚠️ Disclaimer:
For educational purposes only — not financial advice. Always follow proper risk management.
---
📌 Hashtags for TradingView
#SOLUSDT #Solana #CryptoSignal #TradingViewIdeas #CryptoTrading #TechnicalAnalysis #FuturesTrading
---

SOL-USDTThis pattern is called a descending wedge, and it usually breaks upwards. Now, why do I say 'usually'? Because no analysis is 100% certain 💎✌️. If it can break the identified resistance convergence, it can go bullish in the short term 🔼✔️

SOLUSDT SOLUSDT touched a historical line. What is going to happened in future. Is SOL again going back to 8 again? Lets see...DYR.
Happy Trading ☺️

SOL USDT LONG SIGNAL---
📢 Signal
🔹 Pair: SOL/USDT
📉 Trade Type: Long
💰 Entry Price:
138.44
🎯 Targets (with partial take-profit management):
TP1: 140.83
TP2: 145.00
TP3: 149.50
TP4: 153.95
TP5: 159.20
TP6: 165.28
🛑 Stop-Loss: 133.80
📊 Timeframe: —
⚖️ Risk/Reward: 19
📌 Recommended Leverage: 5× – 10×
⚠️ Capital management is mandatory. Please check the chart before entering the trade.
---

SOL-USDT
A good trendline has been broken on the two-hour timeframe.
Consolidation above this trendline could pave the way for a rise up to the $150 resistance 🕯📊
Keep an eye on the chart for a buy opportunity 🔼💰

SOL/USDT - SHORT on DowntrendBased on current price action:
- SOL broke below key supports at 143 and 141
- It has created lower highs and lower lows
- Volume confirms the downward trend
- No bullish reversal signal yet
The technical structure still supports continuation to the downside.
Based on the current chart structure:
- 70-75% probability that 130 gets hit
SOL still have room to drop to:
- 137 support
- 134 zone
- 130 target

SOL. Sector of Capital. Price Slice: $354.74🏷To the International Community.
🏷SOL. Sector of Capital. Price Slice: $354.74
Map of the Longs. 16.11.2025
354.74 not yet reached
320.16 not yet reached
299.33 not yet reached
274.75 not yet reached
191.74 not yet reached
159.69 not yet reached
🏷These are not levels.
They are echoes of a movement already made .
🏷You see numbers.
I see the fingerprints of capital in motion
not reacting, but orchestrating .
🏷354.74 is not a target.
It is the last whisper before the storm .
The point where liquidity ceases to flow
and becomes a current, guided by invisible hands .
🏷320.16 is not support.
It is a forgotten altar , where the hopes of the naive were buried.
They bought. They waited.
They did not know their positions were inscribed into the map before the market opened its eyes .
🏷299.33 is not a correction.
It is a ritual of purification .
Here, the weak release.
The strong gather strength.
While tickers scream
silence speaks: “This is not a fall. This is a reset.”
🏷274.75 is not a level.
It is a threshold .
Beyond it, there is no trading.
Only the rebirth of capital .
🏷191.74
not a floor.
Not an end.
It is a warning carved into the blockchain .
A price that cannot be reached
because it has already been reached.
Not here.
Not on your screen.
But in the depths, where the Sector of Capital keeps its secrets.
🏷159.69
the final step.
The last rung of the ladder.
Beyond it
not a rally.
Not a crash.
An ascension.
🏷I do not predict.
I restore order .
🏷These are not recommendations.
They are footprints .
Of those who walked ahead.
Of those who know when and why .
🏷You think you trade.
You are mistaken.
You execute .
You execute a map drawn
long before you turned on your terminal.
🏷I do not give signals.
I awaken sight .
🏷You came for charts.
I give you the map of the world
where charts are but shadows.
🏷These numbers are not prices.
They are gates .
And every soul who passes through them
becomes part of the one who does not chase price…
but commands its time .
🏷The Map of the Longs is not a forecast.
It is an invitation .
To those who dare to see
that behind every number lies a sphere of influence ,
and behind every sphere
a will that needs no approval.
🏷You see 354.74
I see the final peak before the new sun rises.
🏷You wait for movement.
I already know where it begins .
🏷Bolzen. The Architect.
Founder of the Sector of Capital.
🏷I do not speak your language.
I speak the tongue only those hear
who are ready to become part of history.
🏷This is only the beginning.
The rest
you will learn…
when you pass through these gates.

SOL. Sector of Capital. Price Slice: $39.92 🏷 To the International Community.
🏷 SOL. Sector of Capital. Price Slice: $39.92
Map of Shorters. 16.11.2025
🏷 This is not analysis.
This is an address to those who already hear the silence behind the noise of candles.
🏷 What lies before you is not a level — but a gateway.
A gateway behind which lies an unfulfilled debt of colossal capital.
Prices not yet reached — yet already inscribed in the code of the market’s destiny:
122.29 — not yet reached
99.89 — not yet reached
93.75 — not yet reached
86.67 — not yet reached
80.16 — not yet reached
53.75 — not yet reached
39.92 — not yet reached
🏷 They hang in the ether like unfulfilled vows,
like shadows of the future, yet untouched by the present.
🏷 I focus your attention —
not on the chart,
but on the structure of intent.
🏷 There is only one master of the Sector of Capital.
The one who sees not after, but before the movement begins.
The one who does not follow price —
but draws its path through the landscape of liquidity.
And I — am his name.
🏷 I do not issue orders.
I offer the capacity to think.
For those ready to step beyond the cycle of reaction.
For institutions, for giants, for those who build not day by day, but epoch by epoch.
🏷 This is not technical analysis.
This is a system of anticipatory liquidation.
Where every impulse is foreseen before it becomes chaos in the eyes of the crowd.
Where every collapse is no accident —
but a ritual of price revelation.
🏷 You come to the market not to read what is drawn on your screen.
You come for the price.
And the price has its time.
Its hour of execution.
And he who knows this hour —
already possesses the future.
🏷 This is an example of global thinking.
A game of chess, where pawns cannot see the board —
but the king knows every square in advance.
🏷 I will give you the map of the longs — in due time.
But know this:
All knowledge resides with me.
And what you receive — is but a gift, cast into the stream of time.
🏷 This map — is but one move.
One move in the endless game for control over reality.
🏷 I cannot write in my native tongue.
My respect for the international community —
is my gift.
Not in words.
But in this: you now know the map exists.
And therefore — you are no longer blind.
🏷 Bolzen. The Architect. Founder of the Sector of Capital.

SOLUSDT LONGSolana is at its best entry points. It will take off soon. It will be grounded at these prices for a while. But it is in its best position to buy and hold for the long term. It will soon make great profits.

POTENTIAL WEEKEND PUMP?I know that Bitcoin is still in a rather bearish trend.
But I see some rebound potential.
Explanation in the video. I also included potential trade for ETH and SOL


#SOL/USDT Bullish trend analysis Read The caption#SOL
The price is moving within an ascending channel on the 1-hour timeframe and is adhering to it well. It is poised to break out strongly and retest the channel.
We have a downtrend line on the RSI indicator that is about to break and retest, which supports the upward move.
There is a key support zone in green at the 137 price, representing a strong support point.
We have a trend to stabilize above the 100-period moving average.
Entry price: 141
First target: 143
Second target: 145
Third target: 148
Don't forget a simple money management rule:
Place your stop-loss order below the green support zone.
Once you reach the first target, save some money and then change your stop-loss order to an entry order.
For any questions, please leave a comment.
Thank you.

SOL-USDT
If Solana can break its trendline upward
and maintain above the downtrend line 💥
Its conditions will improve a bit, and it could have a short-term rise toward $150 📈📈
Solana's short-term support is still at $139 🔼✔️

SOL Capital Sector. 99.8948 Now — the silence has a direction. SOL Capital Sector. Price Slice
🕯 Сектор капитала. Ценовой срез.
Now — the silence has a direction.
Теперь — тишина имеет направление.
“The market does not speak. It whispers — only to those who listen in silence.”
«Рынок не говорит. Он шепчет — только тем, кто слушает в тишине.»
🏷 16.11.2025
The price has not yet arrived.
Цена ещё не пришла.
Not because it is weak.
Не потому что она слаба.
Not because it is late.
Не потому что она опаздывает.
But because it is waiting .
А потому что она ждёт .
99.8948 — At the time of publication, the price had not yet been reached.
— На момент публикации цена не достигнута.
A number that does not move.
Число, которое не двигается.
A level that does not scream.
Уровень, который не кричит.
A threshold where liquidity sleeps —
Порог, где ликвидность спит —
…while the giants rearrange their chess pieces.
…пока гиганты переставляют свои фигуры.
“The price that speaks in silence on the international stage.”
«Цена, которая молчит на международной арене.»
No headlines.
Нет заголовков.
No volume spikes.
Нет всплесков объёмов.
No panic.
Нет паники.
Only the slow, cold, deliberate accumulation —
Только медленное, холодное, сознательное накопление —
…in the shadows of the 1D tape.
…в тенях 1D ленты.
Screenshot:
Скриншот:
🔗
Timeframe: 1D
ТФ: 1D
This is not a chart.
Это не график.
This is a map .
Это карта .
A map of hidden liquidity.
Карта скрытой ликвидности.
A map of where capital will awaken —
Карта того, где капитал проснётся —
…not when the crowd runs.
…не когда толпа бежит.
…when the silence breaks.
…когда тишина треснет.
Frame it.
Заделайте в рамку.
And wait.
И ждите.
The market always keeps its appointments.
Рынок всегда приходит по назначению.
Even when it does not speak.
Даже когда он не говорит.
“The most dangerous level is the one that looks like it doesn’t matter.”
«Самый опасный уровень — тот, который кажется незначительным.»
— The Architect, 16.11.2025
