SOL/USDTCRYPTOCAP:SOL has clearly formed a double bottom pattern, signaling strong reversal momentum. The target aligns with the end of the blue arrow, and once confirmed, it’s set for an explosive move to the upside.
SOLUST.P trade ideas

SOL-USDTFailure to break $265 🔽
And on the other hand above the bottom of $226🔼
Let either the resistance be broken for a buy
Or the support number I mentioned be lost for a sell on Solana 🔽💲

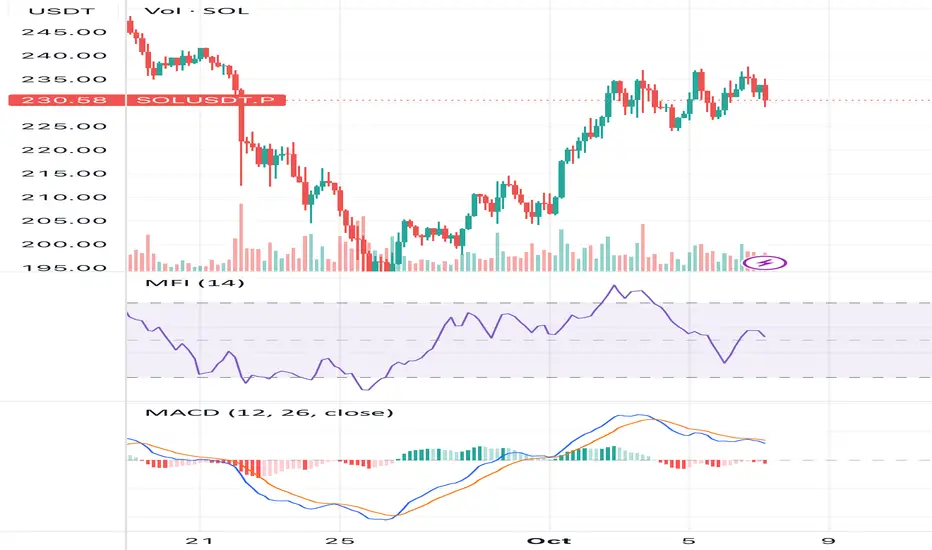
Triggers: 4h-close below 235 and/or < 230.9 (Don20-Mid) with RSIWhat does it mean now
1. The structure is "bullish but thin": the price is at the tops of Donchian/BB/Keltner, ADX ~33 and CMF>0 confirm the trend, but the MACD-hist −0.11, a series of bearish divergences (RSI/MFI/OBV), and a low OI (z −1.34) indicate that the momentum is going without a noticeable set of futures positions.
2. Squeeze ON ~13 bars: the market is compressed, and an impulse exit is likely.
3. Profile: a strong HVN core of 202-208 (POC ~207.9), we are trading above, VAH ~239.7 near the current price → above the supply zone.
4. Premium to VWAP ~+1.1σ: there is upward space, but it is already "not cheap" relative to average demand.
⸻
Key levels
• Resistance: 237.75 (Donch-High 20/55) → 239.66 (VAH) → 244.9–245.0 (LVN-thin zone).
• Supports: 235–231 (BB/EMA20/Don20-Mid 230.9) → 224.0–221.2 (BB-/KC-low) → 207.9 (POC) → 202–208 HVN-cluster → 197.9 (Don55-Low zone of the upper range).
⸻
Scenarios and triggers (not financial advice)
A) Basic — rotation/balance above the averages with a check of 230–232
Why basic: Squeeze ON, MACD goes out, divergences are bearish, and OI is low — more often, the market "chews" the level before choosing a direction.
• Triggers: 4h-close below 235 and/or < 230.9 (Don20-Mid) with RSI<55 / MACD weakening, without OI growth.
• Targets: 231 → 224–221 (edge of bands/channels). Deeper — retest 207–208 (POC/HVN) if the impulse fades.
• Invalidator: quick return and fixing > 237.8.
B) Pulse break-up (Squeeze-release)
• Trigger: 4h-closing > 237.8 + buffer ≈ +0.1·ATR ≈ +0.45$ (i.e. > 238.25) and holding above 237.8 at CMF≥0, OBV↑, preferably OI↑.
• Targets: 239.7 (VAH) → 244.9–245.0 (LVN) → with good OI, expand to higher levels.
• Invalidator: return < 235 on increased volume.
C) Bearish reversal from VAH/Don-High
• Trigger: rebound from 237.8–239.7 with 4h-close < 235, RSI↓, MACD-hist in the red, OI↑ on the red candle (inflow of shorts).
• Targets: 230.9 → 224–221 → 207–208.
• Invalidator: re-capture > 238.3 with OI not falling.
⸻
Tactics (example of logic)
• Pullback long (conservative): monitor demand in 231–232 (candle reaction + CMF≥0, OBV↑). Stop — below 224-221, targets — 235 → 237.8 → 239.7.
• Impulse long (aggressive): after 4h-close > 238.25 (breakdown with buffer), partial fixation at 239.7, trail to 244.9–245.0.
• Countertrend short: only with a clear rejection in the 237.8–239.7 zone + confirmation (RSI/MFI down, MACD-histo < 0, OI↑). Targets are 235 → 230.9 → 224–221; stop is at ~240–241.
⸻
Briefly: what to expect
• Base: consolidation/rotation in 231–238 with a risk of moving to 224–221 until momentum and OI confirm a breakout.
• If we gain a foothold above 238.25, we can expect an upward move to 239.7 → 244.9–245.0.
• If we lose 230.9, we can expect an upward move to 224–221, and if we are weak, we can expect an upward move to 207–208.
SOLANA LONG SETUP Liquidity Run: BTC & ETH swept lows to take out stops.
SMT Divergence: SOL held strong while majors dipped → bullish imbalance.
Bullish Order Block (OB): Price is rejecting from a demand zone after the SMT confirmation.
Fair Value Gap (FVG): Above current price, likely to be rebalanced as SOL seeks higher prices.
🎯 Bias: Bullish on SOL
Entry: Off the OB rejection after SMT confirmation
Target: 240+ (premium array)
Invalidation: Below 228 (sell-side liquidity)

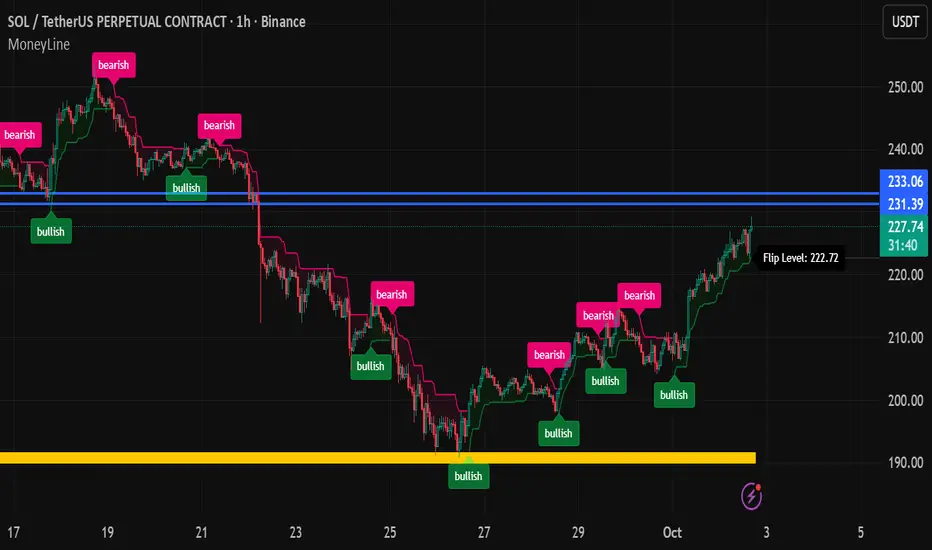
Next Stop for SOLThis is the next area for some consolidation before continuation LOL. Personally not taking profits in this area. That's because of my entry point. (I'm only up 35% at this level) I may pick more up if we can break above $233. Lets go!!
SOL Long Alert 1hTimeframe 1h Direction Long waiting retracement, confluence with imbalances & fibbonaci golden ratio, waiting for rejection candle (Bullish Engulfing/Green Hammer) to continuing the bullish trend,
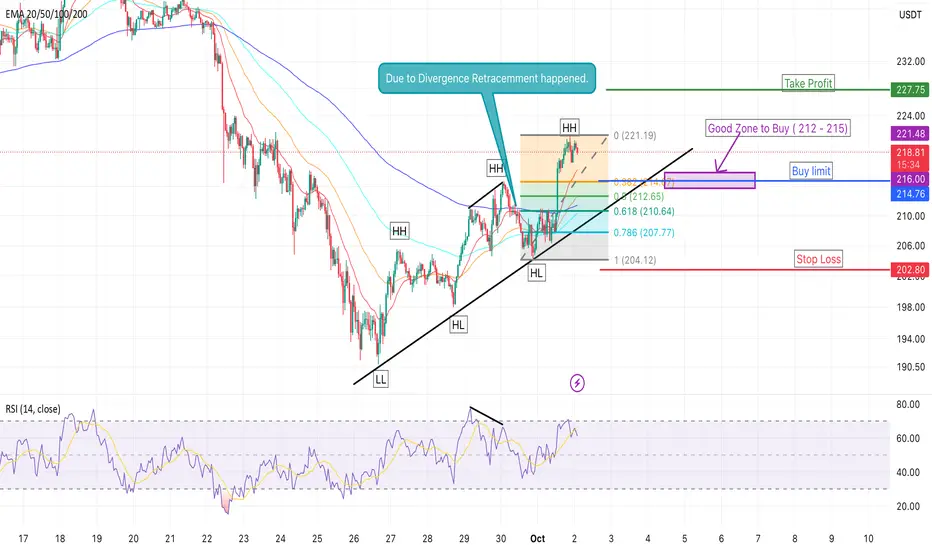
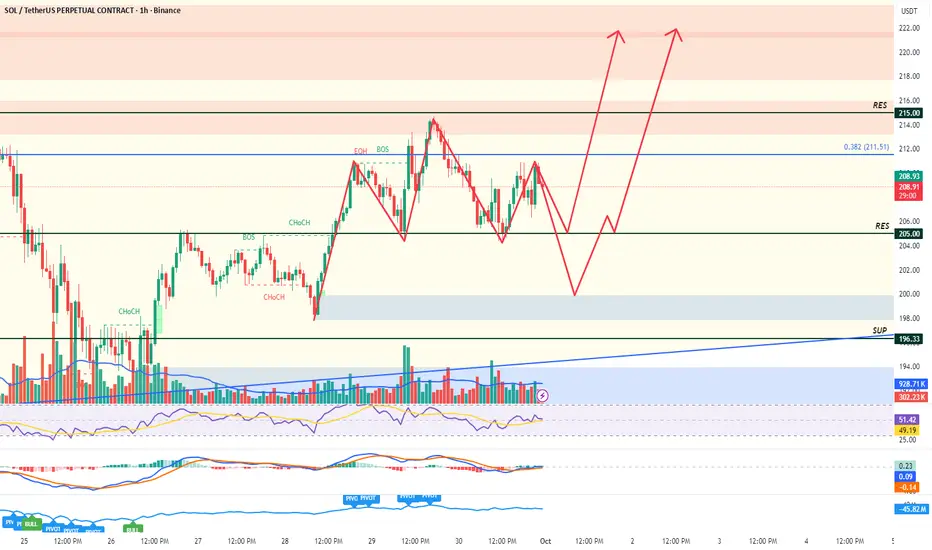
SOL/USDT: Breakout or Pullback? Key Levels AheadOn the 1H timeframe, Solana is showing a clear bullish structure with consistent Higher Highs (HH) and Higher Lows (HL). The ascending trendline is well respected, supporting the bullish move.
🔎 Technical Outlook
Price recently made a new HH at 221 before pulling back.
Current retracement is testing the Fib 0.382 level around 214.5 which also aligns with dynamic support from the EMA cluster.
Deeper retracement levels to watch:
Fib 0.5 (212.5)
Fib 0.618 (210.5) – strong confluence with trendline support.
RSI (62): Slight bearish divergence forming, suggesting short-term pullback possible.
📈 Bullish Scenario
If SOL holds above 214–212 support, we may see a continuation toward 225–230 next resistance zone.
📉 Bearish Scenario
A break below 210.5 and trendline would invalidate bullish structure → price could retest 204–205 support zone.
⚡️ Fundamentals
Solana continues to gain traction with high DeFi and NFT activity.
Overall sentiment in altcoins remains bullish, supporting continuation.
✅ Trading Plan
Watch 214–212 as key support.
Long entries possible near Fib 0.5–0.618 with tight SL below 204.
Target: 225 / 230.
💬 What do you think? Will SOL hold the trendline for another leg up, or is a deeper correction coming? Drop your thoughts below and follow for more updates!
📌 Disclaimer: This is my personal analysis, not financial advice. Trade safe and manage risk.
solusdt, solana, solanausdt, solanalysis, solchart, solanacrypto, solbullish, solbearish, solsetup, solanatrend, crypto, cryptotrading, cryptomarket, cryptocurrency, altcoins, altcoinanalysis, altcoinseason, altcoinsetup, altcoinguide, defi, nft, bullrun, breakout, trendline, fibonacci, support, resistance, ema, rsi, divergence, higherhighs, higherlows, technicalanalysis, chartanalysis, tradingsetup, cryptotrader, tradingview, tradeideas, bullishsetup, bearishtarget, cryptosignals
SOLANA LongSolana Breaks 1hr resistance , that is a good Bullish signal to go long targeting daily order block

scalp your soul again Hi
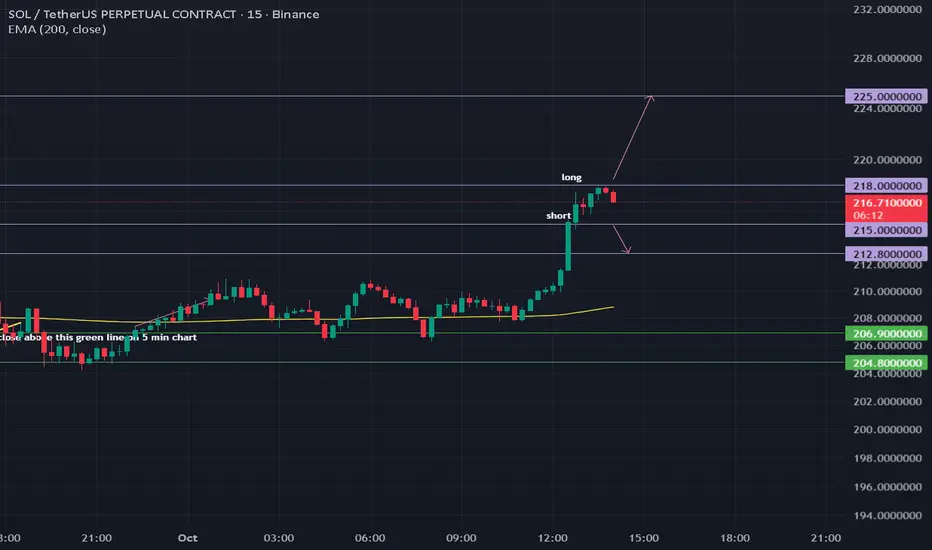
This trade targets the next major liquidity zone, capitalizing on the momentum generated by the market structure breakout and ETF speculation.
Momentum Trigger: Enter on a confirmed break and close above the current high (≈$217.42) to validate continuation after the current brief consolidation.
TP 225 A ≈3.2% move, targeting the next major psychological level and the midpoint between the current price and the all-time high zone
SOL 1H: Next Move IncomingGood morning, Solana is currently at the lower part of the channel and has tested the ascending trendline multiple times. A breakdown of this trendline could push the price down to the first support level, around $198. Conversely, a bullish breakout could drive Solana to the upper part of the channel, around $220. Awaiting confirmation.
Thank You!

SOL-USDTYesterday we recognized Solana's correction well and I hope you used it 💲📣
In today's update, Solana is fluctuating inside the specified compression
If Solana manages to get its downtrend line out of the way 👀
It could enter a bullish phase in the short term 🔼💲

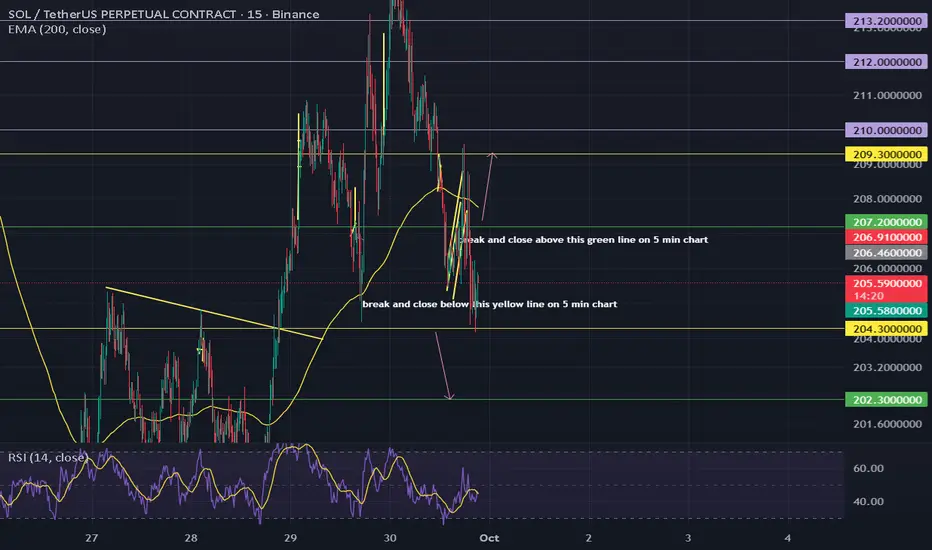
Immediate pullback followed by a runI see two possible outcomes here. Either we hit resistance at 205 and bounce to 220ish area or we break resistance and head towards 198 before we make the next move up. NFA. Happy Trading!
scalp your soulWait for the trigger. Do not pre-empt the breakout. The market is currently consolidating and chopping. The 1% move becomes "almost 100% certain" (in trading terms, meaning highest probability) only once one of these channel boundaries breaks on high volume.
Monitor Open Interest and Funding Rates as the move begins. A sharp drop on the short entry or a significant rise on the long entry will confirm the leveraged market is participating in the move.
Solana at 200 Support — Bounce Toward 230 or Deeper Drop?At the moment, Solana is in an upward correction but has already reacted from the weekly pivot point at 212 . I expect to see support around the 200 – 202 zone, though a dip to 198 is also possible.
However, if the price gets stuck below 198 and fails to quickly recover above 200 , the scenario with continued downside will become the priority.
For now, I’m looking for a move down into the 200 – 202 area, followed by growth with a new local high and a push toward the first resistance level at 230 .

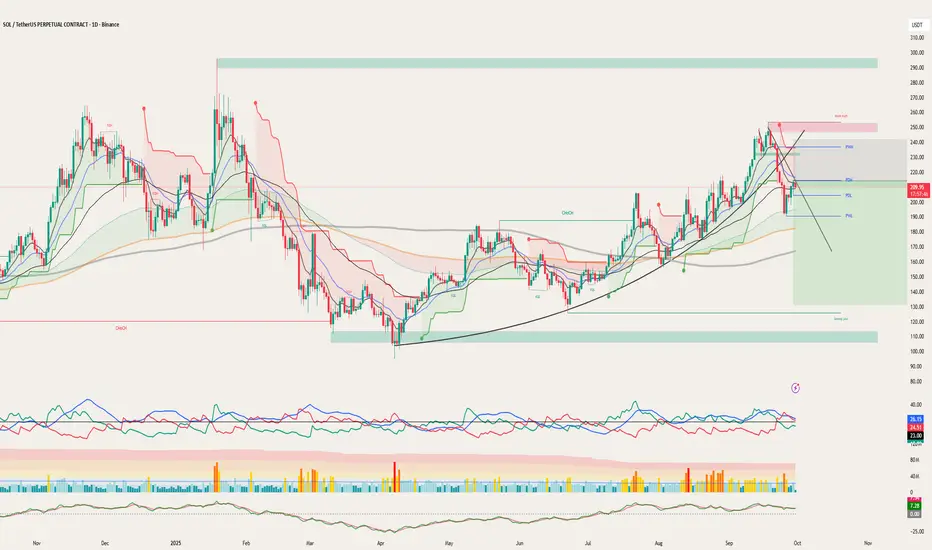
Buy/Sell (long/short) areas for major cryptos part IIIthis is a continuation of the successful part II analysis:
note for this part III is that the green zone mid october which it seems to be a good bottom for future red zones.
November looking like a potential full green month, maybe we see a good run around then.
gl

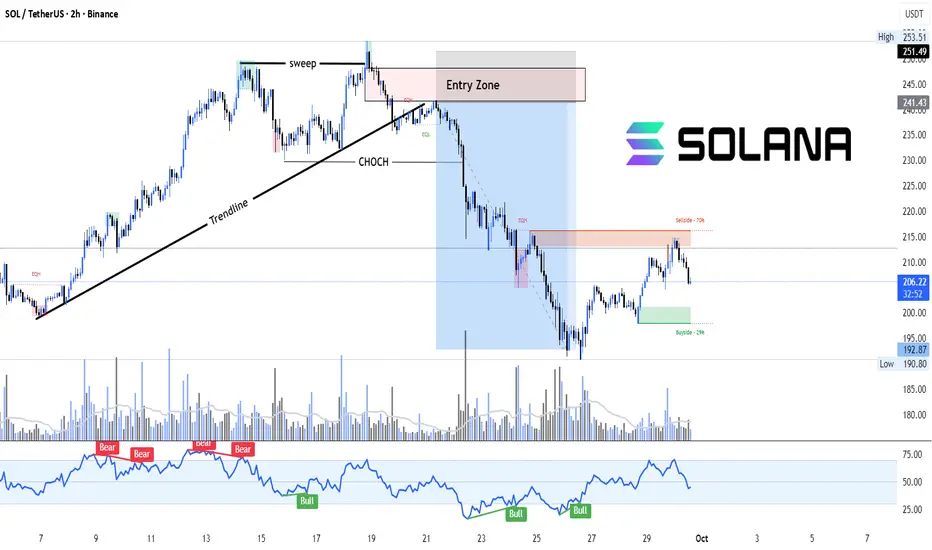
SOL: From Sweep to Selloff – Supply in ControlSolana (SOL/USDT) recently broke below a strong trendline after a liquidity sweep and clear Change of Character (CHOCH). Price retested the supply zone (Entry Zone) before continuing its downward move, showing a classic bearish market structure shift.
Currently, price is reacting from a sell-side zone (~70% retracement), with potential downside targets toward the buy-side liquidity (~29% retracement). RSI also reflects bearish divergence confirmation from the highs, aligning with the structural shift.
Key Highlights:
Engulfing candle + Trendline break + CHOCH confirmed bearish bias.
Entry Zone retest offered high-probability short setups.
Current rejection from supply signals further downside.
RSI divergence strengthens bearish case.
Solana rising wedge tests trendline support ahead of macro catalStructure: After a strong multi‑month rally, SOL is coiling in a rising wedge. The price sits above a key ascending trendline but below a descending resistance line from its recent peak.
Momentum: Moving averages are converging and volume has tapered off, suggesting momentum is slowing.
Key triggers: A clear breakout above the descending resistance would signal renewed strength; a breakdown through the trendline could extend the pullback toward lower support.
Risk factors: Macro events—non‑farm payrolls, the monthly inflation report, and the late‑October Fed meeting—may trigger volatility across markets.
Trade idea:
Bullish: Wait for a daily close and retest above the wedge; use stops below the recent swing low; aim for the next major resistance zone.
Bearish: Watch for a close below the ascending trendline; short a retest of that level with stops above; target the next demand area.
Reminder: Manage risk carefully and adapt as market conditions evolve.

[SOL] ATH HuntingAfter massive liquidations on the crypto space, I am willing to add to my long here and definitely on CRYPTOCAP:SOL since it's my biggest position (and winner).
Great Trade !
Sol market snapshotIf SOL cannot break above 245, there is a chance of forming a reversal pattern — Head and Shoulders (H&S). The right shoulder should not exceed the head.
Main conditions of the Head and Shoulders pattern:
Three peaks:
Left shoulder — the first local peak formed after the price rises.
Head — a higher peak following the left shoulder.
Right shoulder — a peak approximately at the same level as the left shoulder, formed after the decline from the head.
Neckline:
Connects the lows between the left shoulder and the head, and then between the head and the right shoulder.
The neckline can be horizontal or slightly sloping.
A break below the neckline confirms the pattern and signals a potential price decline.
Volume:
Volume is often high at the left shoulder, may be higher or lower at the head, and usually decreases at the right shoulder.
Declining volume during the formation of the right shoulder strengthens the bearish reversal signal.
Movement after the breakout:
After breaking the neckline, the price is expected to fall approximately the same distance as from the neckline to the head’s peak.

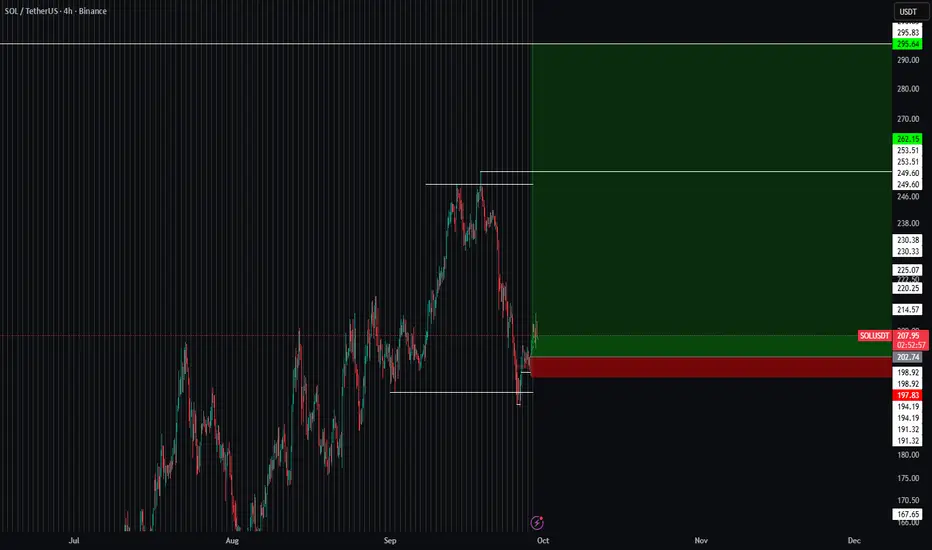
SOLUSDT: Retracing FVG, Touching Kumo Cloud – Key Zone 212–215?Hello everyone, let’s take a look at SOLUSDT on the H4 chart.
Structurally, the primary trend remains bearish, forming a sequence of lower highs and lower lows, while the current upward movement is mainly a pullback filling the Fair Value Gaps (FVG). The immediate resistance zone lies between 212–215, coinciding with the Ichimoku cloud boundary and previous balance areas. A decisive break above this range could open the path to 220–223 and further to 228–232 (the upper red FVG cluster). On the downside, support is found at 205–202 – a newly formed green FVG. A strong breach would expose 198–195 as the next floor, and deeper support around 190–188 – the recent swing low.
From a news perspective, market sentiment continues to revolve around risk appetite: Bitcoin movements, ETF inflows/outflows, the DXY, and US Treasury yields heavily influence altcoins including SOL. This week’s US economic calendar is dense with ADP, Jobless Claims, PMI/ISM, and Non-Farm Payrolls – strong data could reinforce USD/ yields, pressuring risk assets; weaker numbers would support the rebound. Solana-specific catalysts such as network performance, dApp/TVL metrics, airdrops, or congestion events can further amplify breakouts or rejections around the mentioned FVGs.
In the preferred scenario, SOL may pull back to 205–202 to fill the green FVG, creating a higher low before retesting 212–215. A break and hold above 215 with improving volume could target 220–223 and extend to 228–232.
Where do you see SOL heading? Will this rebound hold or will it test the 200 area soon? Share your thoughts!

SOL TA 29.09The sectors are already 10% away from the important zone, and I don't see any signs of a decline from the current level. The most important resistance is R1 (211-212.5) – if we break it, there's a high chance we'll finally be able to renew the ATH. After R1, the nearest normal resistances are at 235-240.
The closest vital support zone is still relevant – 190-193. There's nothing particularly significant before it, just a couple of local minor ones, but they could trigger further growth.

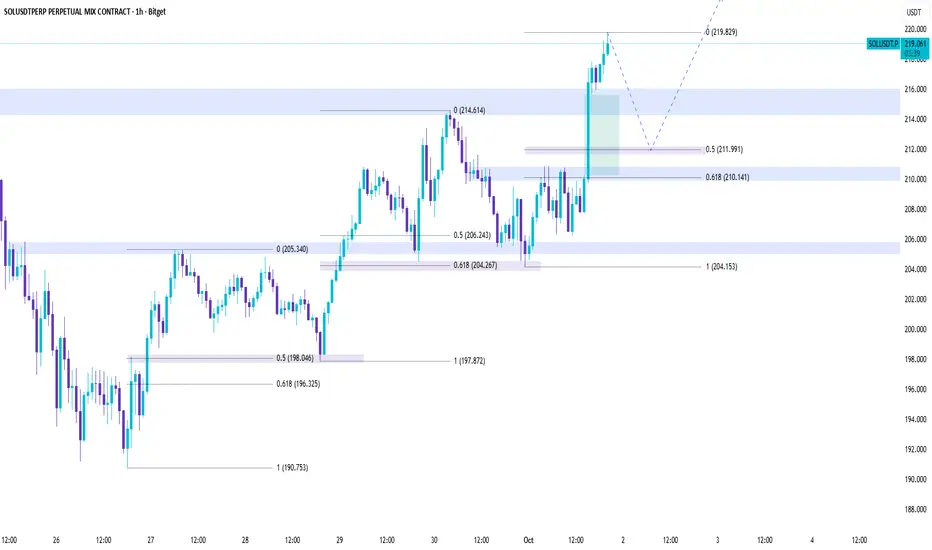
SOL LONG : Time for $300?Pullback to 0.618 fib complete.
Looks like it's time for another leg up. Is it time to test $300 for SOL?.
