SOL Capital Sector. 99.8948 Now — the silence has a direction. SOL Capital Sector. Price Slice
🕯 Сектор капитала. Ценовой срез.
Now — the silence has a direction.
Теперь — тишина имеет направление.
“The market does not speak. It whispers — only to those who listen in silence.”
«Рынок не говорит. Он шепчет — только тем, кто слушает в тишине.»
🏷 16.11.2025
The price has not yet arrived.
Цена ещё не пришла.
Not because it is weak.
Не потому что она слаба.
Not because it is late.
Не потому что она опаздывает.
But because it is waiting .
А потому что она ждёт .
99.8948 — At the time of publication, the price had not yet been reached.
— На момент публикации цена не достигнута.
A number that does not move.
Число, которое не двигается.
A level that does not scream.
Уровень, который не кричит.
A threshold where liquidity sleeps —
Порог, где ликвидность спит —
…while the giants rearrange their chess pieces.
…пока гиганты переставляют свои фигуры.
“The price that speaks in silence on the international stage.”
«Цена, которая молчит на международной арене.»
No headlines.
Нет заголовков.
No volume spikes.
Нет всплесков объёмов.
No panic.
Нет паники.
Only the slow, cold, deliberate accumulation —
Только медленное, холодное, сознательное накопление —
…in the shadows of the 1D tape.
…в тенях 1D ленты.
Screenshot:
Скриншот:
🔗
Timeframe: 1D
ТФ: 1D
This is not a chart.
Это не график.
This is a map .
Это карта .
A map of hidden liquidity.
Карта скрытой ликвидности.
A map of where capital will awaken —
Карта того, где капитал проснётся —
…not when the crowd runs.
…не когда толпа бежит.
…when the silence breaks.
…когда тишина треснет.
Frame it.
Заделайте в рамку.
And wait.
И ждите.
The market always keeps its appointments.
Рынок всегда приходит по назначению.
Even when it does not speak.
Даже когда он не говорит.
“The most dangerous level is the one that looks like it doesn’t matter.”
«Самый опасный уровень — тот, который кажется незначительным.»
— The Architect, 16.11.2025
Trade ideas

SOL Capital Sector. Price Slice 159.6973 🏷 SOL Capital Sector. Price Slice
🏷 He Remembers” — The SOL Sector Is Not a Level. It Is a Memory
🏷 Он Вспоминает» — Сектор SOL — Это Не Уровень. Это Память.
🏷 16.11.2025
🏷 Сектор капитала. Ценовой срез.
🏷 159.6973 — At the time of publication, the price had not yet been reached. ( на момент публикации цена не достигнута )
🏷 142.5641 — Level confirmed. ( уровень подтвержден )
🏷 This is not analysis.
This is archaeology of capital.
The past is not gone.
It is waiting.
And it remembers…
everything.
— The Architect
🏷 Это не анализ.
Это археология капитала.
Прошлое не ушло.
Оно ждёт.
И оно помнит…
всё.
— Архитектор

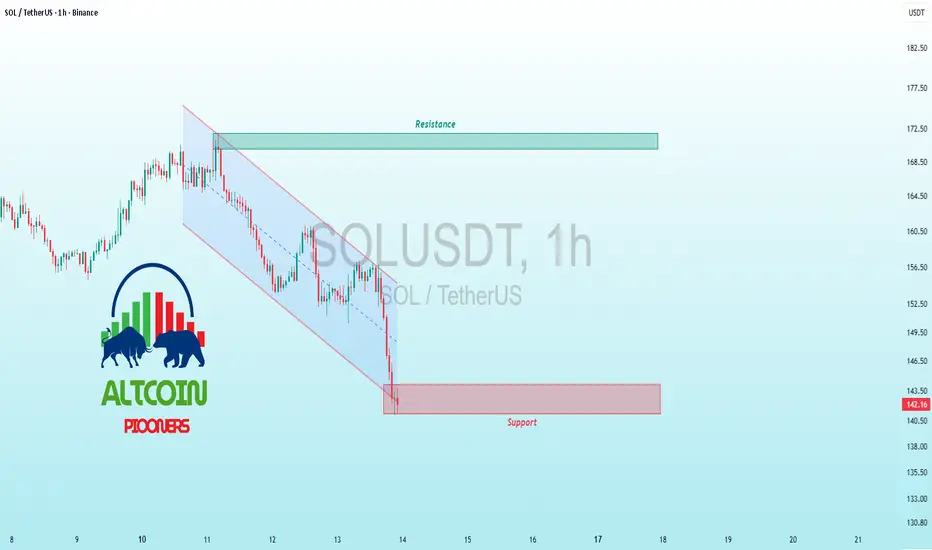
$SOL Support Siege – Rebound Rocket or Meme Coin Mayhem?BINANCE:SOLUSDT CRYPTOCAP:SOL Support Siege – Rebound Rocket or Meme Coin Mayhem?
Altcoin Pioneers! 🔥 SOL/USDT 1H is grinding down that black descending trendline, now teetering on key support at ~137 after a vicious rejection at resistance 160. DeFi darling holding tough amid BTC bleed, but that red hammer wick screams indecision – volume's key to the breakout.
Hold support? Prime setup for a V-reversal if buyers stack in; RSI dipping to 30 with bullish divergence. Breakout above resistance? Explosive on Solana upgrade news, targeting 165. Deeper dip risk? Oof – crack it and 132 (Fib 0.5) looms, dragging alts lower.
Target: Snapback to 148 if holds, slide to 135 on fail. Watching: Stochastic oversold cross, ATR for vol spike, and SOL/BTC for relative strength. Sol squad, HODL or fold? 🚀📉
#SOL #SolanaAnalysis #CryptoTrading

SOLANA SOLUSDT WEEKLY PERSPECTIVE AND SUMMARY OF PRICE ACTION SOLONA current price =142.50$
Solona is about to experience a drop in price based on structure of the market ,the price rejection of 295.95 in January on weekly time frame was a classic reaction on the the weekly ascending trendline that doubles as the neckline of the head and shoulder pattern and it wont go down without a significant sell off to reset the market after the at all time high rejection at 295.95 .the weekly candle came back on a psychological horizontal trendline and rejected again at 251.800$ zone on weekly time frame and trigger sell order which break above will be a buy confirmation with target exceeding 350$ is possible .
buyers will have show that they have the much needed liquidity to keep price at the current support zone ,otherwise break and close 131.94$ as illustrated on the chart on weekly TF will find support at 78.47-72.9$ zone
FOMO, this habit makes a lot traders close position or open position, if we retest the 78.47-72.95 zone ,many traders might shot into discount liquidity traps which could likely be in the zone of 28.81-15.83$ zone .
the trade directional bias remains bullish but i believe that if we respect the current demand floor and buy into 189.04 supply roof which double as a broken demand floor to become our current supply roof ,i will look for sell opportunity from that zone and hold till 78.47-72.8$ zone and aggressive sell off could extend into 28.81-15.83 zone .
SOLANA FUNDAMENTAL .
Solana (SOL) is a high-performance blockchain platform known for its scalability, fast transactional speeds, and low fees, making it popular for decentralized applications (dApps), DeFi, NFTs, and Web3 projects. It uses a unique Proof of History (PoH) consensus mechanism combined with Proof of Stake (PoS) to achieve high throughput, often exceeding thousands of transactions per second.
solana High scalability and low latency enable extensive adoption in gaming, decentralized finance, and NFT marketplaces.
the active developer community with a growing adoption of layer 1 and layer 2 solution
the planed network upgrades will double its space and boot the capacity and ecosytem growth
Major Shareholders Pushing for Solana ETF:
Several institutional investors and asset managers hold significant shares in Solana ETFs, including:
Heck Capital Advisors LLC
Tactive Advisors LLC
Militia Capital Partners LP
Brighton Jones LLC
These firms actively support Solana exposure through ETFs, boosting institutional interest and liquidity.
Solana ETF Approval Outlook:
The U.S. Securities and Exchange Commission (SEC) is in the final stages of reviewing multiple spot Solana ETF applications.
Approval is widely expected imminently before the close of 2025 .if this happens it will become a major catalyst for growth
Summary
Solana is a fast, scalable blockchain driving innovation in DeFi, NFTs, and dApps, backed by a growing institutional investor base pushing for ETF adoption. Approval for spot Solana ETFs in the U.S. is highly likely by late 2025, which would be a significant growth driver.
GOODLUCK.

SOL 1H – Long Bias
After the strong downside move, SOL swept sell-side liquidity, tapped into the 1H demand block, and printed a shift in short-term orderflow. The market is now showing the early signs of reversal → continuation, with price consolidating above the reclaimed imbalance.
Key confirmations visible on the chart:
Sell-side liquidity taken
Return into 1H FVG + OB
Alligator compression → early curl up
Price trading back above the mitigation zone
Clear inefficiencies above acting as magnets
This gives us a clean long continuation setup as long as the demand at the lows holds.
📌 Trade Parameters
Entry:
📍 141.70 – 142.20
Stop Loss:
📍 134.94
🎯 Take Profits
TP1: 150.00
TP2: 155.00
TP3: 160.50


SOL LONG : Falling Wedge CompleteThink we've seen the last leg down of this falling wedge pattern. Breakout wave up with a target of around $195 first before retracing to $158.
Real long entry begins after retracement with a final year target of above $250

$SOL Bearish Channel Squeeze Toward Support TestBINANCE:SOLUSDT CRYPTOCAP:SOL Bearish Channel Squeeze Toward Support Test
SOL in tight downtrend channel, eyeing critical support at $124 after breaking lower.
Potential bounce to $140 if holds, targeting $155 resistance breakout; deeper risk to $110 on failure.
Watching RSI oversold for reversal, MACD crossover bearish, volume thinning. 📉⚠️
#SOL #AltcoinTrading #CryptoAnalysis

sol-usdt🔤🔤🔤
Solana and the correction mainly due to Bitcoin, reaching support at $140 🕯🕯
A relative divergence has formed in the RSI, which could cause at least a short-term price rebound 🚨💰

SOLANA Sell/Short Setup (2H)A bearish pattern has formed on the chart, and it appears that the first wave of wave E has been completed, which was symmetrical. In the second wave of E, we are looking to enter a Sell/Short position to capture the third bearish wave of wave E.
The stop loss, targets, and entry point have been marked on the chart.
Please note that this is a swing setup and will take some time to reach the target.
Add this setup to your watchlist | we’ll enter if it reaches the entry zone.
For risk management, please don't forget stop loss and capital management
When we reach the first target, save some profit and then change the stop to entry
Comment if you have any questions
Thank You

Smart Money footprint in next Days On SolHello team
Sol move better than others to fill LONG FVGs
by the time sol losing dominance
But You should know " Every cycle in Crypto is temporiry pirod time "
In next few hours or days Solana Would reach 120 $ ( Smart money footprint zone )
and sudenly pump more than 5% in few hours
This is not My financial advice
DYOR
But this would be an opportity , One from Milions opportinities in financial market
I GOT STOCKED so Drop a comment bellow to help me show that I am not robot to TrafingView 😁
#TradeWithMky Trade smart

My Dear Solana Given the breakdown of the ascending trend line on the daily time frame and the change in trend structure from ascending to descending, we expect to enter a sell trade when the price returns below the trend line level and reaches the FVG area upon hitting the order block.

$SOL Channel Test – Bulls Defend or Bears Dominate?BINANCE:SOLUSDT CRYPTOCAP:SOL Channel Test – Bulls Defend or Bears Dominate?
Current trend: SOL's hugging the descending channel lower boundary, dipping to 143.5 support after rejection from 182 highs—classic pressure cooker with thinning red volume signaling possible relief 🛡️.
Hold support? Strong potential yes; hammer candles and prior confluence zone could draw buyers for a squeeze play.
Breakout above resistance? On horizon if 182 flips—igniting 7-10% rally to channel top 🚀.
Dip risk? Moderate to 140 on break, but oversold prevents panic flush.
Target: Upside 160 short-term; downside 138 buffer.
Indicators tracking: RSI (30, oversold bounce), Channel slope, and OBV divergence 📊.
#SOLTrading #CryptoChannel #AltcoinPioneers
#SOLANA is TRADING ON A 1785 DAYS LONG WEEKLY SUPPORT!SOLANA is trading on a 5-year-long weekly trendline support. What happens next will be worth watching.
Best lower entry zone: $125 to $135.
DYOR, NFA

SOLUSDT – Bearish Flag Breakdown in Progress
SOLUSDT on the daily timeframe appears to be confirming a bearish flag breakdown, indicating that the recent consolidation phase may have served as a continuation pattern within a broader downtrend. The price rejected resistance around the flag’s upper boundary and is now extending lower, suggesting renewed seller strength.
The RSI remains below the midline, reflecting persistent bearish momentum without signs of reversal yet. Immediate supports lie around 145.7 and 136.5, where price may look for a temporary pause or reaction.
Should the pair close below this zone with volume, the flag pole projection scenario could play out, opening room for a deeper retracement. Conversely, any sustained move back above 158–161 would negate the bearish continuation outlook and indicate a possible structural recovery.

#SOLANA Bear Market Hello everyone, I hope you're all doing well.
This is my prediction for the price of Solana in the coming weeks and months. I previously shared this idea when the price was $16, and I predicted it would rise to the top. Take a look below
This is not investment advice; please take full responsibility for your buying and selling decisions.
Warning: Be careful not to use this idea with leverage, as you could lose all your money

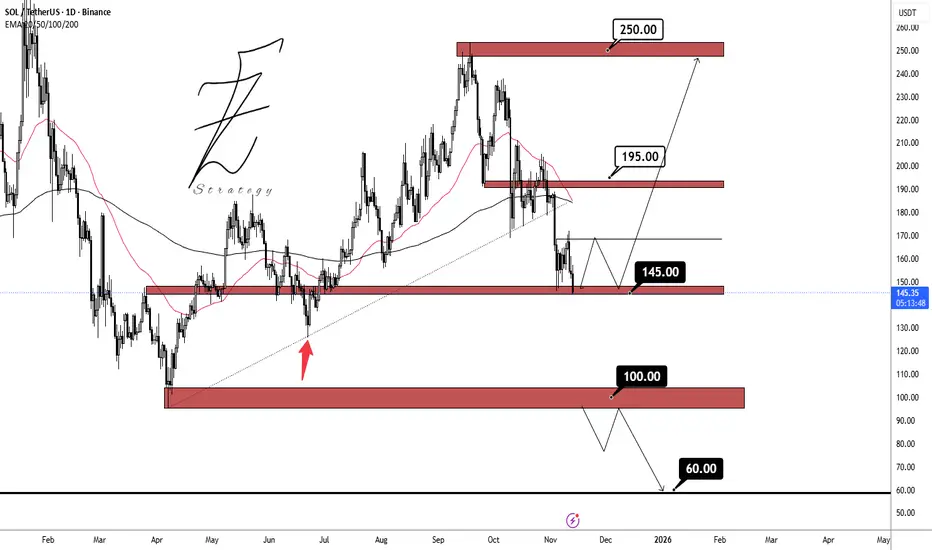
SOLUSDTLast week, the price BINANCE:SOLUSDT showed a positive reaction around the 145.00 dollar support zone, and with weakening bearish momentum, the likelihood of holding above this level has increased. If this support remains intact, the next target will be the 195.00 dollar resistance area.
Support zones: 145.00 dollar, 100.00 dollar, 60.00 dollar
Resistance zones: 195.00 dollar, 250.00 dollar
SOL/USDT: Compression Builds Above $150 as Bulls Eye BreakoutSOL/USDT is testing the lower boundary of structure after repeated failures to break the descending trendline. Price is compressing just above the $150 psychological support, suggesting possible accumulation at this level.
A break above $160 and the trendline could trigger a recovery toward $175 resistance. Momentum favors a bullish bias as long as $150 holds.
❗️ Risks:
– Rejection at $160 may lead to a retest of $147.
– BTC weakness could stall upside.
– Stronger USD or risk-off flows may delay breakout.

SOLUSDT | 30m Bullish SetupAfter the sell-side sweep and SMT divergence, SOL respected the bullish order block (OB) and started structure shift.
Alligator lines have opened upward, showing momentum alignment for a possible continuation.
Setup Details:
🟩 Entry: 155.5 – 156.0
🔻 Stop Loss: below 150.5 (beneath OB)
🎯 Targets:
TP1 → 160.5
TP2 → 164.0
TP3 → 170.0
Looking for continuation higher as long as we hold above the OB.
Bill Williams’ Alligator + SMT confluence = strong bullish bias.
#SOL #SOLUSDT #Crypto #TradingView #ICT #SMC #BillWilliams #PriceAction #SmartMoney

Lingrid | SOLUSDT Buying Opportunity at Psychological LevelThe price perfectly fulfilled my previous idea . BINANCE:SOLUSDT CRYPTOCAP:SOL is testing the lower boundary of market structure after multiple failed attempts to break the descending trendline. Price action shows a clear compression phase above the psychological $150 support, indicating potential accumulation. A bullish breakout above $160 and trendline could open a short-term recovery toward the $175 resistance zone. Overall, momentum hints at a buy bias from a key psychological and structural level.
⚠️ Risks:
Rejection from $160 may lead to a retest of $147 support.
Bitcoin weakness could suppress recovery momentum.
Stronger USD or risk-off sentiment may delay a breakout.
If this idea resonates with you or you have your own opinion, traders, hit the comments. I’m excited to read your thoughts!

SOL-USDTMy view on Solana is still the same: as long as it keeps its support at $150, it can continue to rise towards the static resistance at $165 🔼🔼💲💲

Solana 4H 13/11For Solana on the 4-hour timeframe, I see a bullish flag pattern, and hopefully, it will play out soon. My target is the all-time high. Seeing how ETH and BNB have already reached their all-time highs, I believe Solana will follow next.
