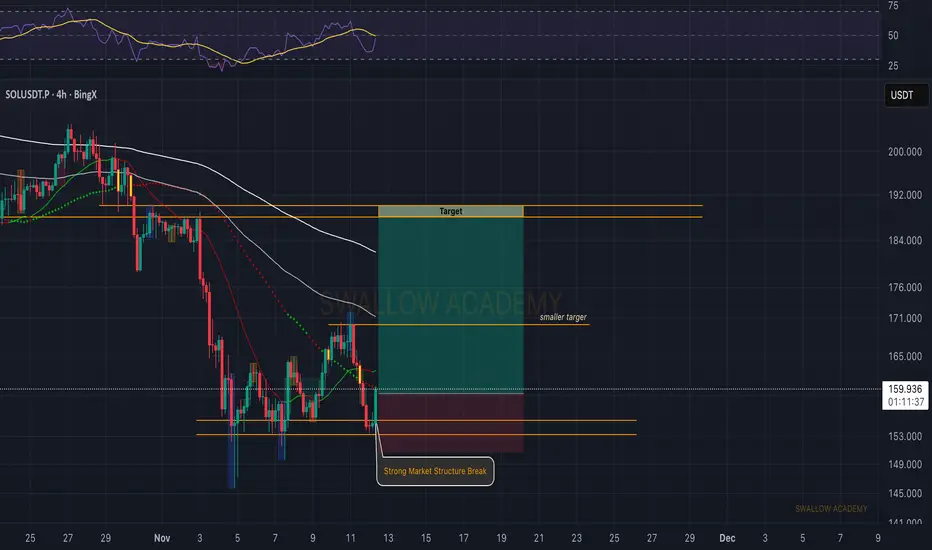
Solana (SOL): Formed Market Structure Break | Bullish TradeSOL showed a strong market structure break near the support area, hinting that buyers might be stepping back in. As long as this zone holds, we could be looking for a short-term bullish movement.
First smaller target sits around the previous minor resistance, while the main target would be the higher zone shown on the chart. Waiting for confirmation from buyers before entering remains key here.
Swallow Academy
Trade ideas
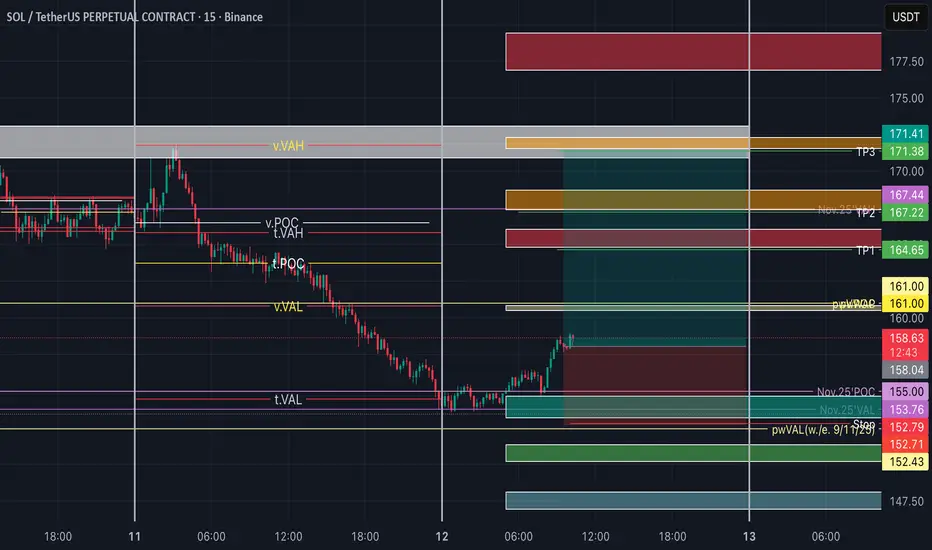
SOL Long position (12/11/25)Take Profit 1 = $164.6
(*Nov11.tVAH + Nov11.vPOC + Nov10.VAL + Fibonacci confluence)
Take Profit 2 = $167.2
(*monthly.VAH + Nov10.POC + Fibonacci confluence)
Close Long (tp3) = $171.4
(*Single Prints from Nov3 + Nov11.tVAH + Fibonacci confluence)
Stop = $152.8 (*monthly.VAL + Nov11.tVAL + Fibonacci confluence)
SOL bull?
The overall structure remains **bullish for now**.
Price is approaching the **golden ratio Fibonacci level**, which aligns with **liquidity clusters** seen both on **Hyblock open interest** and **liquidation heatmaps**.
This zone is expected to act as a **key resistance**, as such levels are **rarely broken on the first attempt** — often leading to a **short-term pullback or consolidation**.
If the price manages to **hold above this area**, continuation of the upward move becomes likely; for now, it’s best to **observe the market reaction** around this critical zone.

SOLUSDT 30min | Bullish 🔵 Alligator Positioning
Lips: 156.52 | Teeth: 156.15 | Jaws: 156.38
Price trading ABOVE all 3 lines → bullish alignment
Tight coil suggests imminent expansion
Market Structure
Sell-side Liquidity: Swept below 157.78
🎯 Optimal Trade Entry
Primary Long: 157.80-158.00 (current zone)
Secondary Long: 157.15-157.40 (OB retest)
Stop Loss: Below 156.10 (Alligator cluster break)
💰 Profit Targets
TP1: 160.00 (immediate resistance)
TP2: 162.50-165.00 (momentum zone)
TP3: 170.00-171.63 (liquidity target)
Bullish alignment intact - buying Alligator support for push toward liquidity above
#SOL #TradingView #ICT #Alligator #Bullish

SOL - Enough is Enough!📉After weeks of selling pressure , SOL is finally approaching a massive confluence zone around the $150 round number, which aligns perfectly with a strong weekly support area highlighted in blue.
⚔️This level has historically acted as a major pivot zone , and as long as SOL holds above it, I’ll be looking for short-term long opportunities, targeting the upper bound of the falling red channel.
🏹However, for the bulls to fully take control, SOL must break above the last major high marked in red, confirming a shift from correction to continuation.
Could this be the point where Solana says - Enough is enough? 👀
⚠️ Disclaimer: This is not financial advice. Always do your own research and manage risk properly.
📊All Strategies Are Good; If Managed Properly!
~Richard Nasr

#SOL/USDT Bullish trend analysis Read The caption#SOL
The price is moving within an ascending channel on the 1-hour timeframe and is adhering to it well. It is poised to break out strongly and retest the channel.
We have a downtrend line on the RSI indicator that is about to break and retest, which supports the upward move.
There is a key support zone in green at the 154 price, representing a strong support point.
We have a trend to stabilize above the 100-period moving average.
Entry price: 156
First target: 156.80
Second target: 158
Third target: 160
Don't forget a simple money management rule:
Place your stop-loss order below the green support zone.
Once the first target is reached, save some money and then change your stop-loss order to an entry order.
For any questions, please leave a comment.
Thank you.

SOL-USDTYesterday I mentioned the possibility of a correction down to $152, and well, it came down exactly to that support level and reacted well to it 🕯🕯
As long as it stays above this level, it can continue its upward path to $164 🔼💲

Solana Battle at 150!Hello, is everyone watching Solana (SOLUSDT) fight?
Currently, SOLUSDT is still under downward pressure after breaking the old support zone (new resistance) and the price continues to be rejected at the main trendline resistance.
The 150-160 zone is acting as an important reaction zone, a short technical recovery may appear before continuing to decrease when it cannot hold this zone.
On the other hand, the market shows signs of altcoin cash flow weakening slightly when BTC is regaining its capitalization advantage.
In addition, the liquidity of the crypto market at the beginning of the week has not clearly recovered, making SOL's recovery difficult to sustain.
In my personal opinion, when breaking through the current support zone, the possibility of going down to the 130-140 zone is quite high.
What do you think, is this zone worth observing for short-term shorts? Or should we wait for a clearer signal in the small frame?
Share your views in the comments below!

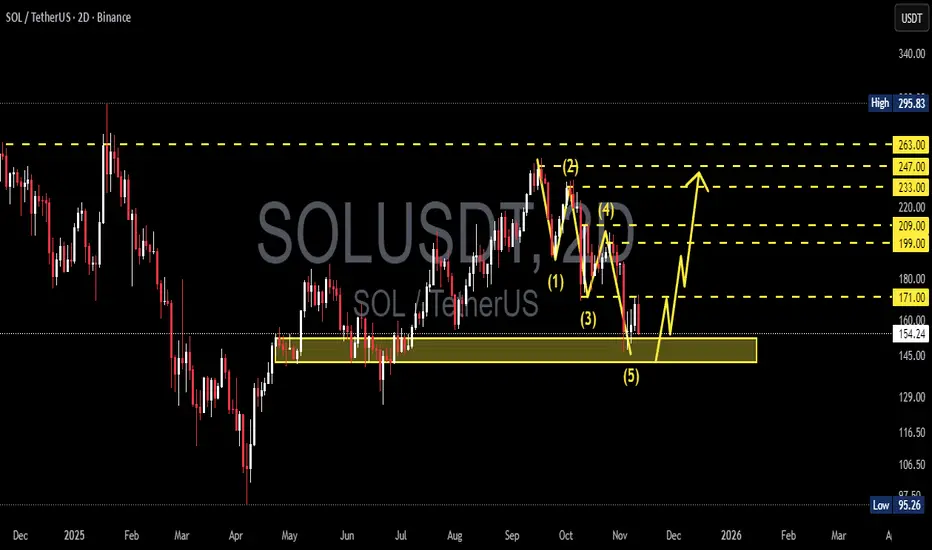
SOL/USDT — Will Solana Start a Major Reversal from Here?Solana (SOL/USDT) is now sitting at a critical turning point, as the market tests a major historical demand zone between 152–142 USDT. After completing a clear 5-wave impulsive decline, sellers appear to be losing momentum, while buyers are starting to react around this key area.
This yellow zone has previously acted as a strong demand base, triggering powerful rallies in the past. Now, it’s once again becoming the battlefield between bulls and bears — and the outcome could define Solana’s direction for the coming months.
---
Pattern & Structure
1. 5-Wave Decline (Elliott Wave Structure):
The chart shows a clean 5-wave downward pattern, often marking the end of a corrective phase. If valid, the next move could be an ABC corrective rally, signaling the start of a broader bullish reversal.
2. Critical Demand Zone (152–142):
This area serves as a strong institutional accumulation zone, where smart money often steps in. A confirmed rebound from here could ignite the next leg higher.
3. Layered Resistance Levels:
Key resistance levels are lined up at
171 → 199 → 209 → 233 → 247 → 263.
Each breakout acts as a step confirming a stronger bullish trend.
4. Fibonacci Confluence:
The 38–61% retracement levels align with 199–263, strengthening the case for this region as a natural recovery target zone in the next upward phase.
---
Bullish Scenario — “The Reversal Zone Awakens”
If price holds above 152 and forms a strong bullish reversal candle (engulfing / hammer on the 2D chart), we could see:
Target 1: 171 → first confirmation of trend reversal.
Target 2: 199–209 → mid-level recovery zone.
Target 3: 233–247 → full corrective phase.
Extended Target: 263 → upper resistance and profit-taking zone.
This scenario represents the potential end of a multi-month bearish phase and the beginning of a fresh bullish cycle.
A 2D close above 171 would strongly confirm the reversal structure.
Additional confirmation: bullish divergence on RSI, increasing buy volume, or formation of higher lows on the 2D timeframe.
---
Bearish Scenario — “Breaking the Floor”
If the price closes below 142, the current demand zone will flip into resistance, signaling continuation of the downtrend toward:
First target: around 116 (minor demand).
Main target: 95 (previous historical low).
A breakdown below 142 would suggest that wave (5) may not yet be complete, indicating one final capitulation wave before a potential long-term bottom forms.
---
Strategy & Outlook
Conservative traders: Wait for a confirmed 2D close above 171 before entering any bullish setups.
Aggressive traders: Consider gradual accumulation near 152–142 with tight SL below 142.
Risk management: Maintain a minimum R:R of 1:2, and avoid averaging down blindly without confirmation.
Multi-timeframe confirmation: Watch daily and 3D candles for stronger conviction signals.
---
Market Psychology
This current phase represents a “capitulation zone” — where retail confidence fades while smart money starts positioning quietly.
Historically, major trend reversals are born from such exhaustion zones. If SOL can defend this support area, it could be the beginning of a powerful new uptrend toward 200+ and beyond.
---
Conclusion
Zone 152–142 = critical buyer defense line.
Reaction in this zone will determine the next macro trend for Q4 2025 – Q1 2026.
Breakdown → downside target 95.
Reversal → upside potential up to 263.
---
#Solana #SOLUSDT #CryptoAnalysis #TechnicalAnalysis #SupportResistance #ElliottWave #CryptoReversal #SwingTrade #PriceAction #AltcoinSeason #SolanaAnalysis
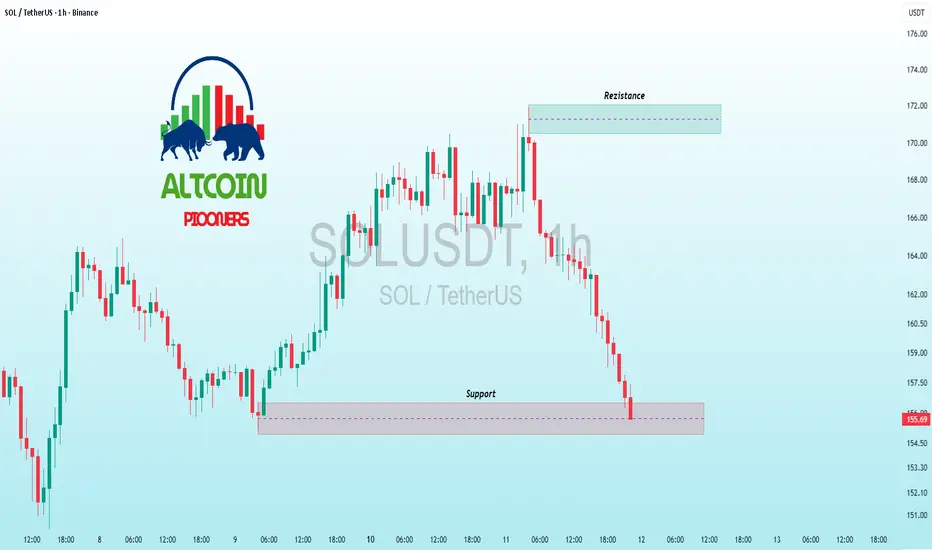
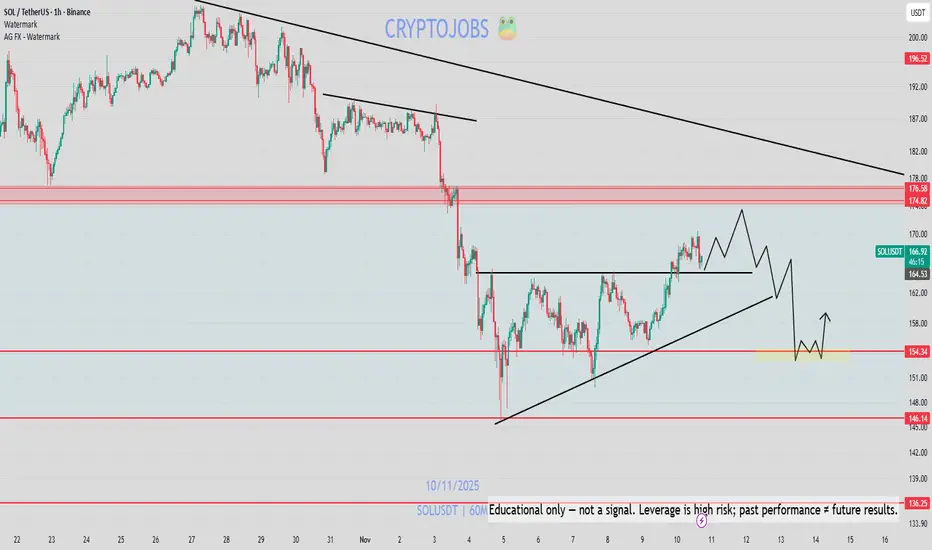
SOLUSDT – When Buyers Start to Lose MomentumAfter an exciting short-term rally, Solana is beginning to show signs of losing steam , as buying pressure weakens around the $167–$170 zone — an area aligning with the long-term descending trendline .
The technical picture is tilting slightly in favor of the bears: price has been repeatedly rejected near $170, forming a pattern of lower highs, while trading volume continues to decline. This indicates that buyers no longer have enough strength to break through the current downtrend structure.
If this scenario persists, Solana could pull back toward the $153 support zone, where buying activity previously emerged. Holding above this level will be crucial in determining whether the market can consolidate again or extend its decline further.
Overall, the short-term bearish trend remains dominant. Unless a strong catalyst or fresh liquidity enters the market, Solana may continue to drift lower within the current descending channel — a necessary “step back” before the next potential bullish phase begins.

Solana is approaching a key support around $150.If this level breaks, the next strong buy zone is $120–100, where the lower channel boundary and main liquidity sit.
The market still looks weak no point catching a falling knife.
No need to buy after a -6% drop.
If we see a clear reaction from $150 fine, there’s a setup.
But the best accumulation zone is still lower, closer to $100.
📉 Base scenario: break $150 → test $120 → possibly $100.
📈 Bullish case: bounce from $150 → reclaim $170 → back inside the channel.
Stay calm. The market rewards patience, not emotions.

$SOL Rebound from Support, Breakout Potential?BINANCE:SOLUSDT CRYPTOCAP:SOL Rebound from Support, Breakout Potential? 📊🌊
SOL's 1H trend turns bullish, snapping back from core support at ~155 with increasing volume—buyers defending hard!
High odds of holding, pushing for breakout above 170 resistance toward 185 target.
Deeper dip unlikely (watch 150), but secure stops.
Monitoring RSI at ~53 (rising), 50 EMA bounce, and MACD flip positive.
Solana surge incoming! 🚀
#SOL #CryptoTrading #AltcoinBull
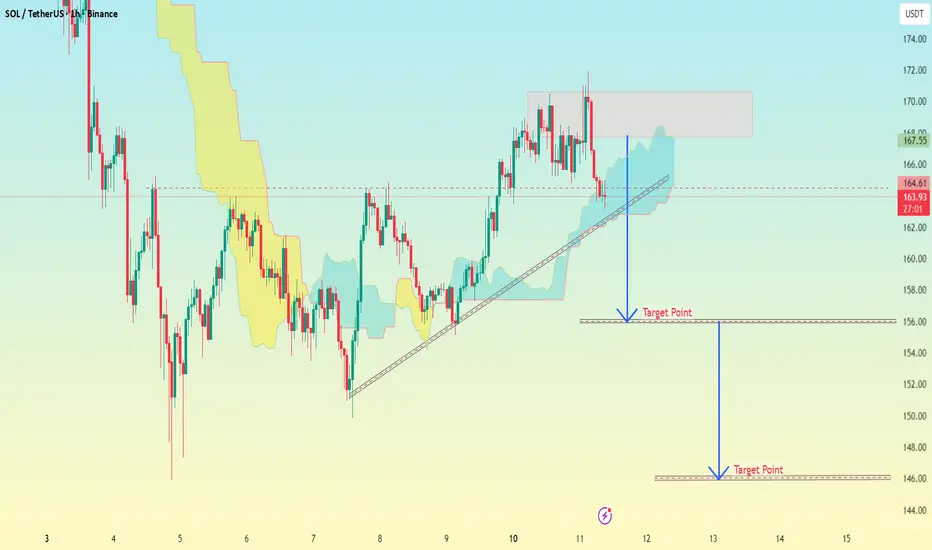
(SOL/USDT 1H timeframe...(SOL/USDT 1H timeframe on Binance):
Here’s what I can interpret from the structure shown:
Current Price: Around $164
Support Trendline: Rising from around $158 → $164 (now price has slightly broken or retested this line)
Resistance Zone: Highlighted in red box near $169–$172
Two Target Points are drawn on the chart:
🎯 Target 1:
The first blue arrow (labeled Target Point) points to around $156.
→ This is likely the first downside target after trendline break.
🎯 Target 2:
The second blue arrow (lower one) points to around $146–$147.
→ This is my extended or final bearish target if the price continues falling.
---
🔍 Summary:
Level Type Target Zone
Target 1 Short-term $156
Target 2 Major target $146–$147
---
⚠ Tip:
If SOL closes below $162 on 1H or 4H candle → high chance to move toward $156.
If it loses $156 support, then $146 becomes realistic.
But if SOL reclaims and closes above $168–$170, the bearish setup fails and bullish continuation toward $174+ can begin.
#SOL/USDT is going to breakout from descending channel 18% gain#SOL
The price is moving within an ascending channel on the 1-hour timeframe and is adhering to it well. It is poised to break out strongly and retest the channel.
We have a downtrend line on the RSI indicator that is about to break and retest, which supports the upward move.
There is a key support zone in green at the 162 price, representing a strong support point.
We have a trend to stabilize above the 100-period moving average.
Entry price: 164
First target: 166
Second target: 168
Third target: 171
Don't forget a simple money management rule:
Place your stop-loss order below the green support zone.
Once the first target is reached, save some money and then change your stop-loss order to an entry order.
For any questions, please leave a comment.
Thank you.

SOL-USDTAfter the upward movement, a correction is taking place, and if it can maintain the support level set at 164, this move can be considered a pullback to the trend line, and the upward movement toward the upper trend line could continue 📊🔴Otherwise, the correction could continue down to 153 dollars 🔼📌

Bitcoin: Is the bottom in? Bonus: ETH and SOLThis video will prepare you for the unexpected.
Bitcoin is somewhat forming what would look like a bottom, but the bigger timeframe forms a somewhat scary picture. So, I decided to describe the market condition to make sure you are prepared for various scenarios.
Bonus: Outlook on ETH and SOL

$SOL Bull Run Testing Resistance?BINANCE:SOLUSDT CRYPTOCAP:SOL Bull Run Testing Resistance?
SOL's 1H chart roaring bullish, surging to 166.87 highs and eyeing resistance at 170—breakout could target 175 quick, but pullback to support 155 risks if momentum stalls.
Strong uptrend vibes!
Key indicators: RSI overbought at 70 (watch divergence), 50MA rising, volume spiking. 🌊🚀
#SOL #Solana #AltcoinPioneers

SOL - UPDATE: CRYPTOCAP:SOL - update: 🟥
Remember, I posted this view few days ago.
Prices retested exactly the previous breakout (key support) around 170 - 175$.
If this level act as resistance, we could see another dump & lower low! 📉
Prices could move sideway for a while, but:
My initial outlook called for the 130$ level as bottom.
Judging by my weekly & daily view, For now this setup is valid under key resistances.
Daily = Bearish
Weekly = Neutral
At the opposite:
155$ must hold on daily basis to expect a downtrend reversal & breakout📈.
A downtrend breakout would surely lead to a push toward 180$ or even 200$+ 🟩
More infos & data in my charts! #dyor - H1 possible setup
SOLUSDT Breaks Out and Aims for $200!BINANCE:SOLUSDT is trading above the 50 EMA on the 4H chart. a strong sign for short-term momentum. If you look closely, it has also broken out of an ascending triangle pattern and is moving upward with solid volume.
We’re expecting a potential upmove from here, with a short-term target around $200.
Always remember to set your stop loss and manage your risk wisely.
BINANCE:SOLUSDT Currently trading at $167
Buy level : Above $165
Stop loss : Below $154
Target 1: 175
Target 2: 200
Max leverage 3x
Always keep stop loss
Follow Our Tradingview Account for More Technical Analysis Updates, | Like, Share and Comment Your thoughts

SOLANA/USDT 1W CHARTSometimes, charts of major altcoins like Solana can offer clearer signals when Bitcoin and Ethereum charts look indecisive.
In this case, Solana’s price has been supported by a long-term trendline dating back to 2021. The price is now testing that same trendline, making it an important level to watch, its reaction here could provide early insight into the market’s next move.

SOLI don’t think CRYPTOCAP:SOL will go any lower from here. The chart shows a major multi year support level, and price has reacted strongly every time it reached this zone. I’m expecting a breakout within 180 days with a target of $420 as momentum begins to build again.

#SOL/USDT — Critical Retest at Demand Zone vs Long-Term Downtr#SOL
The price is moving within an ascending channel on the 1-hour timeframe and is adhering to it well. It is poised to break out strongly and retest the channel.
We have a downtrend line on the RSI indicator that is about to break and retest, which supports the upward move.
There is a key support zone in green at the 158 price, representing a strong support point.
We have a trend to stabilize above the 100-period moving average.
Entry price: 159
First target: 161
Second target: 164
Third target: 168
Don't forget a simple money management tip:
Place your stop-loss order below the green support zone.
Once you reach the first target, save some money and then change your stop-loss order to an entry order.
For any questions, please leave a comment.
Thank you.

sol-usdtThe two-hour timeframe is breaking its own trendline, and if the price can stabilize above $170, the path for continuing the rise towards $180, which is the second trendline, will be clear 💎💰Currently, Solana's support is at $160 ✔️🚀
