SOL Rejection at Resistance – Breakdown Toward 70?SOL Rejection at Resistance – Breakdown Toward 70?
SOL is showing clear weakness after failing to reclaim the mid-range resistance around 83–84.
Price rejected the horizontal resistance and continues to respect the descending trendline from the recent highs, confirming short-term bearish structure.
Despite the recent bounce, the move looks corrective rather than impulsive.
If price rejects again in the 82–83 area, the downside targets become:
78.45
75.47
70.02
The overall structure favors continuation lower unless SOL reclaims and holds above 84 with strong momentum.
The chart suggests a possible short-term push higher into resistance, followed by a sell-off toward the marked targets.
You may find more details in the chart.
Thank you and good luck! 🍀
❤️ If this analysis helps your trading day, please support it with a like or comment ❤️
What traders are saying

SOLUSDT(solana)We can be hopeful that after breaking out of the wedge, we will see significant price growth.AB=CD
Best regards CobraVanguard.💚

SOL potential breakdown !SOL / USDT
Solana is breaking down Major Trendline support and also forming a H&S bearish pattern
Possible targets : 59$ and 32$
Currently Bears are in control
Keep an eye on it

$SOL: Hold $70–$60 → Bullish Structure IntactCRYPTOCAP:SOL this is a level you don’t ignore.
On the weekly timeframe, SOL is pulling back into a major long-term rising trendline that has held since 2023.
Price has already broken below short-term structure and is now approaching a key higher timeframe support zone.
If this trendline holds, this could become the best accumulation area, roughly in the $70–$60 zone.
That area aligns with:
Long-term ascending support
Previous consolidation range
Historical demand
If we lose that trendline with strong weekly closes below it, the structure weakens significantly.
But as long as it holds, this looks like a higher timeframe pullback within a broader bullish structure.
For me:
Hold $70–$60 → accumulation zone
Lose it → reassess bias
Big levels create big opportunities.
DYOR, NFA

SOLUSDT: Get Ready For 300 Mark, This Time Reversal BigSOLUSDT has the potential to reach the 300 price range once it falls to our buying zone, defined by two horizontal white lines. Upon reaching this area we can target the 300 price level. Please exercise accurate risk management when trading cryptocurrencies.
For further analysis please like and comment.
Team Setupsfx_

Solusdt relief rally before major dropSOL has already fulfilled its mid-term bearish projection, with the bearish pennant target achieved. The current expectation is a relief rally toward the mid-term supply zone around $145, followed by a continuation lower toward the projected downside target.


Solana doesn't look goodBINANCE:SOLUSDT
Solana is a weird one. The memes are developing interesting structures. It has broken the previous support so now the $103 level is a resistance. From the looks of it, probably on it's way dying to $30-$45. Also, a time pivot on the 27th of April to keep an eye.

Solana $250m of Open itnerest entered - time for some moveSolana $250m of Open itnerest entered - time for some move
Open interest increased by $250m (16%)
What would be the next? Share your thoughts

Solana 5X Long with 890% profits potentialAs you can see here, I am only using very conservative targets but it is possible that Solana already completed its full bearish cycle. This is irrelevant to us right now because we are measuring only a mid-size move.
For the purpose of this trade, we focus only on the next 30-60 days. 60 days being a very long time.
This is a nice chart setup. "Buy when the market is red."
Notice the counterintuitive nature of this process, of these signals, of these trades. Notice how we are going in, with confidence and force, when everybody is running away.
Notice how we abhor buying when prices are high, yet we love entering, looking for opportunities when prices are low in order to go long.
Notice the size of the position and timing. Notice how many times we get it wrong.
Then, focus on the results... Just watch!
Wait and watch. Take action and watch. Buy and hold.
Take action and enjoy... It is already confirmed. The bottom has been settled, it is hard because it is right. Easy has never done anything when it comes to trading long with success.
When you feel 100% certain, the market goes the other way. When things look bad, when everything is at its worst, that's when the market turns. From the bottom we grow.
Full 5X trade-numbers for Solana are made available below—for your entertainment of course:
_____
LONG SOLUSDT
Leverage: 5X
Potential: 890%
Allocation: 5%
Entry zone: $66- $80
Targets:
1) $95
2) $111
3) $138
4) $160
5) $182
6) $214
Stop: Close weekly below $65
_____
Thank you for reading.
Namaste.

SOL/USDT Long— Strong oversold conditions, prolonged downtrend, early signs of convergence on the weekly, strong fundamentals
— Entry: $81.65 — market buy order
— Stop: $76.6
— Target: $118
Risk per trade: 0.2% of total deposit
Position size: 4% of total deposit
RR 1:8.5

SOL Long Thesis, Defined Risk From Demand to SupplyThe Core Thesis
This is not a breakout gamble.
This is a structured long from demand, with downside capped, and upside mapped into clear resistance liquidity.
If buyers defend this zone, the reward is asymmetric.
If they don’t, the trade is invalidated quickly.
That is how professionals manage uncertainty.
Entry Area, Buyers Are Positioned Here
My entry is focused around the moderate limit buy zone.
This is where demand is showing up, and where the market has a reason to stabilize.
Instead of chasing price higher, the idea is to participate where risk can be controlled.
This is the zone where buyers have the best positioning
Stop Loss, Clear Invalidation Below
The stop is placed below the demand structure.
If price breaks through this area, the long thesis is invalid.
That is the point of the stop.
Not emotional, not wide, just a clean level where the setup no longer makes sense.
Risk is defined first.
Disclaimer
This is not financial advice.
This is a technical trade idea shared for educational purposes only.
Always manage risk, use proper position sizing, and make your own decisions.

Solana price bearish continuation lower? Solana price action has seen an impulsive sell-off into the weekly support region around $70, marking a key area of higher-timeframe demand. This level has so far held, with price responding through a bullish buyback on the hourly timeframe. The short-term structure shows a degree of upside continuation, indicating that buyers are active at this support zone.
Despite the bounce, the broader technical outlook remains cautious. From a macro perspective, Solana is still trading within a larger bearish structure. Price is currently finding acceptance below the $95 level, which stands out as a significant technical resistance on the higher timeframes. This resistance zone has previously acted as supply and continues to limit bullish continuation.
As price pushes higher from the $70 support, the current rally is best viewed as a corrective move within a broader downtrend. The inability to reclaim and hold above $95 increases the probability that this move will form a lower high in the overall market structure.
From a technical perspective, price action perspective, and market structure perspective, Solana may continue to bounce from current levels. However, unless a decisive break and acceptance above $95 occurs, the greater bearish trend remains intact. This creates a high likelihood of distribution between the $70 support and $95 resistance before the next directional move develops.

Solana (SOL): Important Support Zone Has Been Reached, Let's TrySOL is sitting right at the major support zone, which combined with 2 bullish CME gaps, the oversold RSI and the fact that EMAs are way too far from the market price might mean that we are in a really good position for a short-term recovery here.
Now the main thing for us here is the support zone. If this breaks, we most likely dip to $81, but as long as price stays around the $100 area we are looking for recovery.
Swallow Academy

Solana —Can there be a strong relief rally? 2022 vs 2026 The 2022 bearish cycle is different to 2026-25. The previous bull market ended with a top in November 2021. The most recent bull market ended with a double-top in January-September 2025.
After a major down-wave lasting 112 days, SOLUSDT produced a strong relief rally (+90%) sometime around February-March 2022.
A major down-wave in the current cycle has been on for 140 days. A long-term support zone, the 0.786 Fib. retracement level has been activated. A relief rally can show up somewhere around February-March 2026 similar to February-March 2022, based on the current chart structure.
Back in 2018 Solana hit bottom at a price of $1. In 2022, the bottom happened at a price of $8, eight times higher. In 2026, we have a major support being activated at a price of $67.5, roughly eight times higher compared to the previous low.
This chart supports bullish action. It is even possible that Solana's bear market already reached its end.
Namaste.

Solana price internal rotation from key support zone Solana price action is currently bouncing from daily support near the $71 level, an area that aligns closely with the value area low, adding technical significance to the zone. This region has acted as a short-term demand area, allowing price to stabilize after recent downside pressure. However, the rebound so far has lacked strong bullish influxes, suggesting that buyer conviction remains limited.
From a Fibonacci perspective, the lower 0.618 retracement has not yet been tested. In many corrective structures, price often sweeps nearby liquidity before establishing a sustainable bottom. This means Solana could briefly rotate lower to test the 0.618 Fibonacci level, potentially taking out early long positions, before attempting a more meaningful reversal.
Such a move would be consistent with a bottoming process rather than immediate continuation. If price finds acceptance and strong demand at the Fibonacci support, it would increase the probability of a rotational move higher. In that scenario, the next key upside target would be the higher-timeframe resistance near $87.50.
From a technical and price action perspective, Solana is currently trading in a key reversal zone. A successful bottoming structure, supported by improving volume, would be required to confirm a shift in momentum and open the door for upside continuation. Until then, traders should remain cautious and monitor liquidity behavior closely.

Solana price fiboancci extension target $57Solana price action remains corrective, with structure still favoring downside continuation in the near term. After losing the key $170 support, which has now flipped into resistance, SOL experienced a sharp bearish expansion toward the high-timeframe support region around $157. While price printed a short-term low above this level, the absence of a clean retest suggests unfinished business remains below current price.
Recent bounce attempts have occurred on declining bullish volume, indicating weak demand and a lack of conviction from buyers. This type of price behavior typically aligns with corrective rallies rather than sustainable reversals. As long as SOL remains capped below former support-turned-resistance, downside risk stays elevated.
From a Fibonacci perspective, the 0.618 extension near $57 comes into focus as a high-probability downside target. This level represents a major macro inflection zone with strong technical confluence and structural liquidity. If price rotates lower to test this region, it could coincide with capitulation-style price action.
A meaningful reversal would require a strong reaction at support, characterized by expanding volume and clear bullish rejection. Until then, short-term rallies should be treated cautiously, with overall bias remaining bearish and favoring further downside exploration before any sustained recovery attempt.

Solana dropped 27 from area where $250m worth of Open interedI hope u remember this idea
perfect drop from vwap + OI

SOL/USDT — Oversold Deviation: Reversal Potential With Key Risk Price has swept support formed by a horizontal level and the lower boundary of the channel (which could still act as a global bullish flag).
Weekly RSI is approaching levels last seen at the 2022 bear-market bottom, during the Alameda/FTX panic.
From a technical standpoint, conditions for a reversal are strong — except for the absence of a clear candle reversal setup.
On the downside (beyond current portfolio drawdown):
• a sustained hold below $76 opens a liquidity void. Historically, price moves through this area quickly with little reaction.
There are only two zones where the move could slow or pause — if that scenario plays out, SOL would need to be reassessed there.
🎯 Primary bounce target: $116
🎯 Intermediate target: $95

SOL/USDT Bounce Is a Trap — Bear Trend Is Still Active?CRYPTOCAP:SOL is doing exactly what bear market rallies are supposed to do 🐻📉
After a sharp sell-off, price is bouncing from demand — but don’t confuse this with strength. This move looks like a relief pullback, not a trend reversal.
Structure is still bearish and the market is below key levels. This bounce feels more like price going back to test sellers, not buyers stepping in with conviction 👀
As long as SOL stays capped below major resistance, downside pressure remains very real.
If price pushes higher, the most logical path is a retest of the major resistance zone, where sellers are likely waiting. From there, continuation to the downside toward the accumulation area makes the most sense 🧊
That zone is where long-term money will be interested — not here.
Only a strong reclaim and acceptance above major resistance would invalidate this bearish outlook. Until then, rallies are just temporary pauses in a downtrend.

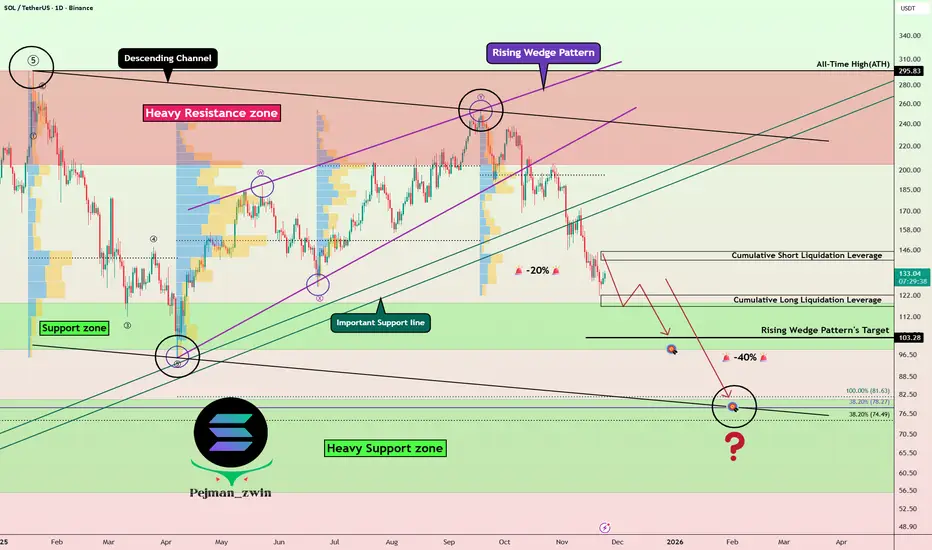
Solana Breakdown Roadmap—Is the Correction Just Getting Started?Today, I analyze the Solana( BINANCE:SOLUSDT ) project and explore its roadmap for the coming days and weeks, so stay tuned!
Solana, with the help of the Rising Wedge Pattern, has successfully broken through its important support lines and is currently moving near the Support zone($118-$98).
From an Elliott Wave perspective, it seems that Solana has completed its five main waves and is now in a corrective phase.
Given the current cryptocurrency market conditions, I expect Solana to break through the Support zone($118-$98) and at least reach the target of the rising wedge pattern, potentially dropping down to $80.
Additionally, it’s worth noting that the SOLBTC( BINANCE:SOLBTC ) pair is also showing a bearish trend, which means that if the broader crypto market declines, Solana could face even greater losses.
First Target: $107
Second Target: $83
Stop Los(SL): $174
Cumulative Long Liquidation Leverage: $122-$119
Cumulative Short Liquidation Leverage: $150-$145
💡 Please respect each other's opinions and express agreement or disagreement politely.
📌Solana Analyze (SOLUSDT), Daily time frame.
🛑 Always set a Stop Loss(SL) for every position you open.
✅ This is just my idea; I’d love to see your thoughts too!
🔥 If you find it helpful, please BOOST this post and share it with your friends.
SOL can hit upper targets 13% gain toward 100$HI
after huge correction to the downside now some green candlesticks for continuing the process or reverse is logical i can see at least 13% gain toward 100$ for SOL

SOL/USDT Monthly Technical AnalysisBINANCE:SOLUSDT 1. Timeframe Context
Monthly chart = macro trend & cycle view
Best for identifying long-term structure and major levels
Current move must be judged in years, not weeks
2. Market Structure
Strong bull run from $1 → $260+ (2020–2021)
Full bear market in 2022
Base formation in 2023–2024
Higher highs formed in 2024–2025
Recent price action shows a lower high, indicating a macro pullback, not a reversal
Structure remains bullish unless key supports fail.
3. Trend Status
Long-term: Bullish
Medium-term: Corrective
Short-term (monthly): Bearish momentum
This is a healthy correction after expansion.
4. Key Levels
Resistance:
$220–260 (major supply & previous cycle high)
Support:
$90–100 (current test)
$65–70 (strong monthly demand)
$40–45 (last-resort macro support)
5. Candle & Volume Insight
Recent monthly candles closed strongly bearish
No major lower wick yet → buyers not fully active
Volume is controlled, not panic-driven
Suggests absorption, not capitulation.
6. Log Scale View
Pullback is normal in percentage terms
Trend remains valid unless $40 breaks
7. High-Probability Scenarios
Base above $70–90, then continuation higher
Sweep into $65–70, strong bounce and accumulation
Bear case only if $40 fails (low probability)
Final Bias
Macro: Bullish
Now: Correction phase
Best approach: wait for monthly demand confirmation,
after all this, what is my feeling about BINANCE:SOLUSDT is coming to 40/50 range in coming weeks.
Best of Luck
TRADING BITE
