Are We All Victims Of Hidden Crypto Mind Control??!??Have you ever wondered why you sell exactly when the market turns around?
How is it possible that we all fall into the same trap repeatedly?
Maybe it’s time to accept that this isn’t just luck it’s a carefully designed game.
Hello✌️
Spend 2 minutes ⏰ reading this educational material.
🎯 Analytical Insight on Solana:
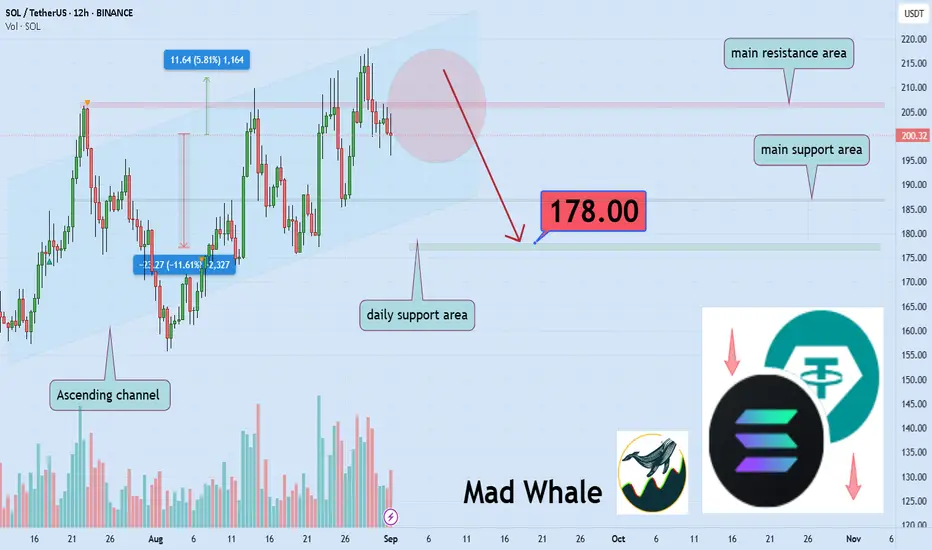
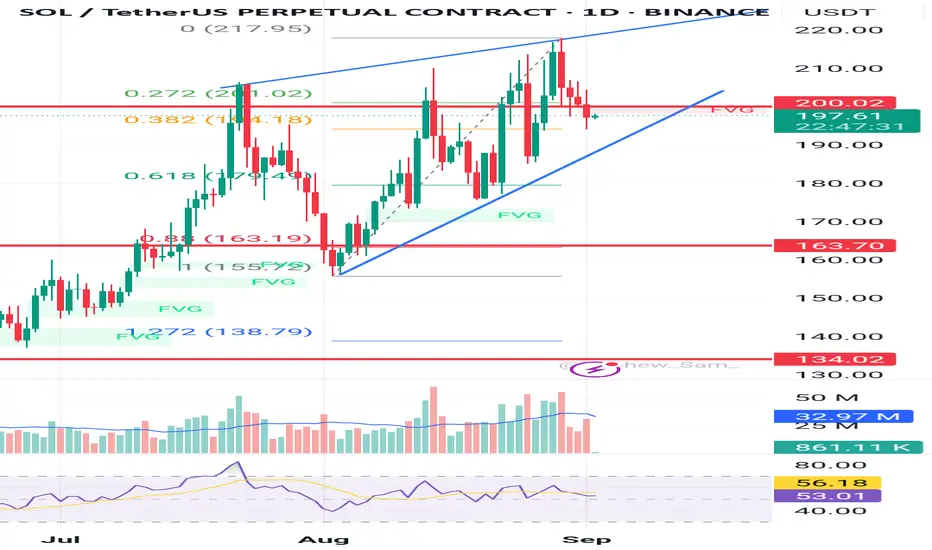
BINANCE:SOLUSDT is moving within a Ascending channel 📉 and is approaching a key resistance level. If the main support I have marked on the chart breaks, the price could drop around 11%, targeting $178, a major daily support. In this case, Solana would lose its current channel structure ⚠️.
Now , let's dive into the educationa l section,
🧠🐋 Psychology of Deception and Role of Whales
Market makers target the collective psychology of traders guiding market moves so most react emotionally.
They know exactly how fear and greed work and even a small move can trap millions of traders.
Whales can shift market direction with heavy trades that appear natural tricking beginners into following.
These moves often cause selling at the bottom and buying at the top the exact outcome market makers want.
FOMO and fear of loss FUD fuel this game expertly controlled by market makers.
Even professional traders can fall victim because human brains react predictably.
Recognizing real versus artificial pressure and understanding whale behavior is key to avoiding heavy losses.
Using analytical tools you can identify artificial whale movements and collective psychological manipulation.
📉📊 Losing Cycles and Market Manipulation
Most traders sell at the bottom and buy at the top because the human brain is wired for survival not trading.
Market makers exploit these instinctive reactions to control collective behavior.
Artificial ups and downs create precisely designed cycles that guide the emotions of millions of traders.
These cycles often align with news to push the market toward panic selling or FOMO buying.
Even experienced traders frequently fall into these cycles because human reactions are predictable.
Fear of loss and greed for quick profits fuel this cycle perfectly orchestrated by market makers.
Every pump and dump occurs when the largest number of traders are in vulnerable positions.
Understanding these cycles and spotting artificial moves is the only way to escape systematic losses.
📰⚡️🔄🚪 News Liquidity Traps Repeating Patterns and Escape
Every news item true or false is used by market makers to gauge reactions and steer prices.
Major liquidations are not random they happen when the maximum number of traders are exposed.
These pump and dump cycles repeat endlessly and even professionals often fall victim.
Human brains react predictably which market makers exploit to control collective behavior.
Fake positive or negative news triggers fear and greed pushing traders into emotional decisions.
Liquidity traps are coordinated with news and collective sentiment for maximum effect.
The only escape is a deep understanding of market psychology and analytical tools.
With smart use of TradingView you can see the real market map and make logical choices.
🛠 TradingView Tools Weapons Against Psychological Manipulation
1. Volume Profile Liquidity Zones
This tool shows which price levels have the highest trading volume where market makers usually set their traps.
By identifying these zones you can make logical decisions before emotional reactions take over.
2. Liquidity Heatmap Hidden Orders
This map displays hidden buy and sell orders and shows why price often stops or reverses at certain levels.
It helps distinguish artificial moves from natural market behavior.
3. RSI Relative Strength Index
RSI indicates overbought or oversold conditions and divergences can reveal price manipulation.
Analyzing RSI across multiple timeframes helps separate real market pressure from artificial pressure.
4. Fibonacci Retracement Retracement Levels
Fibonacci levels predict potential reversal points often used by market makers to guide collective behavior.
Observing these levels helps detect traps and avoid unnecessary losses.
5. Alerts Smart Notifications
Alerts notify you when price reaches predefined conditions helping you act before emotions take control.
With this tool trading decisions are based on planning not impulse.
💡 5 Practical Recommendations to Counter Market Maker Manipulation
Master your tools Learn Volume Profile RSI and Fibonacci to identify traps and make logical decisions.
Avoid emotional reactions Pause before buying or selling and check if the move is real or a psychological trap.
Analyze whale behavior Track unusual volumes and heavy moves to react ahead of the crowd.
Understand market cycles Pump and dump moves often align with collective emotions consider them before entering trades.
Follow a trading plan and set Alerts Define entry/exit points and notifications to prevent crowd-driven impulsive decisions.
✨ Need a little love!
We pour love into every post your support keeps us inspired! 💛 Don’t be shy, we’d love to hear from you on comments. Big thanks, Mad Whale 🐋
📜Please make sure to do your own research before investing, and review the disclaimer provided at the end of each post.
SOLUST trade ideas
SOLUSDT → Stronger than the market. Correction before growthBINANCE:SOLUSDT updated its maximum to 218 and entered another phase of correction for consolidation. The altcoin looks quite strong against the backdrop of the rest of the cryptocurrency market...
Bitcoin continues its aggressive decline after yesterday's trap (false breakout of the trend line). Despite relatively positive fundamental and technical developments, the cryptocurrency market is in the red. Against this backdrop, SOL stands out as a strong altcoin compared to Bitcoin, which has been falling for two weeks. SOL updated its maximum and entered a correction phase. Within the current structure, the price may test the liquidity zone of 202.5 - 195.3 before continuing to grow to 220 - 240.
The reaction to false breakouts of local highs is weak, there is no reversal, and the nature of the current structure is “consolidation.” If the bulls keep the price above 200 during the correction, the further outlook will be positive.
Resistance levels: 216.5, 220, 244
Support levels: 202.5, 198.0, 195.3
Focus on the current correction. We need to wait for a slowdown and the end of the structure. Focus on the specified support zones, from which the market may resume bullish trading, which in turn may lead to a breakout of intermediate resistance and growth to the specified targets.
Best regards, R. Linda!

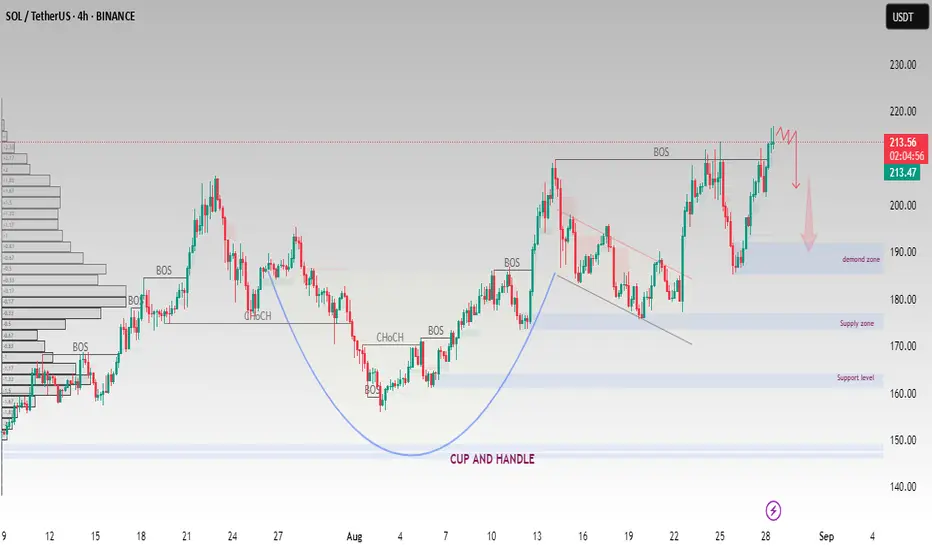
SOL/USDT – Cup & Handle Breakout with Demand Zone in FocusSolana (SOL/USDT) on the 4H chart is showing a Cup & Handle pattern, a bullish continuation formation. Price has recently broken the neckline around 213 – 215, but it is now facing strong resistance near the 220 zone.
Key levels to watch:
Resistance: 215 – 220 (possible rejection area)
Demand zone: 190 – 200 (potential pullback level)
Supply zone: 170 – 180 (secondary support if deeper correction occurs)
Support level: 160 (major downside protection)
If price sustains above 220, continuation toward 230+ may be expected.
A rejection at resistance could trigger a retest of the 190 – 200 demand zone before any bullish continuation.
Bullish in the bigger structure, but short-term correction remains possible.
This analysis is for educational purposes only and should not be considered financial advice. Always manage your risk and trade according to your plan.
SOLUSDT – Bullish Momentum in Upward Channel | Breakout WatchSolana (SOL/USDT) is respecting an upward channel on the 4H chart, showing steady bullish structure.
✅ Multiple Break of Structure (BOS) confirms ongoing uptrend
✅ Price is currently rebounding from the channel support
✅ A clean breakout above 210 – 220 resistance zone could fuel a rally toward 230+
✅ Demand remains strong with supply zones near 190 – 200 providing key support
Key Zones:
📍 Support: 190 – 200 (Supply Zone), 170 (Major Support Level)
📍 Resistance: 220 – 230 (Channel Top)
📍 Next Target: 225 – 230
Watch for channel breakout confirmation and manage risk with stop loss below recent structure support

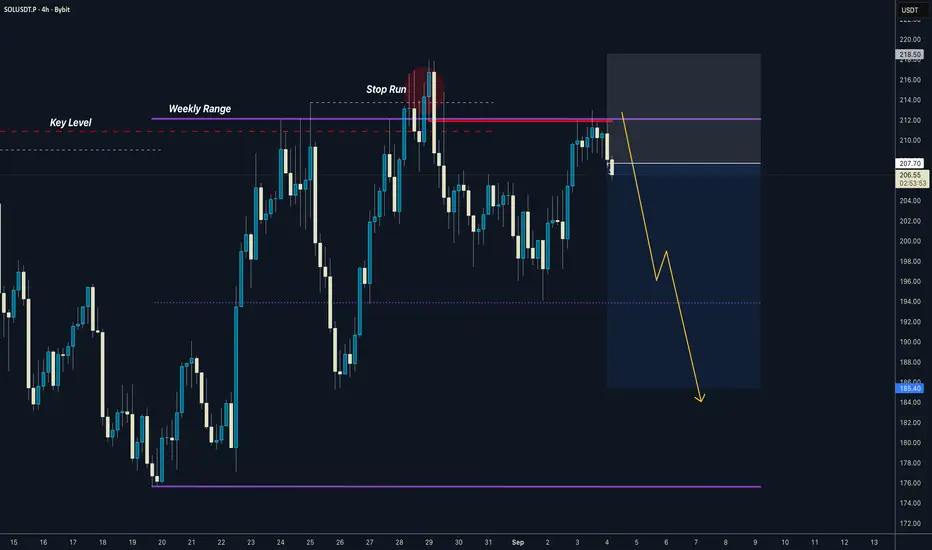
SOLANA everything is ready for the classic Thursday dump
Weekly range manipulated
Traded inside to induce sellers
Stopped them out
Created OB
Retested
Short is ready
There are so many people on here who are addicted to gambling
But they don’t want to accept it - so they call themselves a trader because it sounds much better and productive than being addicted to casino games or sports betting
Make sure you’re doing trading for the right reasons
You need to have a deep look at yourself and what you’re doing
Trade responsibly
David Perk
SOLUSDT: Trade 15 min Trade Hello friends. As you seen the chart of SOLUSDT we see the correction Wave abc to reach the 212$ price and I gusse will be start the countinues the big correction.

SOL - Retest the Zone, Reload the Longs!Solana continues to trade within a well-defined ascending channel on the daily timeframe. After a strong bullish leg, price is now pulling back toward the highlighted support zone, which also aligns with the lower bound of the short-term channel.
As long as this area holds, it offers an attractive spot to look for fresh long opportunities. A confirmed bounce here could set the stage for continuation higher toward the channel’s upper boundary.
The structure remains bullish, and dips into demand are where the best risk-to-reward setups lie. Keep an eye on this zone for the next move.
⚠️ Disclaimer: This is not financial advice. Always do your own research and manage risk properly.
📚 Stick to your trading plan regarding entries, risk management, and trade execution.
Good luck!
All Strategies Are Good; If Managed Properly!
~Richard Nasr

Lingrid | SOLUSDT Potential Long ot Psychological Level of $200The price perfectly fulfilled my previous idea . BINANCE:SOLUSDT is pulling back after testing the resistance zone near 208–210 and remains supported by the upward channel structure. Price action has formed a range above 195, with higher lows protecting the trendline and momentum holding firm. If 195–200 holds as support, price could rebound toward the 225 level for the next leg. Sustained momentum inside the channel keeps the broader bias bullish with potential mid-term targets higher.
📉 Key Levels
Buy trigger: Rejection 200 support zone
Buy zone: 195–200 accumulation region
Target: 225
Invalidation: Break below 180
💡 Risks
Breakdown of the upward channel with daily close below 195.
Strong USD data pressuring risk assets across markets.
Loss of broader market momentum leading to deeper corrective moves.
If this idea resonates with you or you have your own opinion, traders, hit the comments. I’m excited to read your thoughts!

Solana (SOL): Buyers Are Building Bullish Setup | Q4 BullRunHad minimal sleep today, hence the sleepy voice but had to make a video today—we are seeing good momentum building up for SOL coin, which could give us a decent buy entry here.
More in-depth info is in the video—enjoy!
Swallow Academy

Rising wedge solMusic look like stopping soon.
Sol have High possibilities breakout from this rising wedge pattern in daily chart soon.
Any long position is good to take profit for spot and futures trader.
SOL/USDT – Rejection at $205, Momentum Weakening | $185 Retest LSolana (SOL/USDT) – Daily Chart Analysis
SOL attempted a breakout above the key $205 resistance zone but failed to hold above it, showing signs of a bull trap or false breakout.
🔍 Technical Highlights:
RSI is showing bearish divergence (price made a higher high, RSI did not) and is now hovering near the neutral 50 level — suggesting momentum is fading.
MACD is crossing below the signal line, though still above zero. This points to weakening bullish momentum, not yet full bearish confirmation.
Stochastic RSI is curling downward around the midpoint, hinting at a potential short-term pullback.
Volume has decreased on the recent move up — lack of conviction from buyers.
Key Support to Watch:
$185 zone, which lines up with the 50 EMA — strong potential for support or consolidation.
Bearish Scenario:
A breakdown below $185 could open the door for a deeper retracement toward $170–$172, which is near the 200 EMA.
Bullish Invalidation:
A strong reclaim and close above $205 with rising volume would invalidate the short-term bearish setup and may signal continuation toward $219+.

SOL SHORTBearish engulfing candlestick formed on 4hr chart. This coincides with BTC's price reversal at 112K.
$195 demand zone not looking strong enough . Loos like more downside to $175.

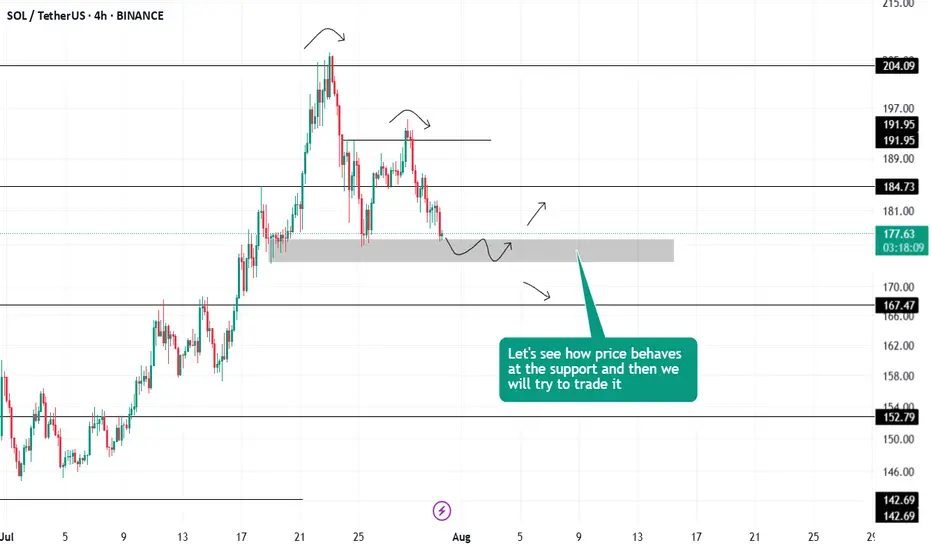
#SOL TRADE IDEASol has now approached an important support level. Let's see how the price behaves at this black zone to make further decision .
Next major support $157
Solana · At The Top of The RangeI've been looking at many charts and seeing a repeating pattern; many pairs are trading right at resistance, at the top of the range.
This same rising triangle we see on SOLUSDT was present in another pair, and many other charts look similar.
The altcoins market is pushing higher, trying to break a local resistance zone. You know what happens when this level breaks don't you? Wave 3 of the bullish cycle, normally the strongest wave, starts.
Wave 5 is still missing of course but it normally tends to be an extension of the third. Sometimes wave 5 can become much bigger than wave 3 but right now we still don't know how things will develop in this current bullish cycle. In general, wave 3 is always the strongest one.
So there is the possibility that we are right in front of the strongest period of bullish action in the entire 2025-2026 Cryptocurrency bull market.
Summary
Solana is going up. Even if prices drop, the end result of the drop would be a higher low, which implies higher prices next.
Regardless of the short-term, SOLUSDT is set to move higher. This statement is supported by market data.
Thank you for reading.
Namaste.
DeGRAM | SOLUSD above the $200 level📊 Technical Analysis
● SOL/USD is trading within a well-defined ascending channel, holding above the 189–190 support zone and building higher lows that reinforce bullish structure.
● The current move targets the 226–230 resistance, with the rising parallel channel supporting further gains as long as price remains above 189.
💡 Fundamental Analysis
● Solana’s DeFi TVL has grown over 20% in August, driven by fresh institutional inflows, while its ecosystem expansion (notably in gaming and payments) strengthens adoption.
✨ Summary
Bullish above 189; breakout continuation eyes 226 → 230. Invalidation below 189.
-------------------
Share your opinion in the comments and support the idea with a like. Thanks for your support!
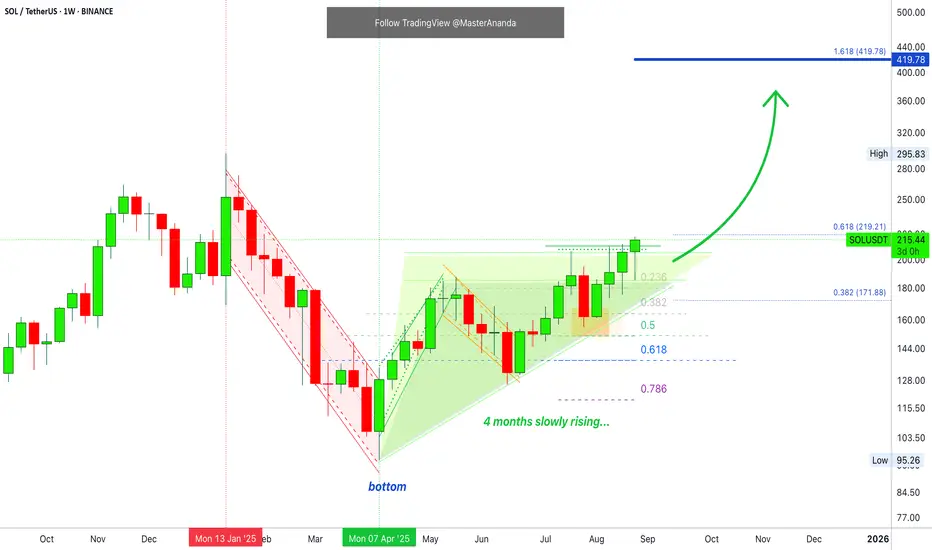
Alert! Bullish Explosion About To Unfold —You've Been Warned!Hey, remember that chart I've been showing you about Solana on the daily timeframe, the luxurious rising channel?
Well, this same drawing looks many times better on the weekly; I won't even have to convince you anymore. After seeing this chart, you will be sold. Solana is going up.
Technical analysis
Consider this chart, SOLUSDT weekly. Solana has been closing three consecutive weeks green. This is the fourth green week and here comes the best part; this week is reaching its end and Solana already went down (lower wick on the candle). Once the downside is taken care of, the bulls can resume with their growth.
Four consecutive weeks closing green as bullish consolidation can only mean that a bullish explosion is about to unfold. I can give you countless of signals, but follow and trust my words; the Cryptocurrency market is rising and what you are witnessing now is only the start.
You've been warned!
Namaste.
SOL Ready to RIPSolana has been demonstrating notable resilience in recent sessions, consistently finding support along a well-defined local uptrend visible on the 1H, 2H, and even 4H timeframes. The $200 level continues to serve as a critical inflection point, acting as both historical support and resistance, with price repeatedly testing but struggling to establish firm acceptance above this zone.
That said, with Ethereum showing renewed strength and capturing market attention, we could begin to see capital rotation into other leading altcoins as investors look for relative value and potential catch-up plays. This type of market dynamic often precedes what many refer to as “alt season,” when capital flow broadens beyond Ethereum and Bitcoin, sparking accelerated moves across the broader crypto market.
Whether this backdrop evolves into the explosive breakout traders are anticipating remains uncertain—but the stage appears to be set. As always in these markets, conviction must be balanced with patience, as only time will ultimately reveal whether the momentum materializes into the massive move so many are hoping for.

Perfect Solana · Keep Holding · Too Early To Give UpSolana is in a perfect position. Notice the last four days that closed red. 29-Aug through 1-Sept. All these days of bearish action but no major drop. This is a marketwide bullish signal.
Marketwide because Solana is one of the big projects.
Solana is Crypto: What one does, the rest follows.
If Solana is set to continue growing, as it is shown by its massive strength, then we know the other projects that move together will do the same thing.
Some pairs can look weak and we don't know if they will continue to drop or instead reverse to start (resume) moving higher.
Seeing SOLUSDT and the perfect rising triangle; how easy Solana continues to move higher even while Bitcoin was experiencing strong bearish action, reveals what is happening behind the scenes.
Money is being shuffled around. Whales are loading up. The plan is being implemented and the resutls will be awesome.
Do you see a bullish chart here?
Does the drawings on the chart reveal the tendency and bias for this pair?
Look, the market can move lower of course, but we have a rising channel. Any drop will be bought.
Solana has much more to give. Too early to give up.
Thank you for reading.
Namaste.

Sep 1, 2025 - SOLUSDT 4H Chart Big Picture
At a broader look, the SOLUSDT chart is currently testing a major historical resistance at 203.36 — a level first seen back in 2021 and again in early 2024. This zone was finally broken toward the end of 2024, but the breakout lacked momentum, and after touching around $300, the price fell back below this level.
Now, Solana appears to be making another attempt to break through this ceiling, forming a very interesting structure. On the first retest, strong selling pressure was clear and pushed the price lower. However, it didn’t take long before price came back to the zone again — this time slightly pushing sell orders higher. Since then, each touch of this level has repeated the same story, gradually forming a triangle-like shape.
To measure the strength of buyers vs sellers in this zone, I analyzed the volume across each leg. What stood out was the rising volume on bullish legs, which suggests stronger buying pressure compared to selling.
Another important observation: while price is struggling to print significantly higher highs, it’s consistently forming higher lows — another clear sign of buy-side pressure.
This analysis provides a broader, medium-to-long-term perspective on SOLUSDT. In the next post, I’ll break down the entry triggers and target levels.

#SOL Don't worry until 240 $.but after that, 60 $ is coming.#SOL Don't worry until 240 $.but after that, 60 $ is coming.
#SOL Crash. We already warned when SOL is Trading above 240 $ ..
Past Analysis also attached.

Solana Reclaims $197 Support, Eyes Expansion Toward $260Solana (SOL) has reclaimed $197 support above the value area high. With vertical accumulation in play, sustained volume inflows are needed for continuation toward the $260 resistance level.
Solana continues to show bullish strength as it reclaims $197 support, establishing a base above the value area high. This development confirms the ongoing vertical accumulation structure, characterized by consistent higher highs and higher lows. With market structure intact, Solana is preparing for the next stage of its bullish advance.
Solana (SOL) Key Technical Points
- $197 Support Reclaimed: Price now sits above the value area high.
- Vertical Accumulation: Structure of higher highs and higher lows remains intact.
- Upside Target at $260: Breakout continuation could extend to this key resistance.
The reclaim of $197 marks an important step for Solana’s bullish trajectory. This support is not only structural but also symbolic of market confidence, as price has managed to consolidate above the value area high. Reclaiming this zone eliminates immediate downside risk and places Solana back into a position of strength.
Price action continues to demonstrate vertical accumulation, where each pullback has been shallow and quickly followed by another leg higher. This behavior is consistent with strong bullish environments, where demand consistently outweighs supply. The preservation of higher lows throughout this uptrend further confirms Solana’s strong structural integrity.
For continuation toward $260, volume will play a decisive role. While Solana has shown impressive structural resilience, the sustainability of the move depends on bullish influxes maintaining strength. In recent sessions, demand has been supportive, but this must continue and intensify as price approaches higher resistance levels. Without growing volume, momentum risks fading before reaching $260.
The $260 mark is the next major resistance zone, aligned with prior structural rejections and psychological significance. A clean test and breakout of this level would confirm continuation and potentially open the door for further extensions on higher timeframes.
What to Expect in the Coming Price Action
As long as Solana holds $197 as support, the bullish outlook remains intact. Sustained bullish volume inflows should propel price toward $260 resistance, confirming the vertical accumulation phase and reinforcing the continuation of Solana’s uptrend.

The key is whether it can rise above 237.60
Hello, fellow traders!
Follow us to get the latest information quickly.
Have a great day.
-------------------------------------
(SOLUSDT 1M Chart)
To understand the strangely drawn trendline, you need to refer to the StochRSI indicator.
This is because the StochRSI indicator was used to draw the trendline.
When the K indicator of the StochRSI forms a peak in the overbought zone, a trend line is drawn by connecting those peaks. When the K indicator forms a peak in the oversold zone, a trend line is drawn by connecting those peaks.
When drawn this way, the trend line drawn in the overbought zone becomes the high trend line, and the trend line drawn in the oversold zone becomes the low trend line.
However, due to the long timeframe of the 1M chart, the high and low trend lines are not separated and are instead displayed as a single line.
Of the three trend lines, we need to determine whether the upward trend can continue along trend line (1).
The DOM (60) indicator is forming at 237.60, so the key question is whether it can break above this level.
Illegible areas are marked with circles.
-
(1W Chart)
Looking at the explanation of the big picture below, a major bear market is expected to begin in 2026.
However, the trend lines drawn on the chart suggest that the upward trend could continue until the first quarter of 2026.
With time remaining until the end of 2025, we need to closely monitor BTC's movements.
The DOM (60) indicator on the 1M chart is at 237.60, so the key question is whether it can break above 237.60 and maintain its price.
However, the DOM (60) ~ HA-High range formed in the 202.45-222.61 range on the 1W chart, so whether it can find support within this range is crucial.
Accordingly, the volatility period on the 1W chart is the period around the week of September 29th, i.e., September 22nd to October 5th.
Please refer to the circled area on the 1M chart for the important period.
-
(1D chart)
This volatility period ends on August 29th.
The next volatility period will be around September 7th.
After the volatility period around September 7th, we need to see if the price remains above 195.92.
If the price remains above trendline (1), it is highly likely that an attempt to rise above 222.61 will occur.
---------------------------------
As mentioned earlier on the 1W chart, the key question is whether the price can rise above 237.60.
To draw a line, we need to examine whether the 202.45-222.61 range provides support and can move upward.
From this perspective, if the 202.45-222.61 range provides support, it's considered a buying opportunity.
However, considering the basic trading strategy, buying in the DOM(-60) ~ HA-Low range and selling in the HA-High ~ DOM(60) range is necessary, so we can see that this is actually a selling opportunity.
Therefore, executing a new purchase in the 202.45-222.61 range requires a short and quick response.
If you maintain a basic trading strategy, you can either sell in installments to gain psychological stability or choose to purchase additional shares when the 202.45-222.61 range provides support.
-
Some people argue that support and resistance aren't important, but rather whether the price will rise or fall.
Yes, I agree with this.
However, to move up or down, you need to understand the support and resistance points or ranges that serve as reference points.
If you can't distinguish between these, you won't be able to trade, regardless of whether the price is rising or falling.
Therefore, you need to evaluate how important the support and resistance points or ranges formed at the current price are.
If you don't understand this, you'll end up trading by buying late after the price has risen or selling late after the price has fallen.
-
Thank you for reading to the end.
I wish you successful trading.
--------------------------------------------------
- This is an explanation of the big picture.
(3-year bull market, 1-year bear market pattern)
I will explain in more detail when the bear market begins.
------------------------------------------------------

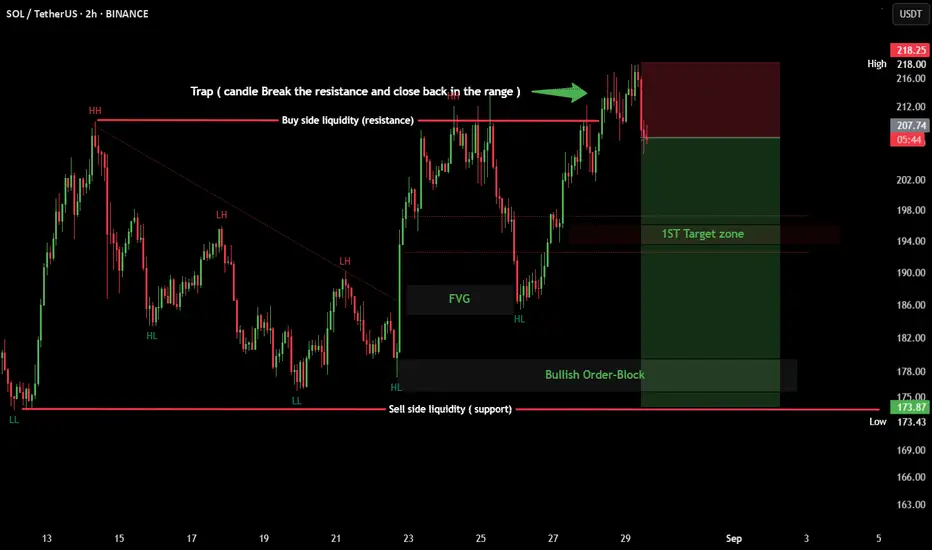
SOL/USDT | Liquidity TrapPrice broke above resistance but quickly closed back in the range, signaling a potential bull trap. Liquidity was grabbed at the highs, and now sellers may target the first demand zone near $194. If momentum extends lower, the bullish order block at $175 becomes the key support.
False breakout above resistance, liquidity grabbed – eyes on $194 first, then $175 bullish OB