Long trade
1hr TF overview
🔹Trade Journal Entry – SOLUSDT Perpetual (SOL/USDT-P)
Trade Type: Buyside Trade
Date: Tuesday, 7th October 2025
Session: London to New York Session AM
Timeframes: 1-Hour (structure) / 5-Minute (execution)
🔹Trade Details
Entry: 223.650
Profit Level: 245.670 (+9.85%)
Stop Level: 221.414 (-1.00%)
Risk-Reward Ratio: 1 : 9.89
🧭 Technical Confluence
1. Market Structure (1H Chart)
Price broke prior BOS (Break of Structure) from 15-min support zone at 221.29.
Formed higher low at VWAP (220.71) following accumulation phase.
EMA alignment shows 50 EMA crossing above 200 EMA, signalling momentum shift to buyside.
Prior inducement and liquidity sweep around 225.28–224.59 confirmed mitigation before reversal.
5min Chart
2. Entry Precision (5M Execution)
Entry within 30-min FVG (Fair Value Gap), aligning with BOS and volume expansion confirmation. Strong delta (+1.03K) confirms absorption of sell pressure at entry zone.
Local BOS above 222.97 triggered execution; confirmation candle closed above EMA band.
VWAP acted as dynamic support, validating institutional buy zone.
3. Volume Context
Pre-entry consolidation marked by low volume, followed by high-volume impulse as price broke short-term resistance at 223.50. Volume-based confirmation supports institutional participation.
Trade Narrative
The trade followed a liquidity-based buyside structure, with accumulation visible around VWAP and a clear displacement following BOS confirmation. The 5-minute FVG provided a low-risk entry aligned with the higher-timeframe demand structure. Maintaining above 221.41 preserves the bullish bias, with price likely to revisit prior inducement level at 225.28 and extend towards 245.67 (premium range target).
📈 Key Levels
Level Type Price Context
VWAP Support 220.71 Accumulation base
FVG 30-min 223.32 – 223.76 Entry zone
Inducement Level 225.28 Potential partial take-profit
Target (Range High) 245.67 Major liquidity zone
Stop 221.41 Below mitigation low
Final Bias: ✅ Buyside (Continuation Trade)
Target Zone: 245.00–246.00
Invalidation Level: Below 221.40
Trade ideas

SolFrom when I posted about solana we did good numbers on that
Just a quick reminder to my followers to always secure profits as you go
So you don't get caught if price decides to reverse

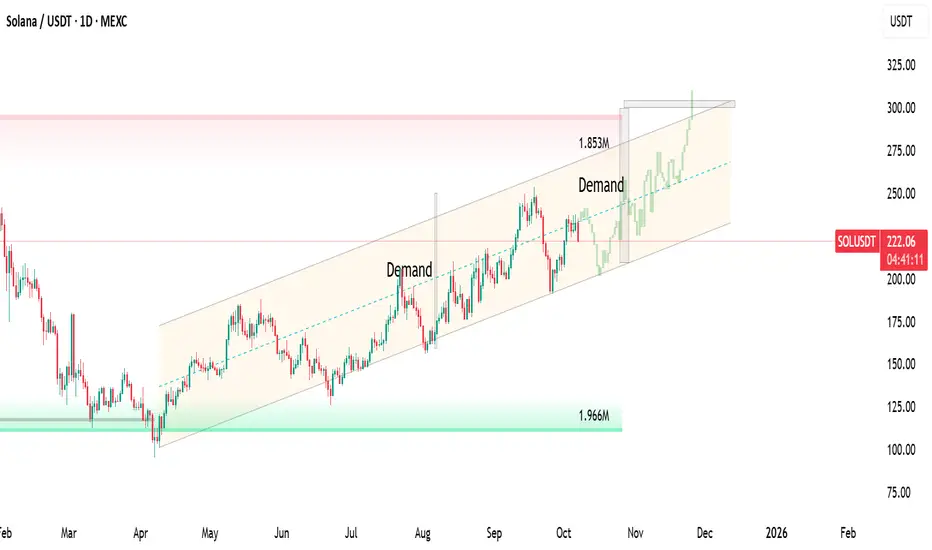
How high could SOL price go if a spot Solana ETF gets approved?The price of Solana is fluctuating, creating price cycles of demand and supply within the channel. The last price cycle from August to September was 54% and the current move is likely to copy the same demand.
The target in case of ETF approval is: www.cointrust.com
$300 Solana Inevitable!Nice rejection on Solana. Now lets see if we will get the move to the downside for a nice long trade to target $300.
Calculate Your Risk/Reward so you don't lose more than 1% of your account per trade.
Every day the charts provide new information. You have to adjust or get REKT.
Love it or hate it, hit that thumbs up and share your thoughts below!
This is not financial advice. This is for educational purposes only.

SOL Short Idea It seems sol can give a retracement till 208, before the next leg-up. It has formed a bearish engulfing pattern on the 4h tf. On the re-test of the zone I will try a small short.
#NFA
#DYOR
An importance of funding rateSee the chart and check funding rate on your exchange. As soon as exchanges put funding rate to +0.01% price tends to go downwards. So close your long positions during these events.
#trends

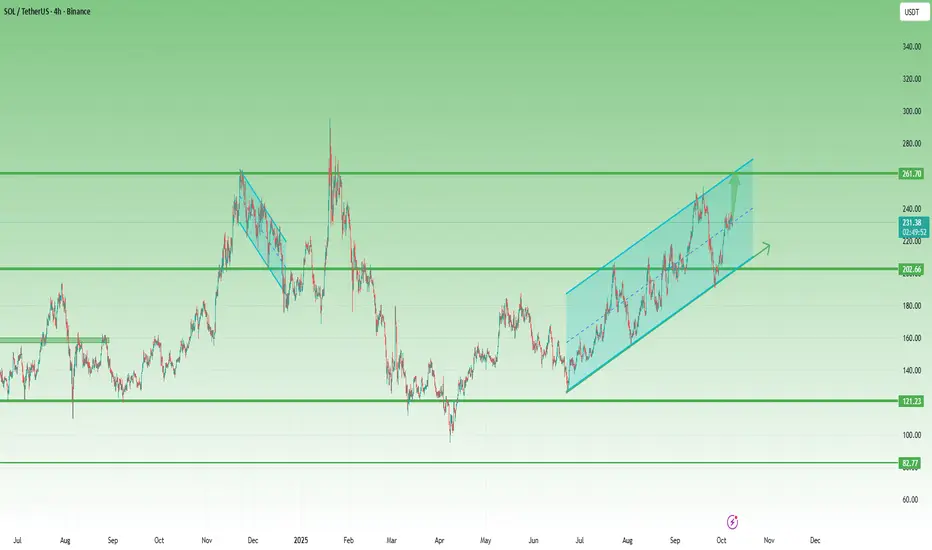
Solana in an Ascending Channel – Bulls Must Hold Above 215After the strong correction from 300 to below 100, Solana finally started to recover. Following an impressive 90% rebound, the price corrected again but managed to form a higher low just above the 120 support zone — a constructive signal for medium-term buyers.
Since then, Solana has been trading inside an ascending channel, showing consistent bullish control with well-defined higher highs and higher lows.
Recently, the market spiked slightly below 200, only to confirm the lower boundary of this channel before bouncing back.
In my previous SOLUSDT analysis, I mentioned that it was imperative for bulls to hold the 200 level to validate the ongoing reversal structure — and that’s exactly what happened. The market respected this support zone perfectly, leading to a 15% advance since then.
At the time of writing, Solana is consolidating near the midline of the ascending channel, suggesting a temporary pause before the next potential leg higher.
If this consolidation breaks to the upside, the next key target for bulls is 260, a confluence resistance formed by the upper boundary of the channel and the November 2024 swing high.
________________________________________
🔹 Summary
• Strong support: 200 (confirmed)
• Ideal bullish threshold: Above 215
• Next resistance: 260 followed by 300
• Structure: Ascending channel – continuation pattern
________________________________________
In conclusion, Solana remains bullish while holding above 200, but ideally, the price should stay above 215 to preserve upside momentum.
A breakout above 240 would likely trigger a test of 260 followed by 300, which becomes very probable— the next key resistance zone. 🚀
SOL/USDTCRYPTOCAP:SOL has clearly formed a double bottom pattern, signaling strong reversal momentum. The target aligns with the end of the blue arrow, and once confirmed, it’s set for an explosive move to the upside.

SOL Long ScalpTimeframe 15m
Konservatif = Waiting for reject candle (Bullish Engulfing/Green Hammer)
Aggressive = Limit Order

SOL-USDTFailure to break $265 🔽
And on the other hand above the bottom of $226🔼
Let either the resistance be broken for a buy
Or the support number I mentioned be lost for a sell on Solana 🔽💲

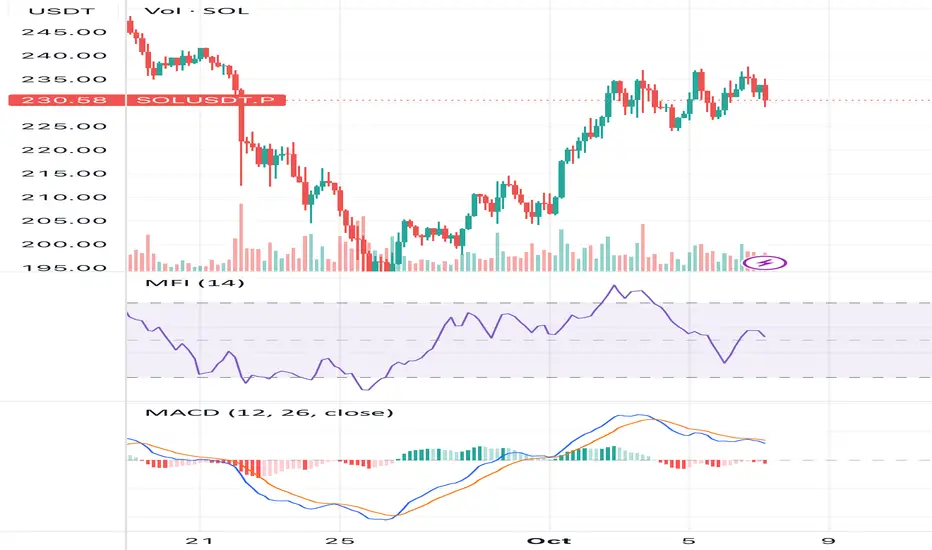
Triggers: 4h-close below 235 and/or < 230.9 (Don20-Mid) with RSIWhat does it mean now
1. The structure is "bullish but thin": the price is at the tops of Donchian/BB/Keltner, ADX ~33 and CMF>0 confirm the trend, but the MACD-hist −0.11, a series of bearish divergences (RSI/MFI/OBV), and a low OI (z −1.34) indicate that the momentum is going without a noticeable set of futures positions.
2. Squeeze ON ~13 bars: the market is compressed, and an impulse exit is likely.
3. Profile: a strong HVN core of 202-208 (POC ~207.9), we are trading above, VAH ~239.7 near the current price → above the supply zone.
4. Premium to VWAP ~+1.1σ: there is upward space, but it is already "not cheap" relative to average demand.
⸻
Key levels
• Resistance: 237.75 (Donch-High 20/55) → 239.66 (VAH) → 244.9–245.0 (LVN-thin zone).
• Supports: 235–231 (BB/EMA20/Don20-Mid 230.9) → 224.0–221.2 (BB-/KC-low) → 207.9 (POC) → 202–208 HVN-cluster → 197.9 (Don55-Low zone of the upper range).
⸻
Scenarios and triggers (not financial advice)
A) Basic — rotation/balance above the averages with a check of 230–232
Why basic: Squeeze ON, MACD goes out, divergences are bearish, and OI is low — more often, the market "chews" the level before choosing a direction.
• Triggers: 4h-close below 235 and/or < 230.9 (Don20-Mid) with RSI<55 / MACD weakening, without OI growth.
• Targets: 231 → 224–221 (edge of bands/channels). Deeper — retest 207–208 (POC/HVN) if the impulse fades.
• Invalidator: quick return and fixing > 237.8.
B) Pulse break-up (Squeeze-release)
• Trigger: 4h-closing > 237.8 + buffer ≈ +0.1·ATR ≈ +0.45$ (i.e. > 238.25) and holding above 237.8 at CMF≥0, OBV↑, preferably OI↑.
• Targets: 239.7 (VAH) → 244.9–245.0 (LVN) → with good OI, expand to higher levels.
• Invalidator: return < 235 on increased volume.
C) Bearish reversal from VAH/Don-High
• Trigger: rebound from 237.8–239.7 with 4h-close < 235, RSI↓, MACD-hist in the red, OI↑ on the red candle (inflow of shorts).
• Targets: 230.9 → 224–221 → 207–208.
• Invalidator: re-capture > 238.3 with OI not falling.
⸻
Tactics (example of logic)
• Pullback long (conservative): monitor demand in 231–232 (candle reaction + CMF≥0, OBV↑). Stop — below 224-221, targets — 235 → 237.8 → 239.7.
• Impulse long (aggressive): after 4h-close > 238.25 (breakdown with buffer), partial fixation at 239.7, trail to 244.9–245.0.
• Countertrend short: only with a clear rejection in the 237.8–239.7 zone + confirmation (RSI/MFI down, MACD-histo < 0, OI↑). Targets are 235 → 230.9 → 224–221; stop is at ~240–241.
⸻
Briefly: what to expect
• Base: consolidation/rotation in 231–238 with a risk of moving to 224–221 until momentum and OI confirm a breakout.
• If we gain a foothold above 238.25, we can expect an upward move to 239.7 → 244.9–245.0.
• If we lose 230.9, we can expect an upward move to 224–221, and if we are weak, we can expect an upward move to 207–208.
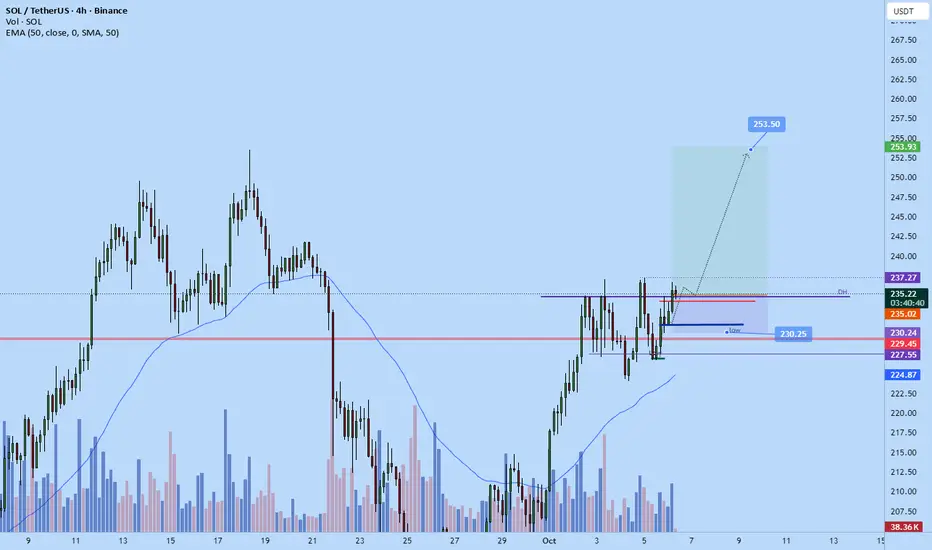
solana swing long back to ATHOpened up a swing long position a while ago on solana. Slowing down on the intraday trades and scalps for now as the market been getting too volatile for me.
Sl: 230.25
Exit limit order set to : $253.5
Roughly 4RR from current entry.
Long the king, and short the "Sol" Jack ?Being long Bitcoin is being long on a healthy market rally with BTC.D bouncing, and therefore Bitcoin leading.
If BTC.D bouncing means an overall retrace on the market, I think Sol makes a good candidate for a short position to target 150s
I think the DATs and the ETF narratives are getting pretty exhausted, and that could make an extra argument, even if this is the part where it gets tricky (timing tops is hard).
Still, i think playing this with 30/40% of the Bitcoin long is EV+
Game on!

SOLUSDTSOLUSDT
I expect the price to go to 250 zone, the latest hh and if the price is not making a new hh then i expect the price to go down to 212 zone and bounce from there if the support stay.

Solana: Macro Support and Bullish Setup – Target 240→245 USDHello everyone, Solana has drawn attention as its price remains steady around 234 USD, despite minor profit-taking in the broader market. The overall picture remains positive, supported by renewed institutional inflows and a weakening USD, providing a foundation for further gains.
Globally, concerns over the US government shutdown and expectations of a rate cut from the Fed are weighing on the dollar, while appetite for decentralised assets like Bitcoin and Solana is rising. Major investment firms such as Grayscale and MicroStrategy continue to accumulate, helping capital spread to ecosystems with strong fundamentals – particularly Solana, where DeFi and NFT activity remain vibrant. These macro factors are clearly supportive of further upside momentum.
From a technical standpoint, SOL maintains a clear bullish structure. It continues to trade above Ichimoku’s cloud support, signalling that buyers remain in control. The 230–232 USD zone acts as a key cushion, followed by 228–230 USD and deeper 221–223 USD levels, where previous Fair Value Gaps (FVG) have been filled. On the upside, resistance lies near 236 USD; once cleared, targets extend to 240 and 245 USD. Rising trading volume during recent upward moves reinforces this trend, showing that demand remains strong.
In the preferred scenario, Solana may dip slightly to retest 230–232 USD before bouncing higher toward 236 and 240 USD. A break above 240 could open the way to 245 USD. If price slips below 228 USD, a deeper pullback to 223 USD may follow before recovery.
So, what do you think — will SOL have enough strength to break above 240 USD this week?


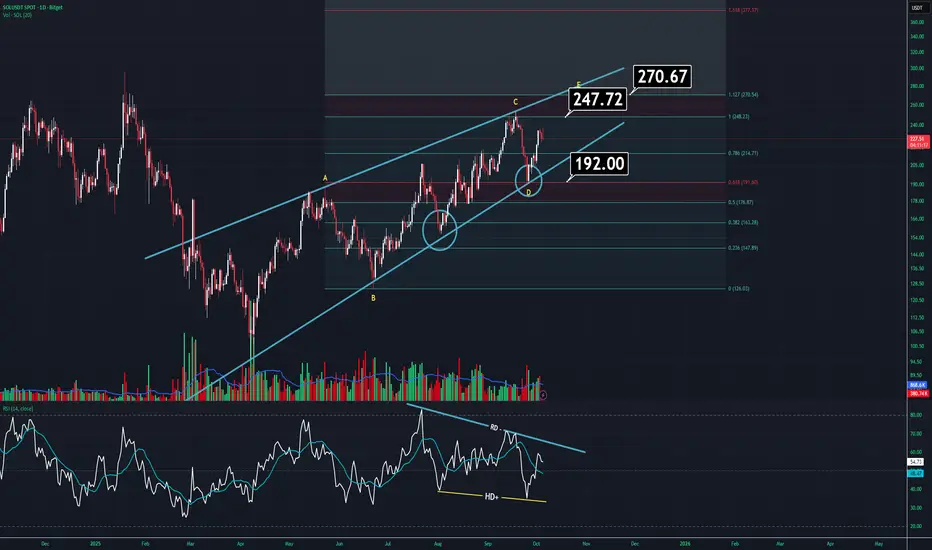
SOLANA UPDATE (1D)SOL is currently at a decision point, mainly due to both the ongoing recession and the delayed ETF approvals.
On the daily chart, it’s getting squeezed inside a large wedge pattern. Normally, it should make one more top before breaking down. However, just to be clear — if price drops below 192, there’s a strong possibility of a sharp sell-off. That’s where both the character shift and wedge breakdown would occur.
Some additional details:
Volume is flat and indecisive. It’s moving in line with the wedge, which isn’t a great sign. Typically, this kind of volume behavior is seen during wedge formations.
The RSI looks unusual — there are both negative and hidden bullish divergences. If you’re wondering which one matters more, it’s the hidden bullish divergence — it’s the stronger signal here.
If the recent high is broken, we could see SOL climbing towards the 270 region, after which we’ll know whether the wedge remains valid. However, in general, the outlook doesn’t look too strong at the moment.
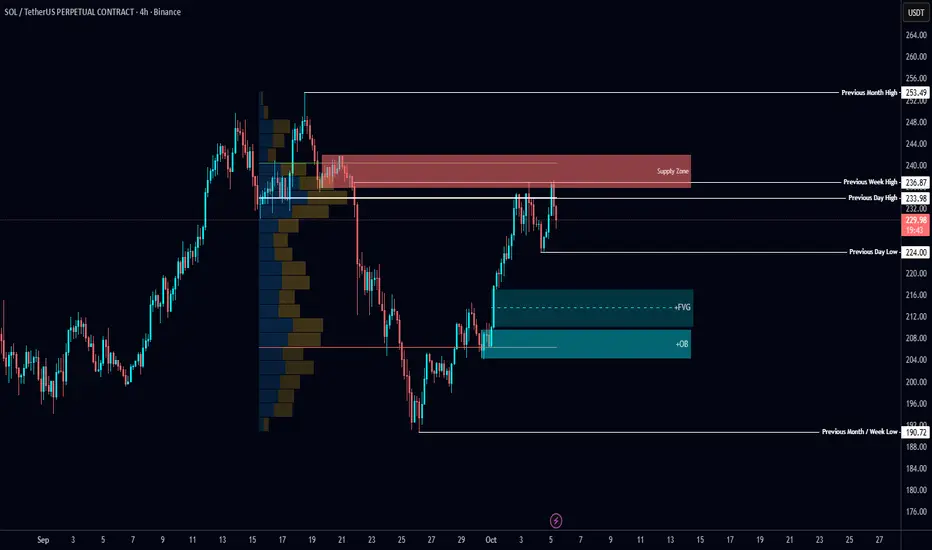
$SOL Analysis🚨 CRYPTOCAP:SOL Analysis 🚨
CRYPTOCAP:SOL tapped the Supply Zone and swept previous week’s high for liquidity 👀
Now trading below POC.
⚡ If this flips, an easy path opens to the previous month’s high.
📉 Otherwise, I’ll wait for confirmation to short and target bullish OB + FVG levels below.

TradersCity Pro | Solana Bulls Eye Breakout Beyond Resistance👋 Welcome to TradeCity Pro!
In this analysis, I’ll be breaking down Solana (SOL),one of the most popular “Ethereum Killer” projects, currently ranked #6 on CoinMarketCap with a market cap of $122.87B.
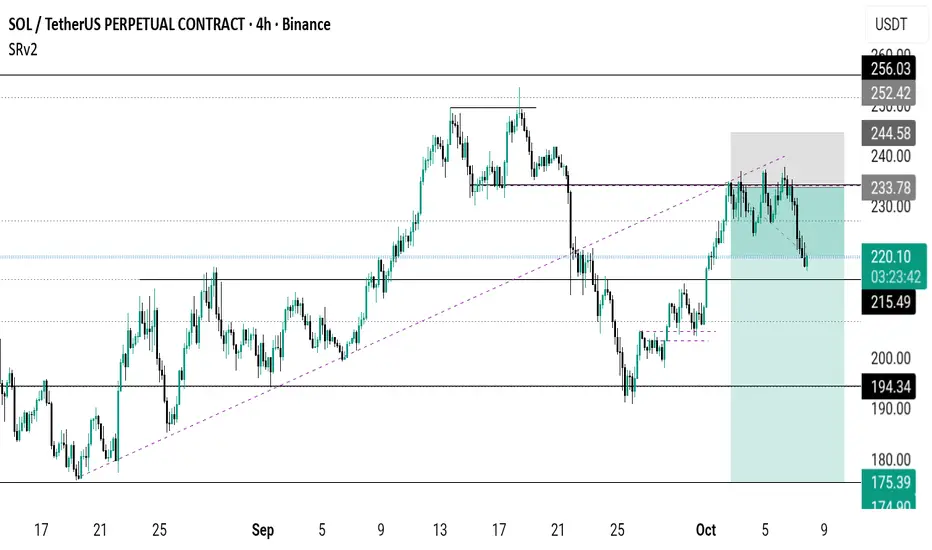
⌛️ 4-Hour Timeframe
On the 4-hour chart, Solana started a bullish move after being supported at the $194 zone. Once it broke the trigger at $213.14, it rallied strongly toward the next resistance zone I’ve marked on the chart.
✨ At the moment, that bullish wave has cooled off. The RSI has exited the overbought zone, and price has been rejected from the resistance ceiling.
✔️ The next bullish trigger we’re watching will be a clean breakout of this resistance zone. On future retests, we can identify the exact resistance level more precisely and use it as an actionable entry trigger.
⭐ The main resistance for SOL is at $248.58. A breakout here would confirm the start of a larger bullish wave in the higher cycles. That’s why it’s important to already have a position before this breakout—so if the level flips, you’re not left behind and your earlier long runs into solid profit.
🔍 If price pulls back, the outlook remains bullish as long as SOL stays above $213.14. In that case, I see more probability for the next bullish leg than for a trend reversal.
📊 However, if $213.14 breaks and price consolidates below it, that would be the first confirmation of a bearish shift and a possible trend reversal.
📝 Final Thoughts
Stay calm, trade wisely, and let's capture the market's best opportunities!
This analysis reflects our opinions and is not financial advice.
Share your thoughts in the comments, and don’t forget to share this analysis with your friends! ❤️

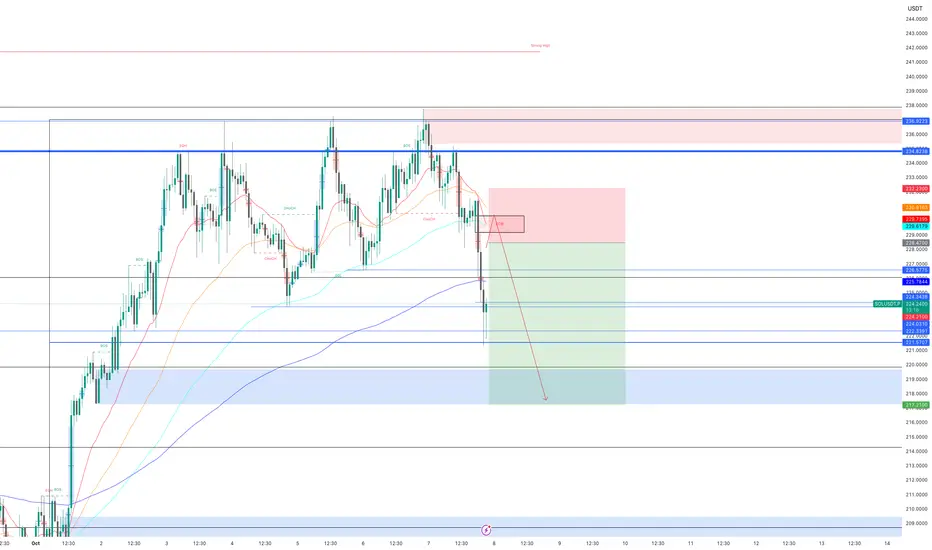
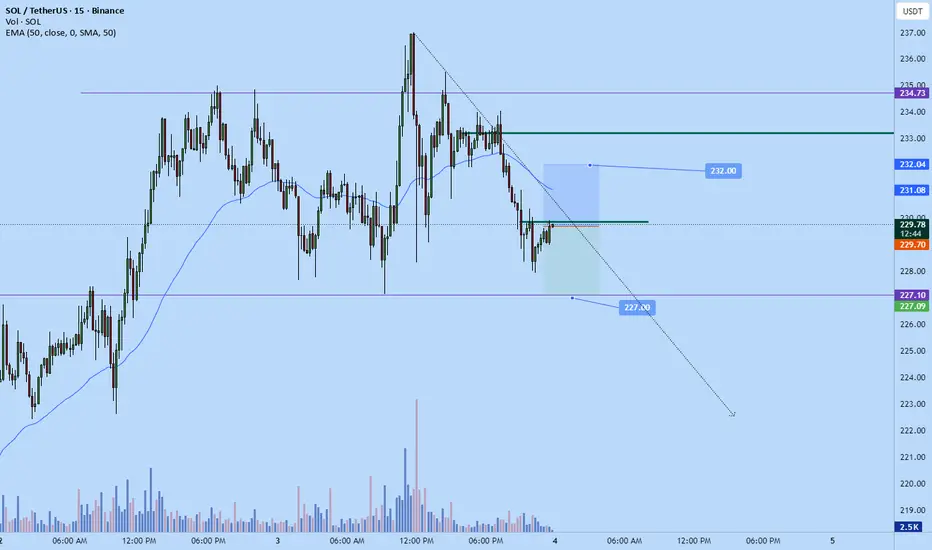
Sol scalp shortJust went short on sol
Scalping to $227
1:1
Sl: 232
Market correcting on daily tf. Likely will push down to $227 before any continuation back up
Solana long to $253.5Solana long to $253.5
Sl: 225.7
Tp: 253.5
Anticipating trend continuation back to the highs soon
