The Next Explosion, Hidden Clues in Price BehaviorCan you really feel the next Bitcoin explosion just by reading the charts?
The market looks calm, but deep down something big is shifting.
When everyone expects a crash, history shows that’s when the biggest moves begin.
Hello✌️
Spend 2 minutes ⏰ reading this educational material.
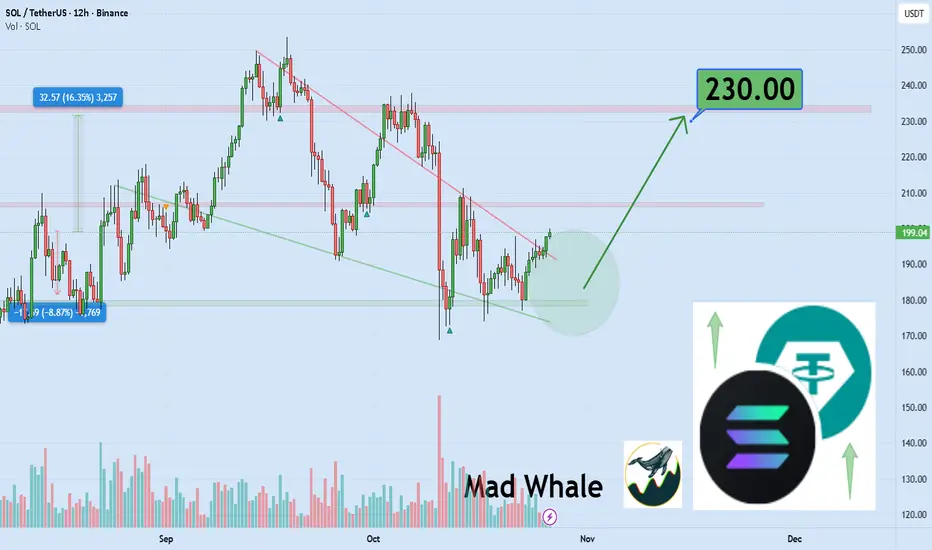
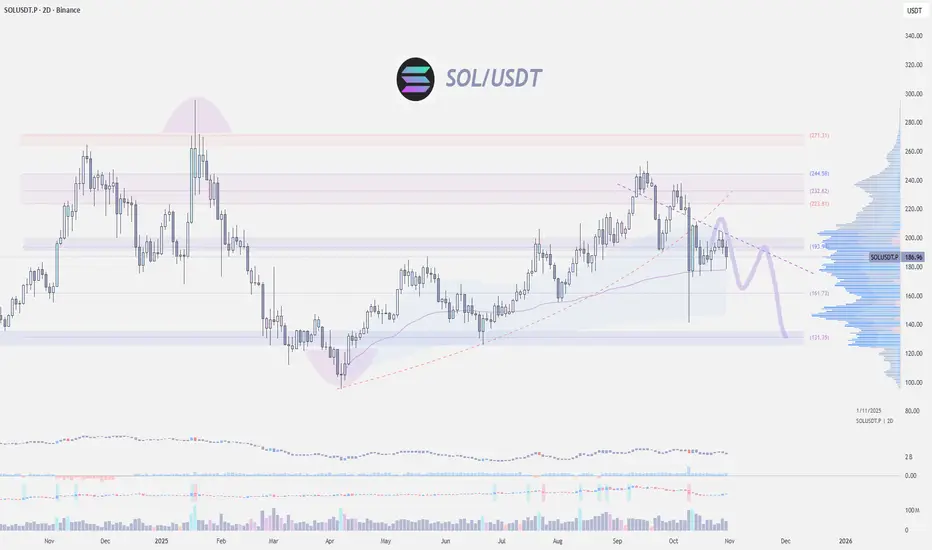
🎯 Analytical Insight on Solana:
BINANCE:SOLUSDT is testing a key daily support; holding this zone could spark a 16% rally, targeting $230. 📈🛡️
Now , let's dive into the educational section,
🌋 The Calm Before the Storm
The crypto market is like the ocean before a tsunami quiet but full of hidden energy. On higher timeframes, candles look small and boring, yet trading volume is rising. That mix of silence on the surface and pressure underneath is exactly what happens before every strong bull run.
💡 Hidden Clues in Price Behavior
Bitcoin’s price has been building quiet support for weeks, while big transactions are slowly increasing in the background. This usually means that smart investors are buying without drawing attention. Rising volume with little price movement is often the first signal that accumulation has started.
🚀 Bitcoin The Engine of the Next Explosion
In every cycle, Bitcoin moves first. Breaking major resistance levels and holding above them is a sign of growing confidence. When Bitcoin dominance starts to drop and altcoin volume goes up at the same time, that’s when the whole crypto market gets ready for a collective takeoff.
🧠 Trader Psychology During Market Silence
Most traders fear a quiet market, but experienced ones see it as the best setup. When the media talks about stagnation and panic, the big players are quietly building long positions. The difference between average and professional traders is simple: one sees silence as danger, the other as opportunity.
🔍 The Path to Spotting the Next Big Move
To catch the move early, start with volume. When volume rises at support levels without breaking previous lows, it usually means smart money is buying. A positive divergence between price and RSI often appears right before momentum flips. Then watch for a bullish MACD cross on the daily chart when all three signals align, the explosion is close.
⚙️ TradingView Tools That Reveal Market Explosions
TradingView offers powerful tools that can help you detect big moves before they happen.
1. Volume Profile
Shows where most buying and selling happened. Heavy zones are usually where whales make their decisions.
2. MACD
Reveals when market momentum is changing direction. A bullish cross in the negative zone often signals the start of a reversal.
3. RSI
Measures the strength of buyers versus sellers. When RSI breaks above 50, a new bullish phase is often beginning.
4. Alert System
Highly underrated! Set alerts for your favorite indicators so when they align, you get notified instantly.
5. Multi-Timeframe Analysis
Use multiple timeframes to avoid fake signals. Comparing daily and 4-hour charts gives a much clearer picture of big moves.
⚡ Summary
All signs point to a massive move ahead. Bitcoin’s calmness is deceiving, but the data doesn’t lie. Stay patient, follow your signals, and you might witness one of the strongest uptrends in years.
🧭Golden Tips for Smart Traders
Patience beats excitement. The biggest profits go to those who wait for confirmation, not those who rush in
Ignore the crowd’s emotions. When the mood is darkest, opportunities are often the brightest.
Trust the chart, not your fear. The market always tells the truth if you take the time to listen.
✨ Need a little love!
We pour love into every post your support keeps us inspired! 💛 Don’t be shy, we’d love to hear from you on comments. Big thanks, Mad Whale 🐋
📜Please make sure to do your own research before investing, and review the disclaimer provided at the end of each post.
Trade ideas
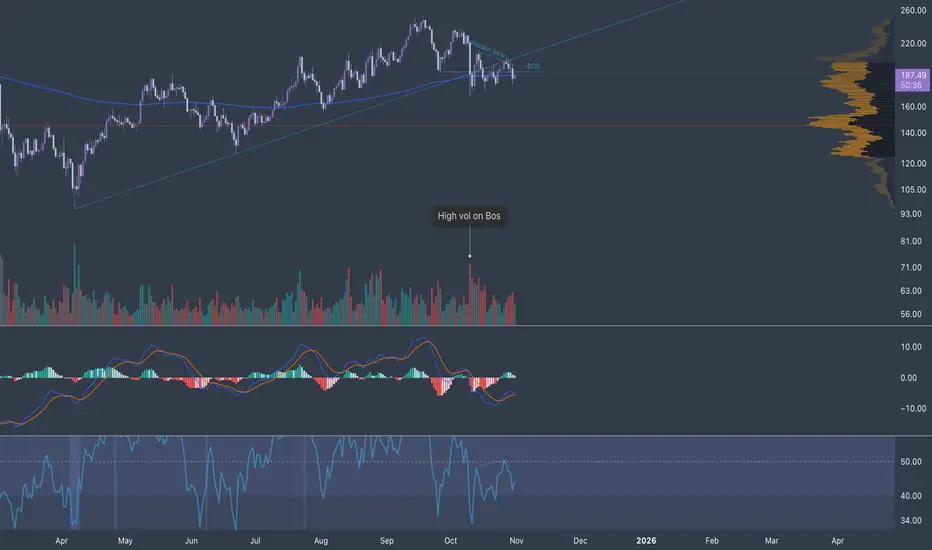
Sol looking weakAs you can see sol broke the trend line and has retested. BOS with large sell volume. Hidden bear div locked in on the retest. Has closed below the 200 ema on the daily. Unless we start reclaiming levels, we're going lower.
Solana, more down side to see? SOLUSDT / 1D
Hello Traders, welcome back to another market breakdown.
SOLANA is currently trading within a down trend, maintaining a bearish structure. I'll be looking for a short pull-back higher to get a position.
If the pullback holds and sell mode confirms, the next leg higher could target new lows.
Stay disciplined, wait for the market to come to you, and trade with confidence!
Trade safely,
Trader Leo.


Sol Next StepsBINANCE:SOLUSDT SOL is expected to retrace from $195 toward $175–160, possibly dipping into the $140–150 weekly buy zone before reversing. The chart outlines a bearish correction within a larger bullish structure, targeting $213–222 then $240+. SMA confluence and liquidity zones support a mid-term accumulation before breakout.

SOL at Support, History Could Repeat$SOL/USDT Analysis
SOL continues to respect its long-term rising support line beautifully. Each time it has accumulated around this trendline, we’ve seen a strong rally follow, and the same pattern seems to be forming again.
Right now, SOL is in another accumulation phase, holding well above the key support zone. If history repeats itself and the price sustains this level, we could see another explosive move toward new highs.
DYOR, NFA
Thanks for reading! Appreciate your support and engagement 🙏

SOL: One More High… or Goodbye?The Solana bull run that started in December 2022 most likely finished in January 2025. It was a textbook five-wave impulse (extended iii, with i ≈ v). From Jan → Apr 2025 we saw the first leg down (A), and the rally Apr → Sep was merely a corrective (B) move; base case is C down toward $80–50. An alternative allows for one more pop within B (even a small over-throw), but downside resumes after.
Full cycle & proportions
Dec ’22 → Jan ’25: clean 1–2–3–4–5.
Wave 3 shows a classic extension.
Waves 1 and 5 are nearly equal in length.
The run from the bottom is roughly 30–35× (about +3,000%), which statistically argues for a meaningful mid-term correction.
Base correction targets from the whole impulse: 0.382–0.5 Fib → $80–50, aligning with monthly/quarterly imbalances (FVG).
What 2025 looked like
Jan → Apr: first downward leg — wave A.
Apr → Sep 18 (high ~$253): a double zigzag W–X–Y — typical wave B, not a new trend.
Alternative (expanded flat, EFL)
A: Jan → Apr 7 down.
B: Apr → Sep as (A); now forming (B); then (C) up (a minor higher high is possible).
After that, a larger C down into $80–50.
Why I think the rally is done (market context)
TOTAL and BTC likely trace end-phase bull structures (distribution/terminal patterns).
Volume profile on COINBASE:SOLUSD : the heaviest trading sits around $120–200 (HVN/POC) — classic distribution; price often moves below POC afterwards.
Price Action (weekly/monthly): $216–260 is a major resistance that launched the bear market back in Nov 2021. Repeated tests without a weekly/monthly hold above it argue against an immediate breakout.
Fundamentals in two lines
Why a correction now: cycle overextension, liquidity saturation near the top, sensitivity to DXY/real yields and risk-off in US indices.
Why the long-term case survives: high throughput, latency improvements (e.g., Firedancer), growing DeFi/stablecoin/consumer activity. After leverage clears, BINANCE:SOLUSDT historically recovers with high beta.
Levels & invalidation
Base (correction) holds until we get a weekly close > $260–270.
Downside waypoints: $150 → $120 → $95 → $80–50.
Invalidation: sustained hold above $270 with expanding volume — I’d concede an early start of (3) without a deep (2).
Bottom line. With high probability, SOL’s medium-term rally is over; we are in a corrective phase targeting $80–50. The long-term bullish story can resume later — but first the market likely needs to deflate.


SolanaPrice of Solana has formed a bullish triangle. A classic target would be at around $400. But if it's alseason now like on ZCash then the target should be way higher.

#SOL/USDT The Next Explosion, Hidden Clues in Price Behavior
#SOL
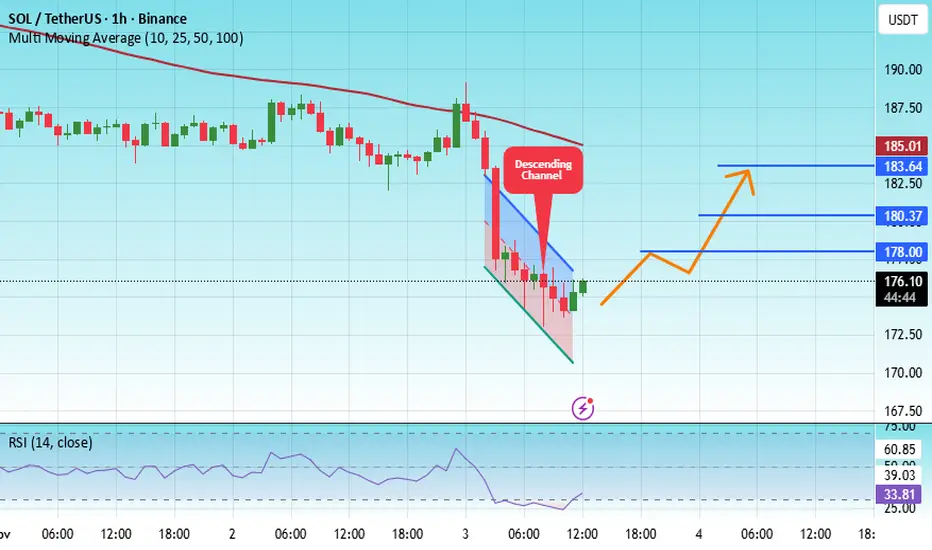
The price is moving within an ascending channel on the 1-hour timeframe and is adhering to it well. It is poised to break out strongly and retest the channel.
We have a downtrend line on the RSI indicator that is about to break and retest, which supports the upward move.
There is a key support zone in green at 172.80, representing a strong support point.
We have a trend to stabilize above the 100-period moving average.
Entry price: 175.50
First target: 178
Second target: 180
Third target: 183
Don't forget a simple money management rule:
Place your stop-loss order below the support zone in green.
Once the first target is reached, save some money and then change your stop-loss order to an entry order.
For any questions, please leave a comment.
Thank you.
Why SOL is my bet for the next leg of the cycle Where some people are afraid and selling, others see an opportunity. Moments like this allow us to accumulate spot positions at good prices. They also help identify obvious market leaders — those who hold stronger than others. Today I will explain why, after analyzing the market, I came to the conclusion that SOL currently looks stronger than Bitcoin and why I’m placing my bet on it.
Last week there were days when SOL dropped less in percentage than BTC. Which is basically nonsense for crypto.
➡️ This is primarily related to the newly launched SOL ETF, which has seen inflows from the very first days. And, you know, this is actually the most successful start for a crypto ETF. Because BTC and ETH saw only outflows during the first weeks.
➡️ What we see on the chart: first — yes, a liquidity divergence on the Money Flow has formed. But this is not a secret to anyone, liquidity really leaves the market during such periods and starts returning closer to the bottom.
➡️ Next — the drop was extremely uneven. Despite the lack of major selling volumes, there are a lot of rumors about liquidations and market makers exiting the market, which in turn removed liquidity and now the price moves 10% per day.
➡️ Also, we see harmony in the selling volumes throughout the entire correction. This means the correction is not near its end and sellers are still in control. But no one said SOL will rocket tomorrow.
The first thing to look at — where the price may potentially reverse. And the first of such levels is $147. This is a key level of one of the ATHs of the current cycle, which later became an important support level.
Below that, there is an order block on the daily timeframe at $135–132. This is where the new impulsive move started back in April this year, therefore the level is important.
➡️ The Supply & Demand indicator shows that major demand has formed around $154–146, confirming the first target where a reaction may occur.
I expect Bitcoin to at least retest $99,000 before showing any meaningful bounce. Therefore, the current target levels for SOL look logical.
Drop a comment if you’re still alive in this market! 👇

sOL-USDTSolana could still break its resistance at $197 and make a new leg towards $209.
Watch for longs

Solana’s pause after the causeHi friends!
How are you doing after the recent Bitcoin–Solana drop?
I hope you didn’t lose anything — and maybe even managed to make some profit instead! 💪
📉 My next targets on the downside are around $144 and $124, but at the moment, Solana seems to be taking a breather from the fall.
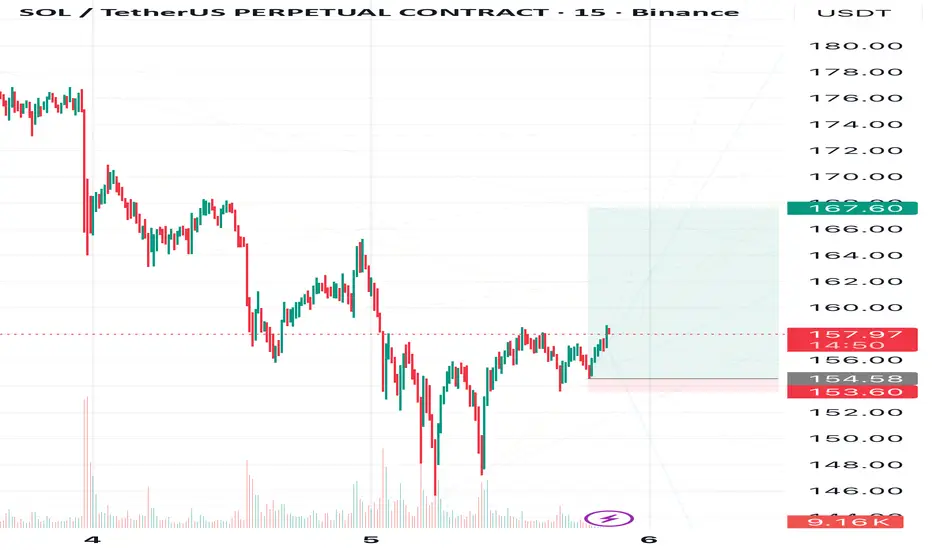
After a long and deep decline, even below my earlier expectations, Solana is finally showing some signs of a small correction to 167,60 📈
🎯Target - 167,60
❌Invalidation zone are marked on the chart - 153,60
💬 What do you think — is this the start of a reversal, or just a short pause before another move down? Share your thoughts in the comments. I always enjoy reading your views!
🔔 Follow me to stay updated on Solana and other crypto market analyses.
Solana at a Make-or-Break LevelSolana couldn’t sustain momentum above $200 and now holding the critical level $170.
CRYPTOCAP:SOL is sitting at a make-or-break level — failure to reclaim the $200 zone or a clean break below $170 would be a concerning signal for bulls.
A decisive breakdown below this area could trigger a deeper retracement toward $150, with the worst-case scenario being a full retest of the $130 range — aligning with the previous demand zone and high-volume node.
SOL-USDTWith these Bitcoin drops, Solana also broke the $175 level and reached its key support at $155 🔽📉
These levels of 155 and 141 are important short-term supports, not important medium-term supports ⭕️💰
Maintaining these supports could push Solana towards resistances of $175 and then $185

SOL/USDT Update — Bullish Trend Structure and Resistance Ahead“🚨 Solana vs Tether: Bullish Heist on SOL/USDT 💰”
📊 Description
Market: SOL/USDT
Bias: Bullish (Swing / Day Trade)
✅ Trade Plan
Entry: 🎯 Any good support / demand area — stay alert & flexible.
Stop Loss: 🛡️ “Thief SL” @ 160.00 USDT — this is my SL, not yours. Manage your own risk!
Targets (TP):
• 🎯 Target 1: 215.00 USDT
• 🏁 Target 2: 240.00 USDT
⚠️ Heads up: Use your discretion. Do not blindly follow my SL/TP — trade responsibly, at your own risk.
🔍 Key Insights / Logic
🚧 Expect resistance & traps near 215–240 — don’t get stuck in overbought zones.
📈 Momentum is building; structure is favorable on retests.
🔊 Watch volume on impulsive moves — rising volume = strength.
🔄 Related pairs / correlation watch:
• BINANCE:SOLBTC — strength vs BTC strengthens the bullish case.
• BINANCE:ETHUSDT — altcoin momentum may carry SOL upward.
• BINANCE:BNBUSDT — BNB strength can support ecosystem flow.
✨ “If you find value in my analysis, a 👍 and 🚀 boost is much appreciated — it helps me share more setups with the community!”
#SOL #SOLUSDT #Solana #CryptoSwing #CryptoDayTrade #AltcoinAnalysis #TradingViewIdeas #CryptoFun

sol-usdtIt has had a good rise from its well-known support at $175.
For this rise to continue towards $197, the $190 level needs to be broken to activate the $197 to $200 target 📈
Solana's short-term supports are $183 and then the $175 floor.


#SOLANA Bear Market Hello everyone, I hope you're all doing well.
This is my prediction for the price of Solana in the coming weeks and months. I previously shared this idea when the price was $16, and I predicted it would rise to the top. Take a look below
This is not investment advice; please take full responsibility for your buying and selling decisions.
Warning: Be careful not to use this idea with leverage, as you could lose all your money

SOL-USDTAnd again reaching the bottom of $175
If the consolidation candle closes above this level again 💰💰
The price will have the ability to return to $200
To enter the long, confirmation and consolidation must occur

SOL (4-HOUR): TRIANGLE breakout, RETESTED, UPTRENDCRYPTOCAP:SOL zoomed in on the 4-HOUR chart is looking much better than most major cryptos. In an UPTREND after a TRIANGLE #Breakout and with a HIGHER LOW on the pattern's upper trendline.
Once again, lots of SUPPORT below, all kinds of it. It's ready to start a new cycle upwards, no ELLIOT WAVE count yet though, but the correction seems to be complete.
Obviously, a lot depends on CRYPTOCAP:BTC , so hopefully no dip below the 200 MA there. There could be a potential flash-crash in the market, so my STOP loss is manual, using candle closes (below $170) rather than a set level.
My targets will be based on ELLIOT WAVES once a solid count appears, but for now, I'm watching these levels: $206 (rejection here again could be brutal, and breakout above a volatile one), $234 (TRIANGLE target), and the zone between $254 and $264.
We’ll see how it goes — easy with the stakes, lots of chaos in the markets, no PCE numbers today due to the GOVERNMENT #shutdown in the US.
💙👽

$SOL (4-HOUR): LONG $187, reasoning. CRYPTOCAP:SOL has had $154M in #ETF inflows this week, not bad for the first few days on the market. But this is not a reason for a LONG ($187) I have just opened.
The original plan was to LONG the $205 breakout for a while, but a HIDDEN BEARISH RSI divergence flashed and the $205 resistance got retested, printing a LOWER HIGH again, and the price dipped to retest the 200 MA + the ascending trendline (confluence of SUPPORT).
It was the 4th retest this month and it has been solid, each time giving us a HIGHER LOW as well.
I highlighted in light-blue also a horizontal SUPPORT ZONE and #solana has been sitting inside of it, so there is plenty of support of all kinds, including a GOLDEN POCKET ($172 - $176).
A sequence of 2 HIDDEN BULLISH OBV divergences triggered this LONG at the end.
And below the pocket is where I would EXIT this trade — 2 or 3 candle closes (4-hour ones, not the daily ones) and I'm out.
I also highlighted an interesting fractal of price action: notice the Q4 2024 resemblance to the current behaviour — DOWNTREND toward the same horizontal support ZONE supported by the 200 MA, followed by a huge SURGE.
This is quite a risky trade due to the general market circumstances, and I will monitor the reaction very closely around $200 again, and possibly add to size on a BREAKOUT as originally intended.
💙👽
#long

$SOL (DAILY): LON $187 (STOP LOSS: below $170)Longing CRYPTOCAP:SOL here at $187.
Reasoning within 30 minutes in the next post.
Modest stake, SL: two 4-hour candles below $170.
💙👽
