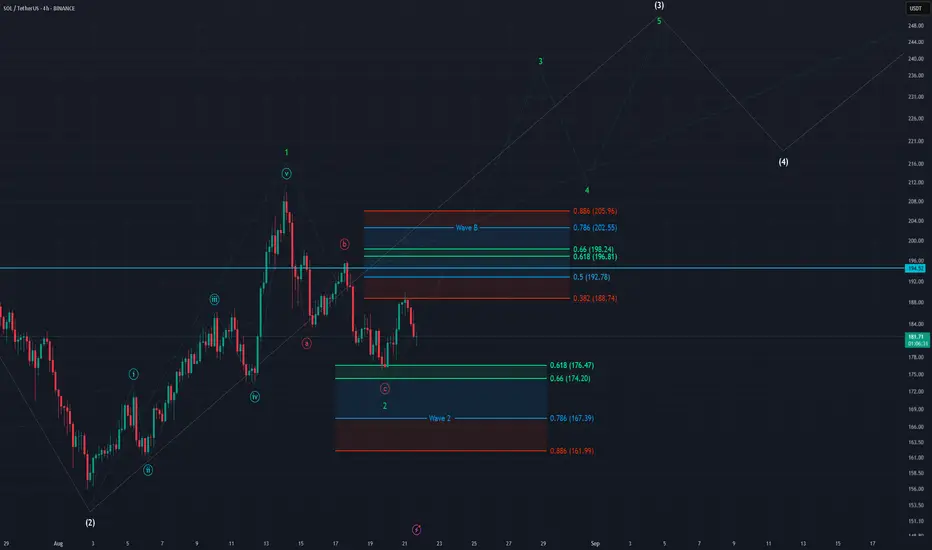
SOL - 4H Elliott Wave Analysis - 21.08.25Greetings, Solana is still holding strong and looking strong.
We assume the move up from the 3rd of August was an impulse displayed as green 5 wave move of which we finished Wave 1 and potentially Wave 2 as a red ABC.
We have two scenarios moving forward as the price action on the lower timeframes doesn't give us enough clarity to say which one is preferred. In either case we want to hold the Wave 2 support area which goes down to the 0.886 FIB At 161.99 USD.
Case 1:
Green Wave 2 is already finished in the red ABC and we are looking for an impulsive move to the upside in the 3rd Wave which should take us above 230 USD. Be aware that this 3rd Wave should happen quiet fast and aggressively.
Case 2:
The move down in the red ABC was only the Wave A of an extended correction.
The Wave B resistance area is between the 0.382 FIB at 188.74 USD and the 0.886 FIB at 205.96 USD. Be aware that we touched the 0.382 FIB which means the B wave could be in but we think the B wave isn't in yet because it would be a very shallow B which doesn't fit Solana's recent strong performance. We think a higher B wave is more likely.
As said we can't distinguish well between the two scenarios due missing price action on the lower timeframe. We hope to get more clarity soon. We also want to communicate a back up scenario in case we break the support area in which we would assume that we get a reset of the white Wave 2 in expanding flat meaning the green Wave 1 was an overshooting B Wave.
Thanks for reading.
NO FINANCIAL ADVICE.
Trade ideas
SOLANA (SOL) — Why the Bullish Case Still Looks Strong into FallFundamentals & Flow
Scale + Throughput narrative is alive: Recent CMC Academy roundup highlights Solana clocking 100K+ TPS in testing and continued ecosystem momentum. That throughput + UX keeps SOL near the top of L1 mindshare.
DeFi is back on SOL: CMC reports TVL growth >600% YoY, with TVL pushing back above the $10–11B area in 2025 updates—evidence that liquidity and yield strategies are returning to the chain.
Institutional interest: 2025 has seen notable institutional inflows >$1B into SOL-linked products and even direct corporate buys (e.g., $22M SOL purchase by DeFi Development Corp.). These are the kind of flows that extend cycles
Lingrid | SOLUSDT Pullback Trading Opportunity To BuyThe price perfectly fulfilled my previous idea . BINANCE:SOLUSDT is rebounding from the support level and consolidating near the upward channel, showing strong bullish potential. Price structure highlights an upward channel with higher highs and higher lows while testing both a triangle pattern and downward trendline resistance. If the price holds above the $175.00 support zone and breaks the downward trendline, a push toward $206 is expected. The broader context shows bullish momentum, with the structure favoring continuation toward the $220 resistance area if momentum sustains.
📉 Key Levels:
Buy trigger: Break above the downward trendline near $190
Buy zone: $175.00 support retest and upward channel base
Target: $206 and potentially $220 resistance zone
Invalidation: A breakdown below $170.00 support
💡 Risks:
Failure to hold above $175.00 support could extend downside pressure.
Broader macro risks (USD strength, Fed policy shifts) may weigh on crypto sentiment.
Potential false breakout of the downward trendline could trap late buyers.
If this idea resonates with you or you have your own opinion, traders, hit the comments. I’m excited to read your thoughts!

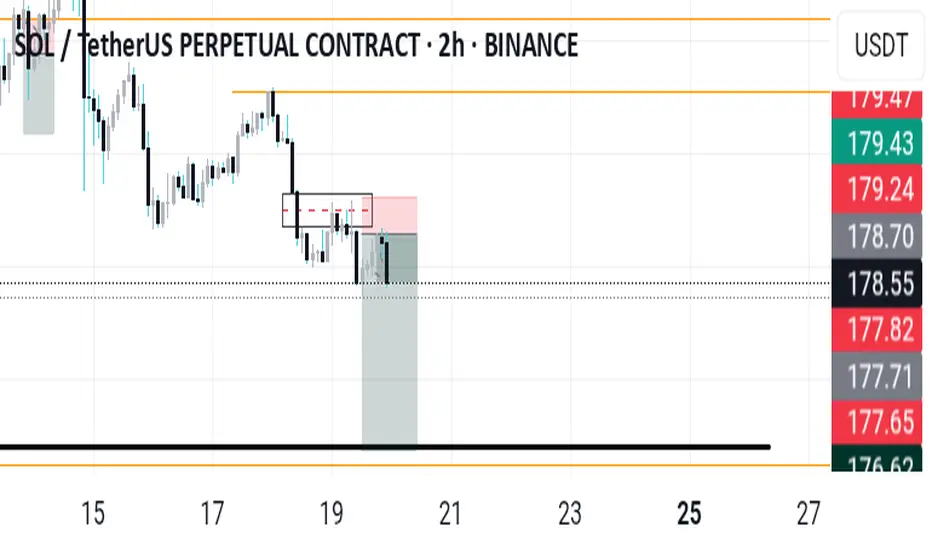
SOL LONG TRADE SETUPSOL-USDT
SHORT
Entry: 188.39 OR CMP
Target: TP1: 185.33, TP2: 182.23, TP3: 179.30, TP4: 176.08
Stoploss: 196.03
Leverage: 2X
Technical Analysis: SOL/USDT is currently facing strong resistance. There is a high probability of a short-term downward move.

Solana Reclaims $162 Support as Bulls Eye $252Solana has reclaimed the $162 support level with multiple weekly candle closes above it, signaling market acceptance. The next target lies at $252, with the broader structure remaining firmly bullish.
Solana has shown renewed strength in recent weeks after reclaiming the $162 level, a major high-time frame support zone. Price has now confirmed multiple weekly closes above this level, a strong sign of market acceptance and structural integrity. This reclaim not only validates $162 as a pivotal area but also sets the stage for further continuation in the broader bullish cycle.
The weekly chart for Solana highlights consistent higher highs and higher lows, a textbook signal of bullish momentum. Each pullback has been met with demand, and as long as $162 holds on future retests, the broader structure remains intact. Even if the market consolidates or dips into this region again, the level is expected to act as a strong base for the next wave higher.
Key Technical Points:
- $162 Support: Reclaimed with multiple weekly closes, confirming structural strength.
- Value Area High Resistance: Currently capping price; a breakout opens the door to higher levels.
- Upside Target at $252: Major resistance zone and the next key projection for bulls.
From a technical perspective, Solana is already demonstrating clear signs of demand. The value area high, which is being respected with precision, stands as the next barrier for price. Once this resistance is reclaimed, the probability of a rotation toward $252 becomes high. Such a move would not only represent significant upside but also further confirm Solana’s bullish standing among major altcoins.
The importance of the $162 support lies in its history as a strong pivot point. Previously a contested zone, the successful reclaim and acceptance above it transforms this level into a launchpad for further growth. This is a common characteristic of high-time frame supports, where a prior barrier turns into a foundation once retaken.
Volume analysis also supports the bullish bias. Increased participation has accompanied Solana’s defense of $162, with accumulation showing up in recent weeks. Sustained buying interest at higher levels often signals market confidence, providing a strong backdrop for potential expansions.
What to Expect in the Coming Price Action
Solana remains structurally bullish as long as $162 continues to hold on weekly closes. Consolidation above this level may extend in the short term, but each higher low builds pressure for the next breakout. If the value area high is breached, $252 becomes the immediate target, representing the next stage of the bullish projection. For now, Solana’s reclaim of $162 marks a critical technical win that positions the asset for further upside in the weeks and months ahead.

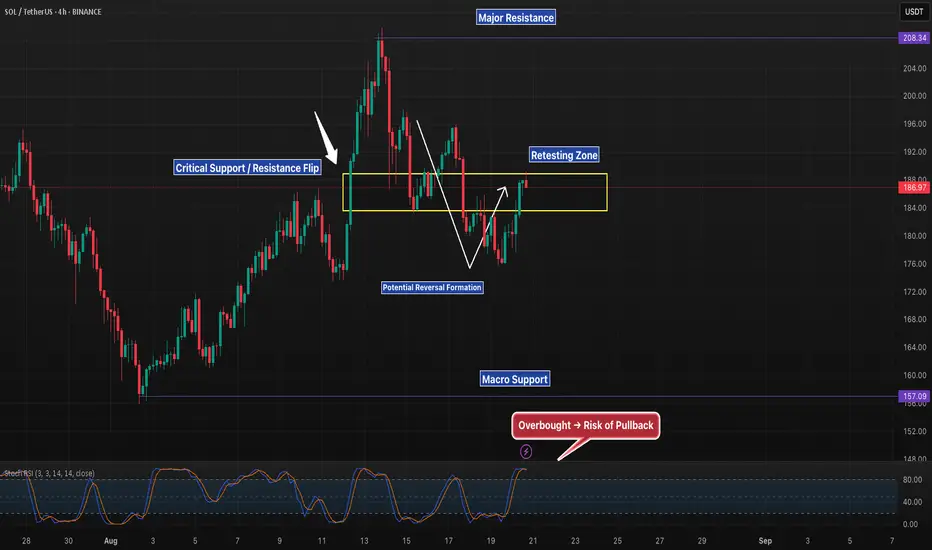
SOL 4H – Support Flip or Fakeout, What’s Next?Solana has rebounded strongly from the 178–185 support zone, reclaiming the level that previously acted as resistance. Price is now retesting the zone, making this a key decision point.
Support / Resistance Flip: Holding above 185–178 could confirm a bullish reversal.
Upside Target: If bulls hold, next test is the 208 resistance.
Downside Risk: Rejection here could trap buyers and send price back toward 157 support.
Momentum: Stoch RSI is heavily overbought, suggesting caution on chasing upside.
The next sessions will reveal whether SOL can confirm this support flip, or if it’s just a fakeout before deeper downside.
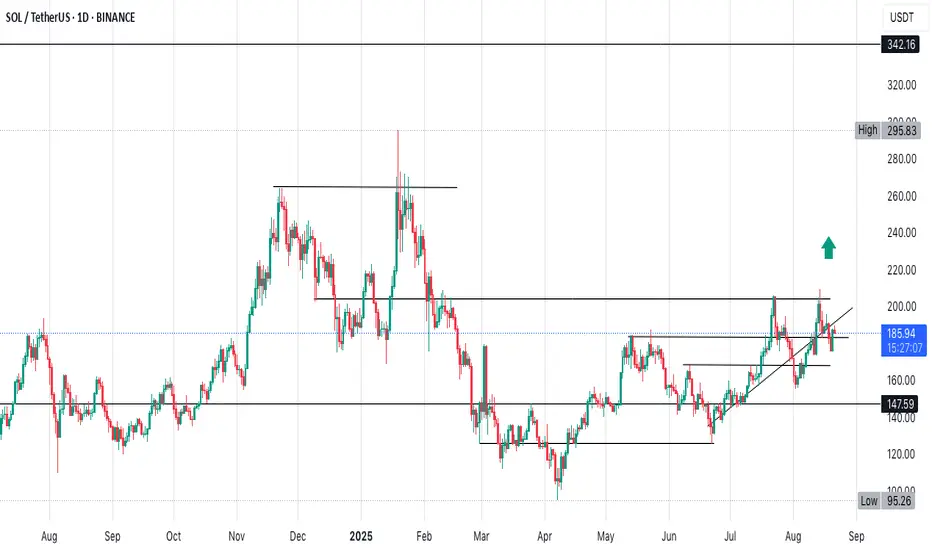
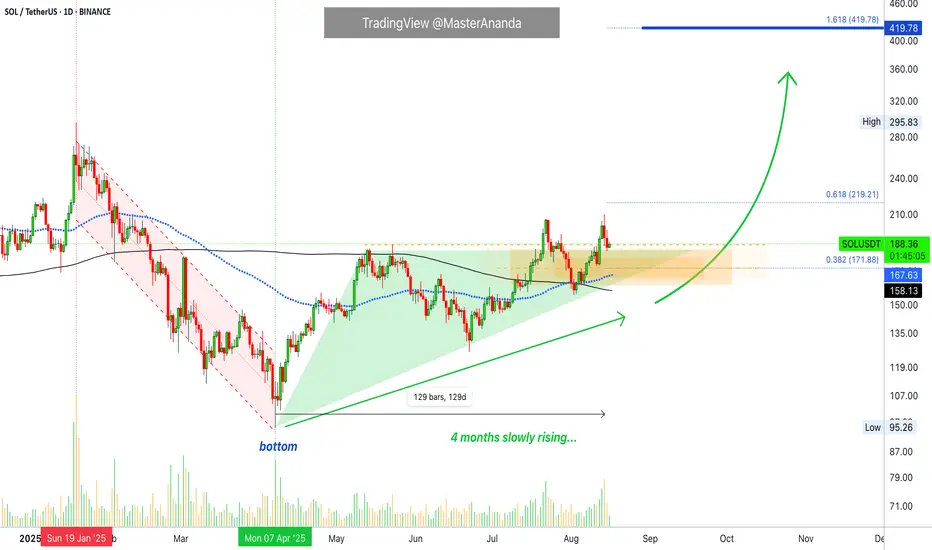
Solana Bullish · Long-Term Growth ConfirmedAfter the market bottom in April Solana has been rising slowly for four months.
Look at this chart here. I am keeping it very simple because I believe simple is best. Where is Solana at now? What happens next?
Solana is trading safely above EMA89 and MA200, notice the dynamics on the chart. These levels were first conquered as resistance back in July and by the 2nd of August these levels were being tested as support, they both held.
SOLUSDT is trading safely above these levels and also a price of $172 which is the 0.382 Fib. extension of the current wave. This is an important zone and the action is happening safely above it.
Solana has room to move around, wiggle around. This is what happens as prices grow. There can be stops and retraces but this does not mean that the rise is over, there is always more.
Solana just conquered the EMA89/MA200 duo-resistance recently, we have not yet seen what is possible now that the trading is happening on the bullish zone. We are due a major advance... The market is consolidating, building up strength to be able to grow long-term.
Namaste.
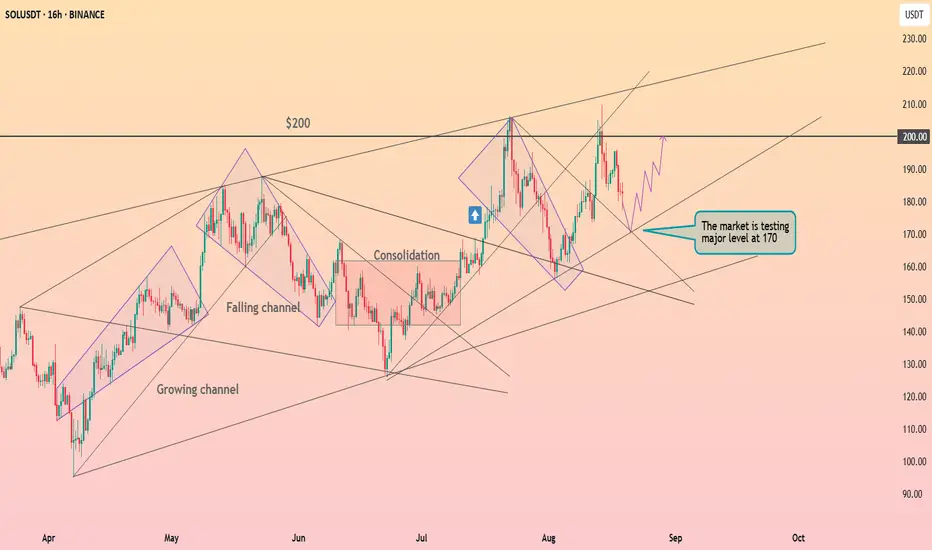
Solana above the strong support ┆ HolderStatBINANCE:SOLUSDT is currently testing $170, just beneath major resistance at $200. Breakout confirmation could open path to new highs, while rejection risks pullback to $150 support. Consolidations suggest momentum is building for another significant move.
Market CorrectionThere would be a crypto market correction starting 24-25 August and continuing until 2-3 September.
You would see a 10-15% drop for middle and large-cap Altcoin, and Bitcoin might retest the 108-109k level.
Let's see if my prediction comes true!
#crypto
#cryptomarket
#cryptomarketprediction

SOLUSDT 4H✅ SOL/USDT — 4H (Binance) | Aug 20, 2025 — Professional Technical Read
🔎 Chart context
• Structure is broadly bullish since early Aug, but the last leg printed a lower high → pullback into a 4H demand/FVG block.
• Price now ~180.7 inside that block. Two paths are drawn on your chart: a reaccumulation → breakout to 210 or a loss of demand → sweep 158.
📍 Key levels (approx.)
• Supply / liquidity above: 200–210 (major liquidity line marked 210.00).
• Decision block (current): ~175–183 (4H demand/FVG; prior breakout origin).
• Pivot / CH reference: ~194–196 (CH 4H label — reclaim turns momentum cleanly bullish again).
• Support below: ~158 (tagged on chart), then 150–145 (deeper old base).
🧭 Market structure & liquidity map
• After the CH 4H and rally to the recent peak, price created a higher low around ~165–168, then a spike to ~205, and is now mitigating the 175–183 block.
• Wicks show responsive buyers at the upper edge of the block, but the midline is soft; a clean close below ~175 likely exposes the resting liquidity at 158.
• Above, buy‑side liquidity sits over 200 with a cluster around 209–210 (equal‑highs feel).
📈 Bullish continuation (probable if 175–183 holds)
Conditions:
• Hold 175–183 with a 4H HL and impulsive reclaim of ~188–190, then CH area ~195.
Path & targets:
1. Trigger reclaim: 188–190 → momentum confirmation above 195 (CH 4H).
2. TP1: 198–200 (partial).
3. TP2: 205–206 (prior swing).
4. TP3: 209–210 (liquidity sweep).
Invalidation: a 4H close below 175.
📉 Bearish continuation (activated on loss of demand)
Conditions:
• 4H close below 175 or failed bounce capped under 188–190.
Path & targets:
1. Pullback/failed retest into 182–186 (sell zone).
2. TP1: 168–166 (intermediate shelf).
3. TP2 (main): 158 sweep (your downside tag).
4. Extension (if momentum persists): 150–145 mitigation.
Invalidation: sustained reclaim >195.
🎯 Trade plans (system‑agnostic

SOL 4H Golden Pocket Retest, Bounce or Breakdown?Solana is pulling back into a major confluence zone. Price sits at the 0.618 Fibonacci retracement ($176) while also testing a clean rising trendline. The Stoch RSI is oversold, giving buyers an opportunity to defend.
A bounce and reclaim of $182 would confirm bullish continuation toward $196–212.
A breakdown under $176 opens the door to a 0.786 retest near $167.
This zone is critical — holding here keeps structure intact, but failure could flip the trend short-term.


SOL LONG : Double Bottom @ $155Crypto markets in red this week. SOL failed to break above 200 finitely.
Next zone to watch is demand area around $155. Bulls need to defend this if bullish market conditions should prevail

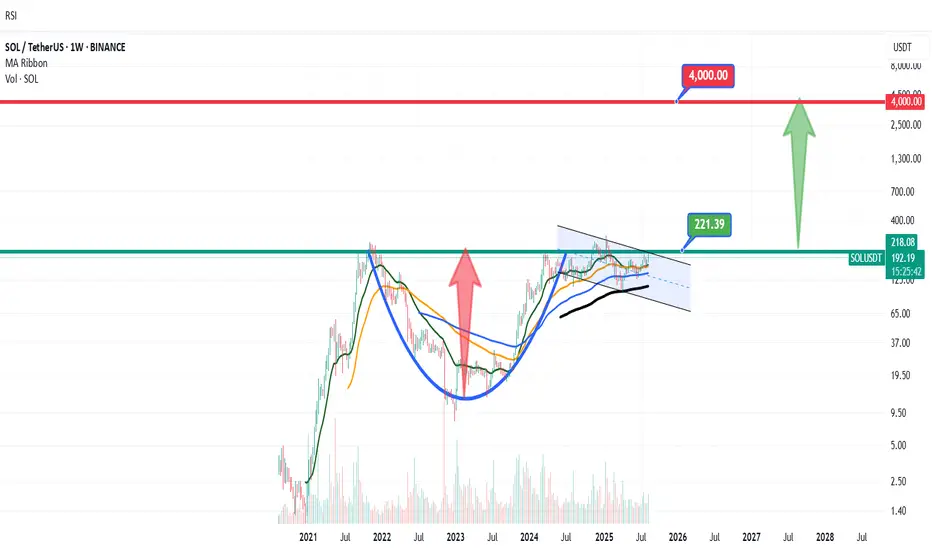
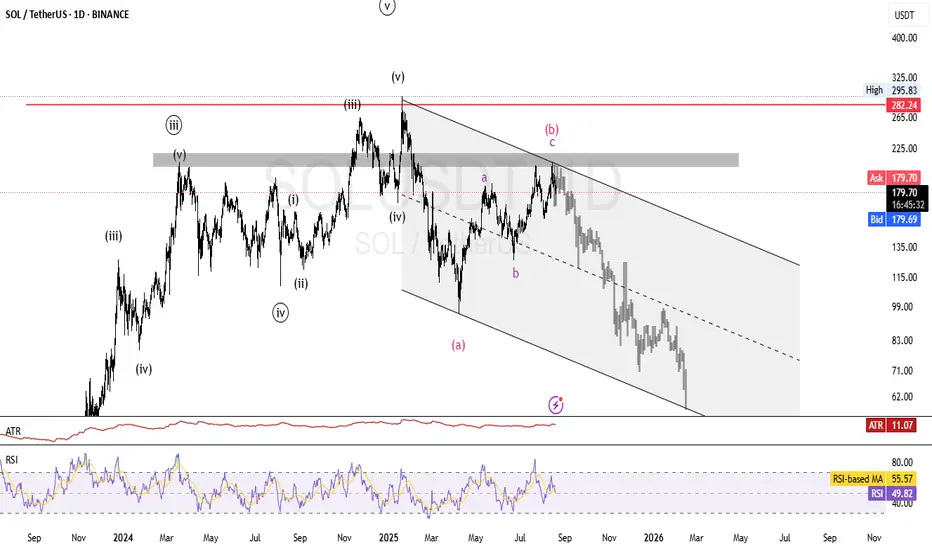
#SOLUSDT_WSolana is likely to see targets of $322 and $618 on the weekly timeframe and in the continuation of the wave (V) movement.

Weekly trading plan for SolanaA clear bullish divergence is visible on the 1H RSI. The price has already reacted from the first support level and is attempting a reversal. The key level for this week is 191 .
If the weekly pivot point is successfully broken, we could see growth with a new high and a target at 227 . If the price fails to hold above 191 , there’s a high probability of a drop back to the monthly pivot point.
It’s also important not to break below 171 , otherwise the price could set a new local low and reach 155 .

SOLUSDT: Elliot waves Analysis Hello. As you can see in the Solana chart, the analysis is based on Elliott waves in the long term. This is only a perspective and cannot be the basis for trading, but it seems that after reaching the deadline area, we can expect a continuation of the correction for wave C. So keep this perspective in mind, as it is possible.
SOLUSDT Breaks Resistance – Targeting 230–240 RangeSOLUSDT has broken above a key resistance zone after a strong bullish impulse from the demand zone around 170. Price action has confirmed a BOS (Break of Structure) and is retesting near the weak high area. If bullish momentum continues, the next potential targets lie near 230 and 240, aligning with the upper trendline of the upward channel.
Key levels to watch:
Support: 170–180 (Demand zone)
Resistance: 210, 230, 240
A sustained move above 210 could open the path for further upside. Failure to hold above 200 may lead to a retest of the demand zone.
This is an educational idea, not financial advice.

Solana seeks to rebound ┆ HolderStatKUCOIN:SOLUSDT on the 6h chart broke through the $150 key level, then extended to 210 before correcting. The market is now testing 172.60 support. If buyers defend this level, upside targets at 190–200 remain valid.

SOL/ETHSOL/ETH
ETH has ran - SOL is consolidating under 200$ for a while now.
Guide for us to monitor.

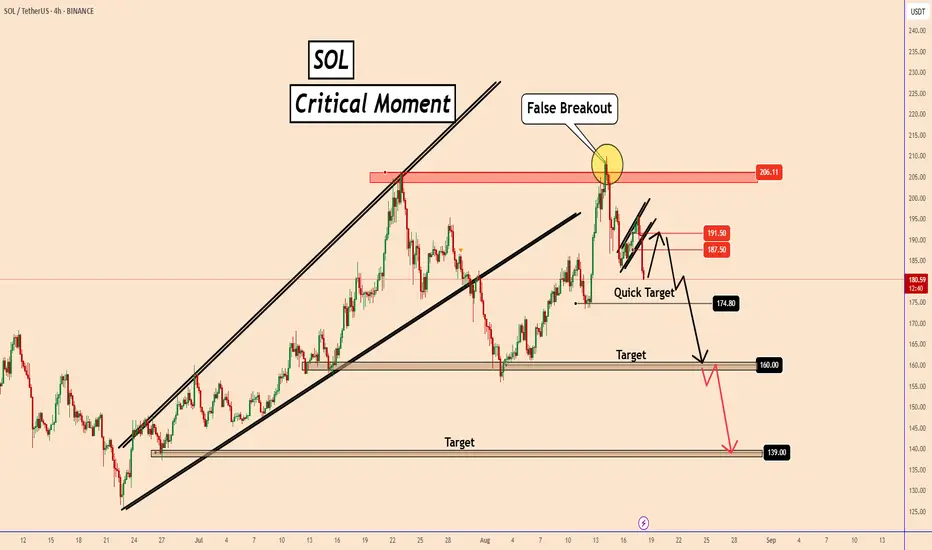
Solana’s False Breakout: Is the Rally Over?Solana’s False Breakout: Is the Rally Over?
On August 14, Solana tried to break above its previous high, but the move turned out to be a false breakout. The price quickly dropped to 180.80 within just three days.
It seems the bullish momentum is fading for now.
I believe the most Solana might do is retest the 187.50–191.50 zone before heading lower.
Based on the chart, the next support levels are around 174.80 and 160.
There's a chance it could fall even further, but that third target is more of a long-term scenario and will need to be reassessed in the coming days.
You may find more details in the chart!
Thank you and Good Luck!
PS: Please support with a like or comment if you find this analysis useful for your trading day
SOl BullishSolana (SOL) is showing strong bullish momentum against USDT, with price action forming higher highs and higher lows. Increased trading volume and positive sentiment around Solana's ecosystem upgrades and DeFi growth are supporting the uptrend. Key resistance levels are being tested, and a breakout above recent highs could signal continuation toward higher targets. Technical indicators like RSI and MACD show upward momentum, confirming bullish strength.
SOL/USDT Price Prediction - 1W (Updated)**** Yousef Sharafi ****
In the weekly time frame, an Cup and Handle pattern is visible on the chart.
Follow me here for more analysis