Trade ideas
SOL Reclaims $207 – Can Bulls Push Through $212 Toward $224?Solana (SOL) is trading around $207 on the 4-hour chart, just under the key $212 pivot zone. In this video, we focus on today’s Solana/USDT analysis and walk through the levels that matter most: $207 and $212 as the pivots, $222–$224 as the next resistance, and $234 as the higher target if bulls stay in control. On the downside, support sits at $205, $201, $195, and the deeper defense at $178.
With Bitcoin showing bullishness and the U.S. Non-Farm Payrolls report released today, volatility is high across markets. In this Solana update, I explain how NFP, Bitcoin’s strength, and these intraday levels fit together to shape the next moves.

SOL long ideaHolded 179 area, broke recently bearish algo, first pt 219.21, then 237.06 and 246.80 as neared resistance

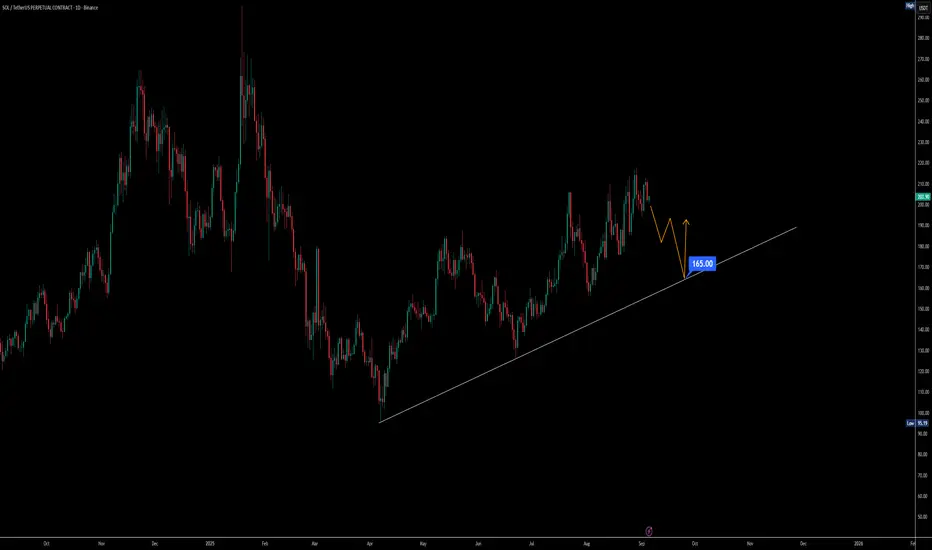
Solana momentum slowing correction to 165 or 100 possibleIf we look at Solana on the daily timeframe, the structure has been holding higher lows consistently, which shows strength. But the reality is that liquidity from the retail side is drying up while Bitcoin dominance keeps climbing. On top of that, today’s U.S. unemployment data will be a key driver. A stronger report could put pressure on the market and trigger a correction, while weaker numbers may shift sentiment but won’t erase the need for a healthy pullback.
Right now, both MACD and RSI, along with Stochastic RSI, are hinting at momentum exhaustion. Volume is steadily declining, which usually signals an upcoming correction phase. The critical zone to watch is around $165. If Solana holds this trendline support, the structure remains intact. But if this level breaks, the move could accelerate toward the $100 region — a deeper, more volatile correction.
Overall, I’m expecting September to deliver that correction. It’s not a bearish outlook but rather a needed reset. Without such a shakeout, the market won’t have the fuel to retest previous all-time highs or push into new ones. A correction here is not weakness — it’s preparation for the next strong rally.
SOLUSDT- 250905 - LONG - Binance - Algo Target - 1WSOLUSDT- 250905 - LONG - Binance - Algo Target - 1W

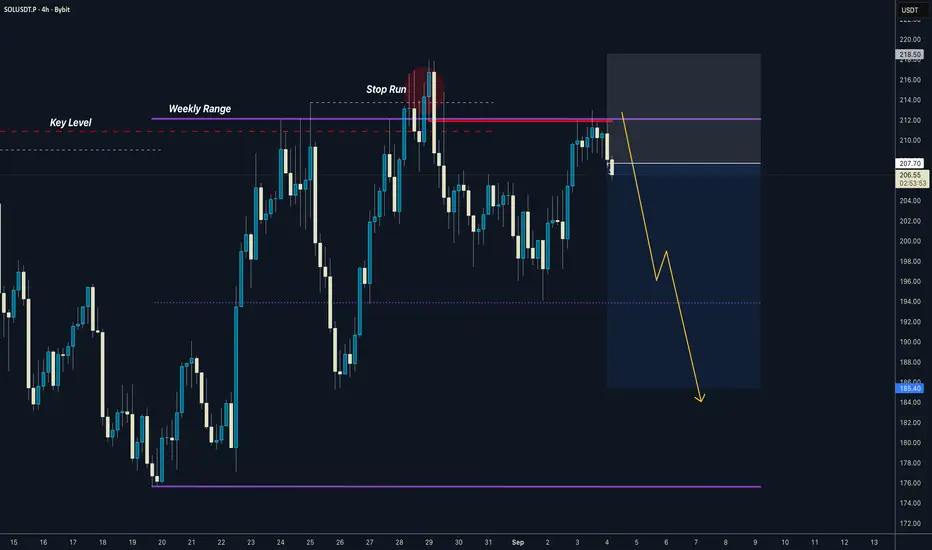
SOLANA everything is ready for the classic Thursday dump
Weekly range manipulated
Traded inside to induce sellers
Stopped them out
Created OB
Retested
Short is ready
There are so many people on here who are addicted to gambling
But they don’t want to accept it - so they call themselves a trader because it sounds much better and productive than being addicted to casino games or sports betting
Make sure you’re doing trading for the right reasons
You need to have a deep look at yourself and what you’re doing
Trade responsibly
David Perk
SOL/USDT | Is the Next Bullish Wave Coming? (READ THE CAPTION)By analyzing the Solana (SOL) chart on the daily timeframe, we can see that the bullish momentum is still intact, with the price currently trading around $207. I expect that after a short-term correction, we’ll likely see another bullish wave from Solana.
If the price resumes its upward move, the next potential targets are $218, $245, and $260.
Key demand zones to watch are $197–$204 and $173–$187.
Stay alert for reactions around these levels!
Please support me with your likes and comments to motivate me to share more analysis with you and share your opinion about the possible trend of this chart with me !
Best Regards , Arman Shaban

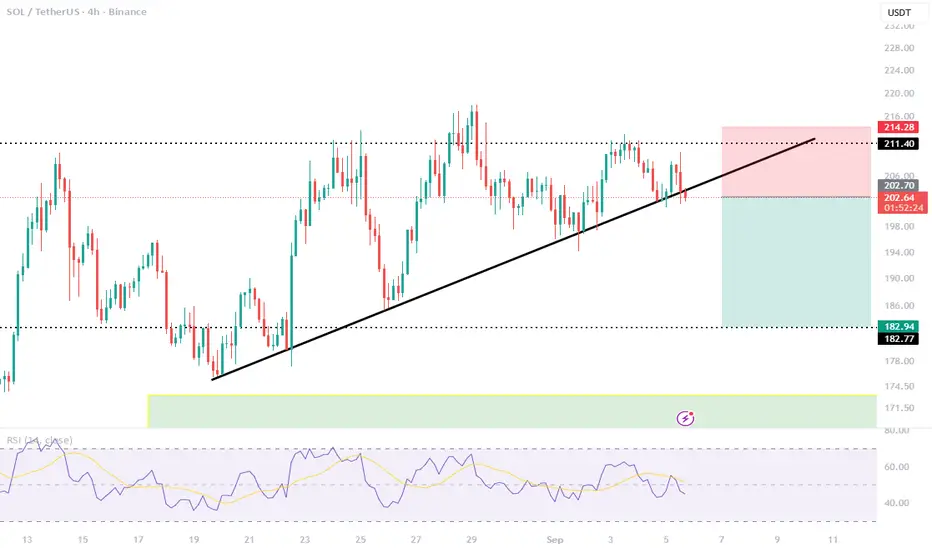
Lingrid | SOLUSDT Potential Long ot Psychological Level of $200The price perfectly fulfilled my previous idea . BINANCE:SOLUSDT is pulling back after testing the resistance zone near 208–210 and remains supported by the upward channel structure. Price action has formed a range above 195, with higher lows protecting the trendline and momentum holding firm. If 195–200 holds as support, price could rebound toward the 225 level for the next leg. Sustained momentum inside the channel keeps the broader bias bullish with potential mid-term targets higher.
📉 Key Levels
Buy trigger: Rejection 200 support zone
Buy zone: 195–200 accumulation region
Target: 225
Invalidation: Break below 180
💡 Risks
Breakdown of the upward channel with daily close below 195.
Strong USD data pressuring risk assets across markets.
Loss of broader market momentum leading to deeper corrective moves.
If this idea resonates with you or you have your own opinion, traders, hit the comments. I’m excited to read your thoughts!

SOL SHORTBearish engulfing candlestick formed on 4hr chart. This coincides with BTC's price reversal at 112K.
$195 demand zone not looking strong enough . Loos like more downside to $175.

SOL (Solana) Price Trend Projections
🔹 1-Day Projection
Analysis:
Positive MACD, RSI near overbought but in a neutral range.
Price near Bollinger middle band, potential for upward movement toward the upper band (227.9).
Low volume, limiting volatility.
Fibonacci Resistance: 214.4, Support: 189.5.
Price Range: $200 – $214
Sentiment: Slightly Bullish
---
🔹 1-Week Projection
Analysis:
MACD turning positive.
RSI ranging from 47 to 61, neutral to bullish bias.
Potential breakout if price approaches upper Bollinger band (227.9).
Economic data (e.g., NFP, CPI) could drive risk appetite.
Price Range: $210 – $225
Sentiment: Bullish
---
🔹 1-Month Projection
Analysis:
SMA(200) at $157.3, confirming strong long-term support.
RSI and MACD suggest continued bullish momentum, but overbought conditions could emerge.
Fibonacci Resistance at 234.6.
Price Range: $215 – $235
Sentiment: Bullish
---
📝 Summary
1-Day: $200 – $214
1-Week: $210 – $225
1-Month: $215 – $235
#solusdt
#solana

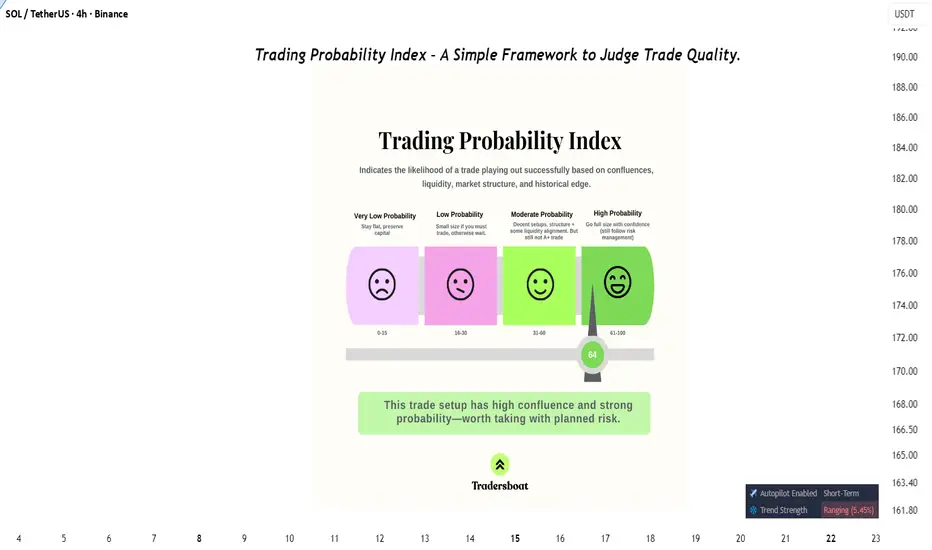
Trading Probability Index – A Simple Framework to Judge Trade Qu📖 Description:
Most traders enter positions without measuring probability. This framework solves that.
The Trading Probability Index (TPI) combines:
✔️ Confluences (indicators & structure)
✔️ Liquidity zones
✔️ Market structure shifts
✔️ Historical edge
It categorizes setups from Very Low → High Probability so traders know when to stay flat, go small, or go big with conviction.
📊 In this example, the trade scored 64 → High Probability Zone, meaning the setup has strong confluence and is worth taking—with proper risk management.
This tool helps traders filter noise, focus on quality setups, and avoid overtrading.
👉 Do you have your own system to measure trade quality? Or do you go by gut feeling?
Sep 2, 2025 - SOLUSDT Long Position ReviewFollowing up on yesterday’s analysis, with each reaction to the 204.34 level, I became more confident about the presence of sellers above this zone. At the same time, since every rejection off this level was also creating a higher low , I decided to treat it as a risky long trigger.
After the breakout of this line and the 15m and 1H candle closing above it, I was still cautious, suspecting that the main sellers might be sitting around 206.24 .
At that point, as the RSI also reached its resistance line, I placed a buy stop order at 207 , just above the highest previous wick. I intentionally set the buy stop at the highest possible point to ensure that both price and RSI had convincingly broken their resistances.
This position is still open, and I’m now waiting for higher targets to be reached.

Solana Reclaims $197 Support, Eyes Expansion Toward $260Solana (SOL) has reclaimed $197 support above the value area high. With vertical accumulation in play, sustained volume inflows are needed for continuation toward the $260 resistance level.
Solana continues to show bullish strength as it reclaims $197 support, establishing a base above the value area high. This development confirms the ongoing vertical accumulation structure, characterized by consistent higher highs and higher lows. With market structure intact, Solana is preparing for the next stage of its bullish advance.
Solana (SOL) Key Technical Points
- $197 Support Reclaimed: Price now sits above the value area high.
- Vertical Accumulation: Structure of higher highs and higher lows remains intact.
- Upside Target at $260: Breakout continuation could extend to this key resistance.
The reclaim of $197 marks an important step for Solana’s bullish trajectory. This support is not only structural but also symbolic of market confidence, as price has managed to consolidate above the value area high. Reclaiming this zone eliminates immediate downside risk and places Solana back into a position of strength.
Price action continues to demonstrate vertical accumulation, where each pullback has been shallow and quickly followed by another leg higher. This behavior is consistent with strong bullish environments, where demand consistently outweighs supply. The preservation of higher lows throughout this uptrend further confirms Solana’s strong structural integrity.
For continuation toward $260, volume will play a decisive role. While Solana has shown impressive structural resilience, the sustainability of the move depends on bullish influxes maintaining strength. In recent sessions, demand has been supportive, but this must continue and intensify as price approaches higher resistance levels. Without growing volume, momentum risks fading before reaching $260.
The $260 mark is the next major resistance zone, aligned with prior structural rejections and psychological significance. A clean test and breakout of this level would confirm continuation and potentially open the door for further extensions on higher timeframes.
What to Expect in the Coming Price Action
As long as Solana holds $197 as support, the bullish outlook remains intact. Sustained bullish volume inflows should propel price toward $260 resistance, confirming the vertical accumulation phase and reinforcing the continuation of Solana’s uptrend.

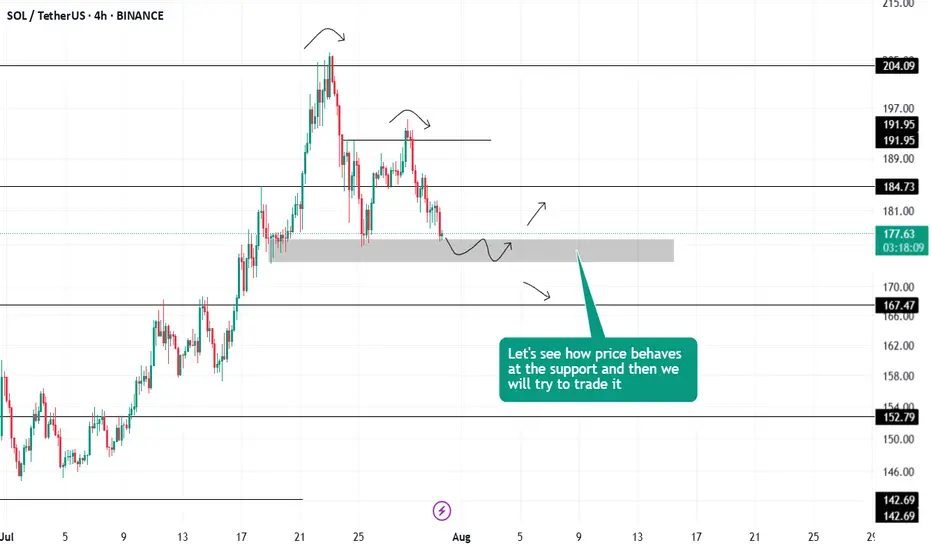
#SOL TRADE IDEASol has now approached an important support level. Let's see how the price behaves at this black zone to make further decision .
Next major support $157
Perfect Solana · Keep Holding · Too Early To Give UpSolana is in a perfect position. Notice the last four days that closed red. 29-Aug through 1-Sept. All these days of bearish action but no major drop. This is a marketwide bullish signal.
Marketwide because Solana is one of the big projects.
Solana is Crypto: What one does, the rest follows.
If Solana is set to continue growing, as it is shown by its massive strength, then we know the other projects that move together will do the same thing.
Some pairs can look weak and we don't know if they will continue to drop or instead reverse to start (resume) moving higher.
Seeing SOLUSDT and the perfect rising triangle; how easy Solana continues to move higher even while Bitcoin was experiencing strong bearish action, reveals what is happening behind the scenes.
Money is being shuffled around. Whales are loading up. The plan is being implemented and the resutls will be awesome.
Do you see a bullish chart here?
Does the drawings on the chart reveal the tendency and bias for this pair?
Look, the market can move lower of course, but we have a rising channel. Any drop will be bought.
Solana has much more to give. Too early to give up.
Thank you for reading.
Namaste.

POL/USDT Trade Idea💎 BINANCE:POLUSDT Trade Idea 💎
📊 Pattern spotted: Double Bottom ✅
This setup indicates strong support around 0.2800 and signals a possible bullish reversal.
⚡ Entry (Advanced): 0.2860 – 0.2870
🎯 Target (TP): 0.2960
🛡️ Stop Loss (SL): 0.2800
✨ Risk/Reward: Low Risk – High Profit 🚀
This is an advanced entry with tight SL and strong upside potential.
📈 If the neckline breaks and sustains above, we can expect a bullish move towards the target.
🔑 Summary: Double Bottom gives confidence of reversal 📉➡️📈. Perfect setup for traders who like low loss & high reward opportunities.

SOL Swing Long IdeaSOL Swing Long Idea
📊 Market Sentiment
Overall sentiment remains bullish, supported by expectations of a 0.25% rate cut in the upcoming FOMC meeting. A weakening USD and increasing global risk appetite continue to create favorable conditions for further upside in crypto assets.
📈 Technical Analysis
The market aggressively broke the HTF bearish downtrend and closed above it on the daily timeframe. This indicates that price wants to move higher. Moreover, price also broke the HTF resistance level, which is now acting as HTF support.
📌 Game Plan
I already opened a long position since the setup is currently valid.
A possible retest around $196.5 could offer the best entry in my opinion.
📋 Trade Management
Stoploss: Daily close below HTF support at the $171 level
Target: $296 (All-Time High)
💬 Like, follow, and comment if you find this setup valuable!
⚠️ Disclaimer: This content is for informational and educational purposes only and does not constitute financial, investment, or trading advice. Always do your own research before making any financial decisions.

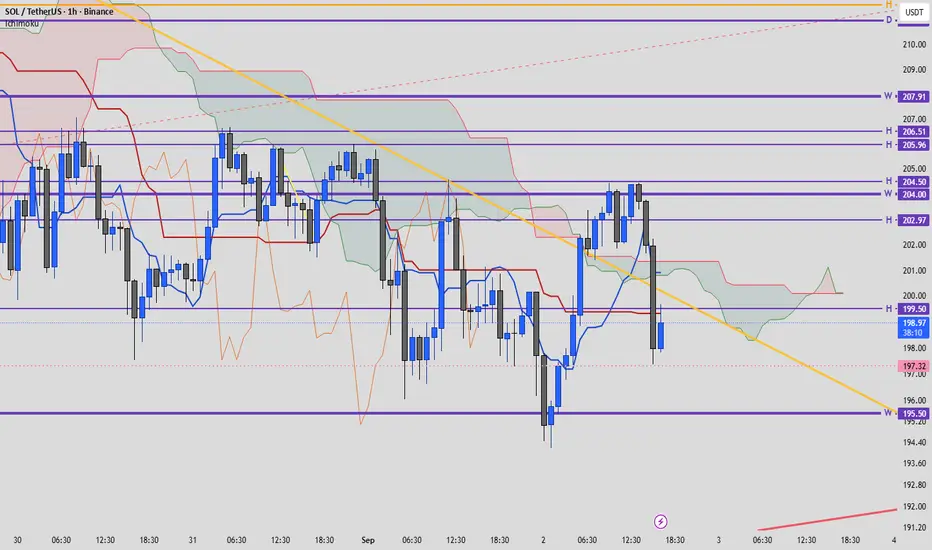
Solana (SOL/USDT) Technical Analysis – 1H ChartOn the 1H chart, Solana is ranging between key support and resistance levels (marked in purple, derived from higher timeframe Ichimoku levels).
🔹Resistance Levels
207.91 (Weekly):** A major resistance zone. A breakout above could open the path toward 210.
206.51 – 205.96 (Daily/Hourly):** Strong resistance cluster that has repeatedly rejected bullish attempts.
204.50 – 204.00 (Weekly/Hourly):** First short-term barrier for buyers.
202.97 (Hourly):** Mid-level resistance, crucial for momentum continuation.
🔹Support Levels**
199.50 (Hourly):** Immediate support, currently being tested. Losing this level may trigger further selling.
197.32 (Hourly):** Next short-term support, likely to be retested.
195.50 (Weekly):** Key medium-term support. A breakdown here could extend the correction toward 192 and lower.
🔹Ichimoku Insights**
Price is trading **below Tenkan-sen (blue)** → showing short-term bearish pressure.
Kijun-sen (red)** around 200–201 acts as a dynamic resistance.
Kumo Cloud** ahead is thin and flat, signaling indecision. A breakout above 202 would bring price inside a bullish Kumo structure.
Chikou Span (orange)** is still below price, not confirming a bullish reversal yet.
---
## 📊 Conclusion
* **Bullish Scenario:** A confirmed breakout above **202.97** could target **204.5 → 206.5**.
* **Bearish Scenario:** Breaking below **197.3** opens the way to **195.5 → 192**.
👉 The **197–202 zone** remains the key battleground. A breakout on either side will likely define Solana’s next move. 🚀
$SOL holding strong at support.CRYPTOCAP:SOL seems to be holding very strong above 0.5 FIB level on 4H timeframe expecting a little pump in it.
CRYPTOCAP:SOL doesnt want to go down because retail keeps buying every dip.
It only clears on thing which is meme coins season is around.

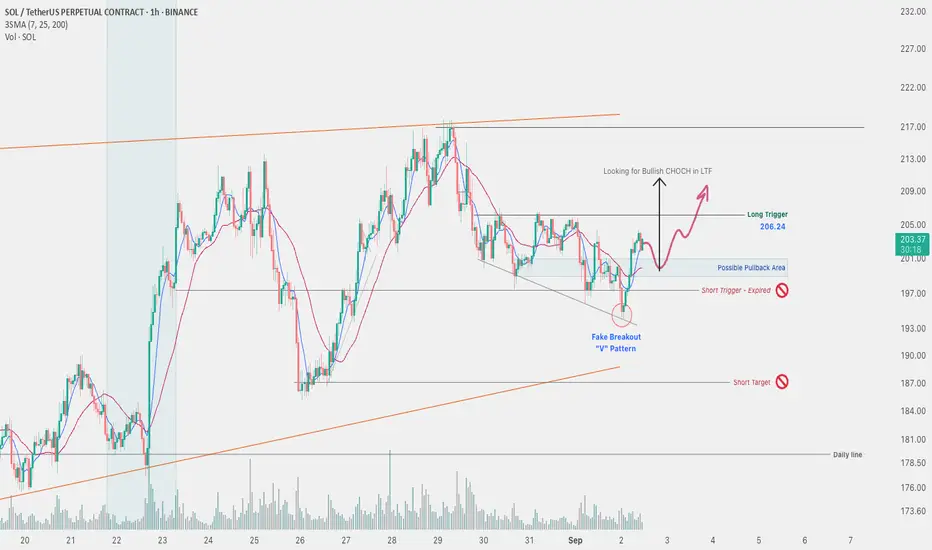
Sep 2, 2025 - SOLUSDT 1H Chart Analysis-01Despite the broader long-term uptrend in Solana, yesterday I was considering a risky short position on one of the altcoins and had already defined the triggers. Fortunately, the short trigger was broken while I wasn’t monitoring the chart, so no position was opened.
The positive development is that we saw a fake breakdown of the 197.36 support zone. After collecting liquidity below this level, Solana initiated a strong bullish move.
I’ve marked the long trigger at 206.24. However, for an early entry ، if I spot a market structure shift in the pullback zone, I’ll scale in with a partial position. Then, if the main level breaks, I’ll add more volume to the trade.
I will also check my entries with the SOLBTC chart for more confirmation
SOLUSDT NEXT MOVE.SOLUSDT is expecting rejection from current supply zone and it better for short trade, and expecting towards green demand area of liquidity where we can book profit of Short and take long position.

SOLUSDT (Daily)🔎 Chart Context
• Pair: SOL/USDT
• Exchange: Binance
• Timeframe: 1D (Daily)
• Current price: ~235.7
• Solana has been in a sustained uptrend since April, consistently making higher highs and higher lows.
• Chart marks a take-profit (TP) level at 236, which price is now approaching.
📊 Key Observations
1. Market Structure
• Clear bullish structure since April with a strong ascending trendline.
• Series of higher highs: 180 → 203 → 236 (targeted).
• Consolidation near the supply zone around 220–230 before breakout attempt.
2. Support & Demand Zones
• 203 – 205: Previous resistance turned into support.
• 180 – 185 (CH D): Strong demand block aligning with trendline.
• 140 – 150: Historical support, last defended in June.
3. Resistance & Supply Zones
• 236 (TP level): Immediate resistance / liquidity target.
• 260 – 280: Extended supply cluster from February selloff.
• Above 280 → clean path toward 300+.
4. Trendline
• A rising daily trendline supports the move from April lows (~100) to present.
• As long as Solana holds above this ascending trendline, the bullish structure remains intact.
📈 Bullish Scenario (Higher Probability)
• Price sustains above 203–205 support and rides trendline higher.
• Path: Pullback into trendline → continuation rally.
• Targets:
• TP1: 236 (short-term)
• TP2: 260–280 (medium-term supply zone)
• TP3: 300+ (macro extension)
📉 Bearish Scenario (Countertrend / Risk Case)
• Price fails to hold above 203 and loses the trendline.
• Pullback path:
• First stop: 180 (CH D demand)
• Deeper correction: 140–150 zone
• Break below 140 would flip structure bearish, invalidating the current uptrend.
⚡ Trading Plan
• Long Setup (Preferred):
• Entry: Retest of 203–205 support or trendline bounce.
• TP1: 236
• TP2: 260–280
• TP3: 300+
• Stop: Below 180
• Short Setup (Countertrend):
• Entry: Rejection at 236 with weakness confirmation.
• TP: 203 → 180
• Stop: Above 240

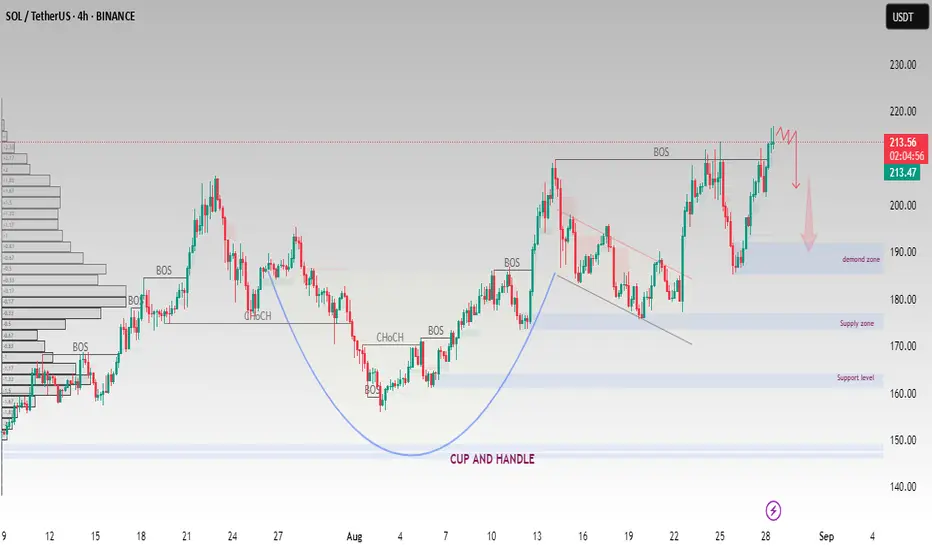
SOL/USDT – Cup & Handle Breakout with Demand Zone in FocusSolana (SOL/USDT) on the 4H chart is showing a Cup & Handle pattern, a bullish continuation formation. Price has recently broken the neckline around 213 – 215, but it is now facing strong resistance near the 220 zone.
Key levels to watch:
Resistance: 215 – 220 (possible rejection area)
Demand zone: 190 – 200 (potential pullback level)
Supply zone: 170 – 180 (secondary support if deeper correction occurs)
Support level: 160 (major downside protection)
If price sustains above 220, continuation toward 230+ may be expected.
A rejection at resistance could trigger a retest of the 190 – 200 demand zone before any bullish continuation.
Bullish in the bigger structure, but short-term correction remains possible.
This analysis is for educational purposes only and should not be considered financial advice. Always manage your risk and trade according to your plan.