$SOL (DAILY): LON $187 (STOP LOSS: below $170)Longing CRYPTOCAP:SOL here at $187.
Reasoning within 30 minutes in the next post.
Modest stake, SL: two 4-hour candles below $170.
💙👽
Trade ideas

SOLUSDT – Is the Sun Rising Again for Solana?Solana found strong footing,and bulls seem to be warming up again 🔥
But careful if it slips back below 174.60, the sun could set a bit earlier than expected 🌅😅

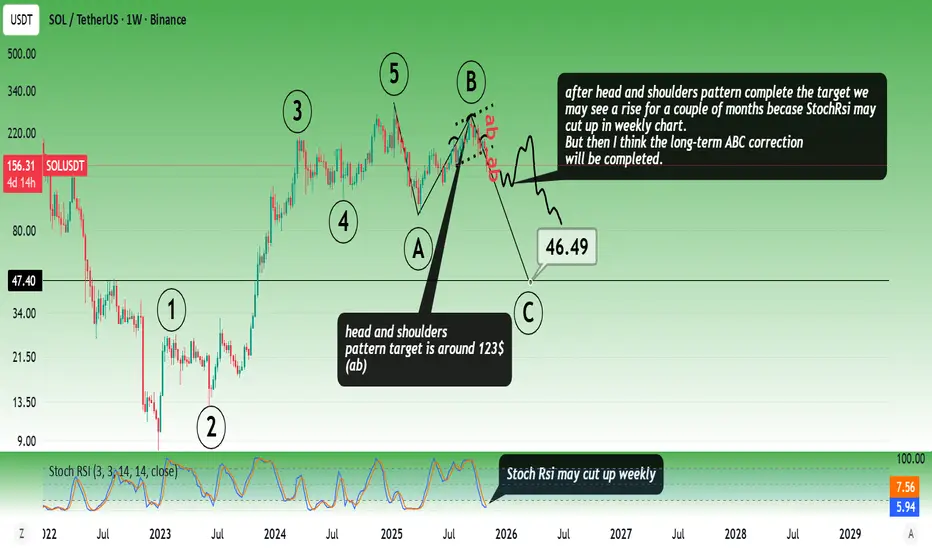
Solana RoadmapAfter the head and shoulders pattern complete the target we
may see a rise for a couple of months becase StochRsi may cut up in weekly chart.
But then I think the long-term ABC correction will be completed.
* The purpose of my graphic drawings is purely educational.
* What i write here is not an investment advice. Please do your own research before investing in any asset.
* Never take my personal opinions as investment advice, you may lose your money.
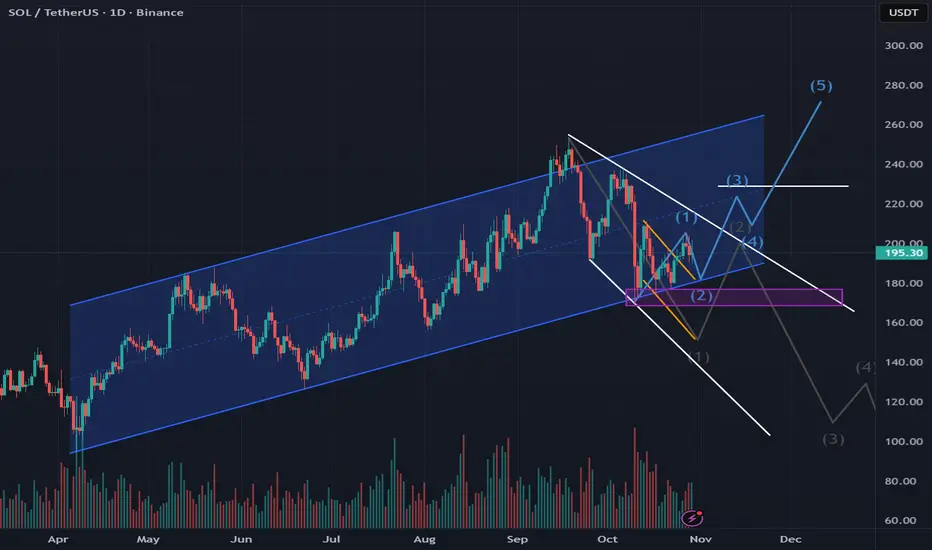
Solana shows diverging patternsSOL has formed a very interesting pattern and situation...
On the one hand, we see:
- confident movement within an ascending channel (marked in blue)
- positive news regarding SOL and the ETF
- a locally formed bullish flag, which fulfilled the expected movement (marked in yellow)
On the other hand, we see:
- a formed descending expanding wedge (marked in white), within which the global trend should have developed and become downward
- theoretically, the movement and formation of the first corrective Elliott wave (marked in dark gray) was determined within it
- buyers are preventing either the pattern or the wave from forming
The situation is interesting because we clearly see how the price is rebounding strictly along the lower boundary of the ascending channel, preventing a downward movement according to the pattern (marked in white) from forming, indicating the strength of the buyers. At this time, we also see the possible formation of a second corrective wave within the upward movement.
Current price: $193.40
An upward movement is most likely expected, with a breakout from the descending expanding wedge, within the ascending channel, to levels of $206, $220, and above...
A breakout into the $176 and $166 zone is also possible, and if the price goes lower, the current pattern will be broken.
More detailed analysis, additional charts, and key levels to watch are available on our site
SOL-USDTWith the correction of Bit
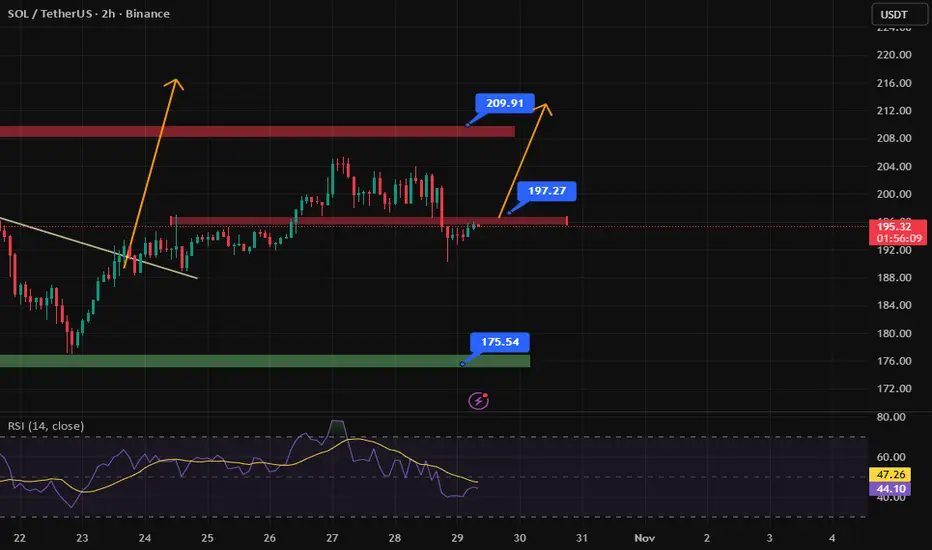
Solana also came to test $175 once again and this support prevented the correction well again 🕯🕯
If nothing special happens in the crypto market, it can continue to rise like a flash towards $197-200

SOL 1H OutlookSOL just raided weekly sell-side liquidity and reacted instantly — algorithmic accumulation signature. Looking for bullish continuation into premium levels.
📍Levels
Entry: $156.90 – $159.61
Stop: $145.74
First Target: $168 – $170
Main Target: $189.73 liquidity cluster
✅ Confluence
• Weekly sell-side liquidity swept
• Bullish displacement after the sweep
• Alligator curl + early expansion phase
• Demand zone reclaimed
• Liquidity void above → draw on liquidity
• Fractal shift at lows → accumulation phase signal
As long as price holds above reclaimed liquidity zone, expecting delivery higher.
Partial profits at $168–$170 region, let the rest ride to $189.73. 🚀
#SOL #SmartMoneyConcepts #ICT #BillWilliams #CryptoTrading #PriceAction

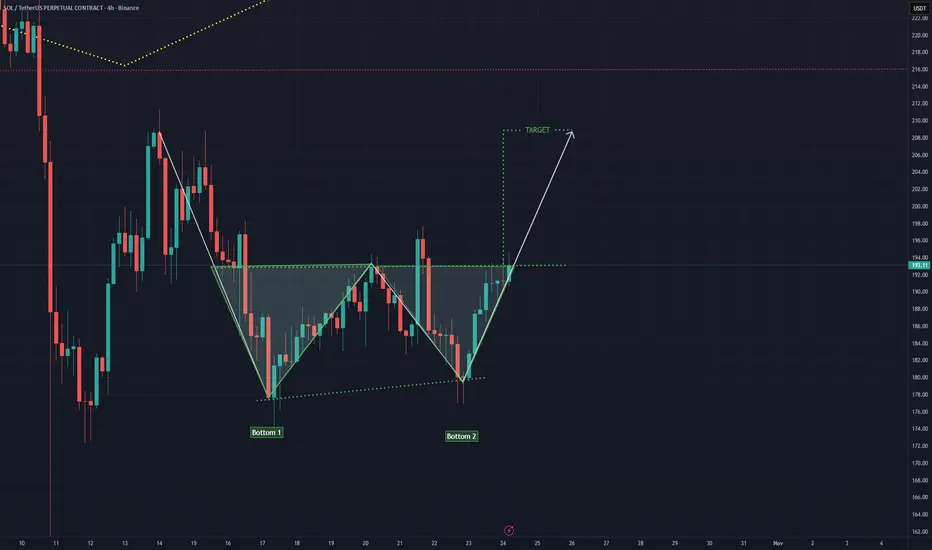
SOL 4H CRYPTOCAP:SOL 4H Chart
Solana forming a clear Double Bottom pattern signaling a potential trend reversal after the recent pullback.
Price is testing the neckline resistance, and a breakout above could confirm bullish continuation toward the projected target zone.
If confirmed, this setup suggests strong bullish momentum building for $SOL.
#SOL #Solana #Crypto #PriceAction #TradingView
SOL Follows Red Scenario — Key Support at 138–126Last week, Solana followed our red scenario. At the moment, the price is trading below the weekly levels.
If Bitcoin continues to decline, Solana’s price could drop into the 138–126 support zone. A return to a bullish trend will only be possible after breaking above 190 .

Solana Still ChillsSolana continues its correction phase. I am expecting a move toward 190 now
The invalidation zone for this scenario is marked on the chart

$SOL (DAILY): HIDDEN BEAR RSI divergence, $69M ETF inflows CRYPTOCAP:SOL has now got a spot #ETF (Bitwise), and that thing pulled in nearly $70 million in inflows on day one — not bad. People and institutions have clearly been waiting for this one.
Normally, these types of events are textbook “sell-the-news” moments. However, in this case, if the inflows stay strong and even start growing day by day, that’s definitely not bearish.
Chart-wise, I published my strategy for #Solana recently (quoted post), and the plan stays the same — patiently wait for a breakout, especially with the latest bearish hidden RSI divergence; I never ignore these.
The bullish MACD crossover and hidden bullish OBV divergences can’t be ignored either, but I definitely won’t go long before a confirmed breakout.
Rules are rules. #FOMC day today, so I’d rather not open any new positions until tomorrow.
👽💙

SOLUSDT: Bullish Persist, Aims For $211 And Above ?Here is why..
SOLUSDT have been trending in a long upward channel for the past few months, as we can observe in the chart formation. the pair has repeatedly respected the higher lows region.
Currently the price is rising slowly, heading towards $211 which seems to be the next potential target. however it might extends its bullish move above the anticipated level, in regards to the trendline.
Follow up and share your thoughts on this..
Thanks for reading.

SOL - NEUTRAL AREA, bearish bias likely! CRYPTOCAP:SOL - no price direction, very neutral.
Likely a retest of the 190$ - 184$ support zone next. 📉

$solana long
### 🟢 SOLUSDT | 15-Minute Long Setup - Awakening from Accumulation
**Concepts: ICT | SMC | Bill Williams**
SOL is showing a compelling bullish structure after a period of consolidation. The price is currently testing the convergence point of the Bill Williams Alligator, indicating the market is "waking up" from its sleeping phase. The alignment of the Lips above the Teeth and Jaw suggests the beginning of a new bullish impulse.
**ICT & SMC Perspective:**
* **Liquidity Sweep & Demand Zone:** A clear sweep of sell-side liquidity occurred below **194.91**, tapping into the previous demand zone and creating a mitigation block. The subsequent rejection confirms buyer presence.
* **Break of Structure (BoS):** The swing high at **~196.07** has been breached, confirming a minor bullish shift in market structure.
* **Fair Value Gap (FVG):** The strong bullish move from the lows has created an FVG which the price is now retesting, offering a potential premium entry for longs.
* **Targeting Liquidity:** The next significant pool of buy-side liquidity rests above the **207.88** swing high.
**Bill Williams’ Alligator Confirmation:**
The Alligator is perfectly aligned for an upward move:
* **Lips (195.24) > Teeth (195.03) > Jaw (194.91)**
* This alignment, with price trading above all three, signals the Alligator is "awake" and hunting to the upside. The expanding mouth confirms building bullish momentum.
**Trade Plan:**
* **🟩 Entry:** On retest of the Alligator confluence zone (**195.20 - 195.00**) or a break above the local high (**196.10**).
* **🔴 Stop Loss:** **191.50** (below the Jaw and the recent liquidity sweep low).
* **🎯 Take Profit 1:** **202.00** (Previous resistance)
* **🎯 Take Profit 2:** **207.88** (Key swing high and liquidity target)
**RRR > 3:1**
**Conclusion:**
With a successful liquidity sweep, a confirmed Bullish BoS, and the Alligator fully aligned and awake, SOL is poised for a move toward the **202.00 - 208.00** resistance zone. Longs on a retest of the Alligator support offer a favorable risk-reward opportunity.
---

[SeoVereign] SOLANA BEARISH Outlook – October 27, 2025Hello everyone,
This idea presents a bearish (short) outlook on Solana as of October 27.
Currently, Solana has entered a short-term overheated zone,
and we are beginning to observe a gradual inflow of selling pressure.
First Basis — (DEEP) GARTLEY Pattern
Solana is currently located within the PRZ (Potential Reversal Zone) of a (DEEP) GARTLEY pattern.
This zone is typically recognized as the terminal phase of a short-term upward wave,
where a trend reversal to the downside often occurs due to overbought conditions.
Second Basis — WAVE.M = WAVE.N × 0.786
The ongoing M-wave has formed approximately 78.6% of the length of the previous N-wave,
which represents a classic reversal structure commonly observed within the GARTLEY pattern.
Therefore, entering a short position within this range is considered technically valid.
Accordingly, the average target price is set around 184.97 USDT.
Depending on future price developments,
I will provide further updates on refinements to this idea and position management strategies.
Thank you for reading.

Solana is still within range... SOL just got some bullish news with a Western Union relationship. Could this be a catalyst that will allow the PA to exit the range? The current upward channel has been respected on the D1, although the trend has been our friend; trendline liquidity has been building. Regardless, the SOL price is at an important POI.

SOLUSDTI think have this chart of BINANCE:SOLUSDT buy because breakout trendline and i see order-block in 194$. Target is end measured move (2-Leg) from low latest swing in 208$.
Please control your risk in any position.

SOL LONG Concepts: ICT | SMC | Bill Williams
SOL continues to respect bullish smart money structure after tapping into a well-defined demand zone around the 198 area. Liquidity was swept below the prior consolidation lows, leading to a bullish change of character (ChoCH) — confirming that the market is likely accumulating orders before expansion.
ICT Perspective:
Sell-side liquidity taken below previous range lows
Strong displacement candle breaking short-term structure
Entry refined on retracement into the FVG inside the demand zone
Targeting buy-side liquidity resting above the 210 level
SMC Confirmation:
BOS confirmed on LTF
Price retested the mitigation block and rejected strongly
Entry: 202.00
Stop loss: 198.30 (below demand zone)
Take profit: 210.90 (previous high / liquidity pool)
Bill Williams’ Alligator:
The Alligator is beginning to wake up — green (lips) leading red and blue lines upward, signaling that momentum is shifting in favor of buyers. Once the lips cross above and the mouth opens, it often marks the start of a new impulsive wave.
Trade Plan:
🟩 Long: 202.00
🔴 SL: 198.30
🎯 TP: 210.90
RR ≈ 2.8:1
📈 With bullish structure confirmed and Alligator alignment showing early trend development, SOL could aim for the 210–212 liquidity zone before the next retracement.

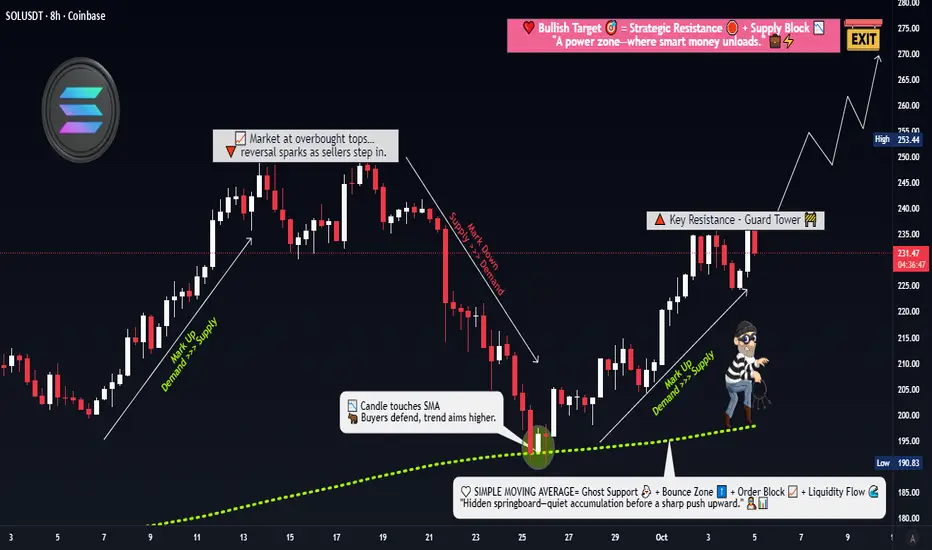
SOL Consolidation — Watching 218 Target or 193 PivotLast week, the price also followed our orange plan. Right now, it’s in a phase of local consolidation.
If the descending trendline breaks, the price is likely to continue rising toward the 218 target. If the local low breaks instead, a correction toward the weekly pivot point at 193 is possible — I expect to see a bounce and a quick recovery from there; otherwise, the price may continue falling toward the ascending trendline .

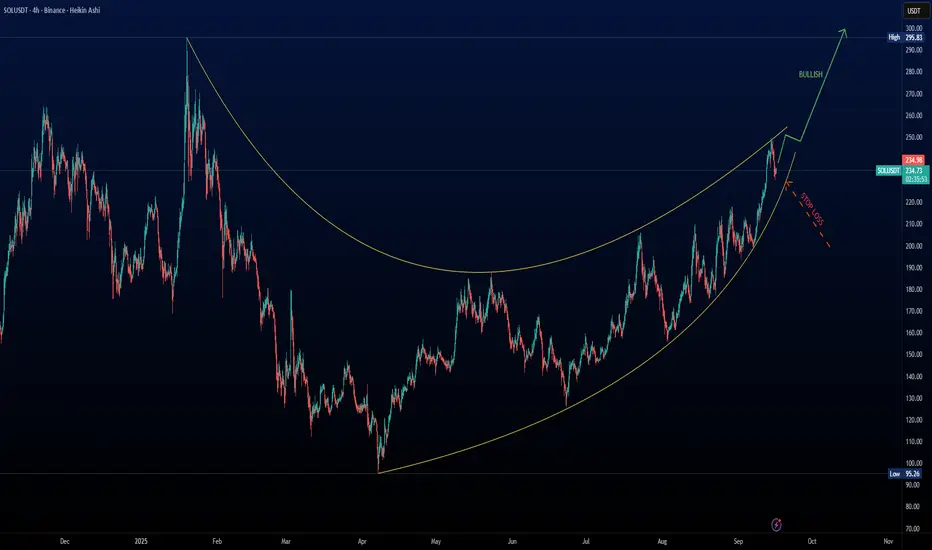
Bullish Momentum Building for Solana (SOL) – Targeting $300!Solana (SOL) is showing strong bullish momentum on the 4-hour chart. The ascending curve pattern suggests a continuation of the uptrend, with price currently hovering around $234.87 and a projected move toward $300 .
🔍 Key Highlights:
Strong Uptrend: Higher highs and higher lows confirm bullish structure.
Technical Setup: Ascending pattern with clear breakout potential.
Target: Price projection points toward $300.
Risk Management: Stop loss level marked to protect against reversals.
This setup offers a great opportunity for swing traders and crypto enthusiasts looking to capitalize on Solana’s momentum. Stay tuned for updates and trade smart!
SOL-USDTThe support level at $197 has been broken and will now act as resistance for Solana 🔽
So Solana needs to consolidate above this resistance to climb back to $210.
Is Solana Ready for a Technical Breakout or Just a Fake Pump?🎯 SOL/USDT Wealth Strategy Map | The Gentleman Thief's Playbook 💎
📊 Market Overview
Asset: SOLANA/USDT (SOL/USDT)
Trading Style: Swing/Day Trade Hybrid
Market Sentiment: Bullish Pending Breakout Setup 🚀
🎭 The Setup (As Told by a Professional Thief)
Dear Ladies & Gentlemen, gather 'round for today's calculated heist...
🔓 The Entry Plan
Breakout Zone: $240
Entry Strategy: ANY price level AFTER confirmed breakout above $240
💡 Why this matters: We're watching for resistance to crack like a vault door. Once $240 breaks with volume, the path to riches opens.
🛡️ Risk Management (The Thief's Insurance Policy)
Stop Loss: $220
⚠️ Important Notice: This is my thief-style SL, but YOU are the master of your own vault. Set your risk tolerance based on YOUR capital and comfort level. Make money, take money — at your own calculated risk.
🎯 Profit Targets (Where We Cash Out)
Primary Target: $270 (Our recommended exit)
Technical Target: $280 (Strong resistance + overbought territory + potential trap zone)
📌 Strategic Exit Reasoning:
$270 offers a clean 12.5% gain from breakout
$280 presents multiple bearish factors: strong resistance, overbought conditions, and classic bull trap setup
Smart thieves escape with profits before the alarm sounds 🚨
⚠️ Important Notice: This is my thief-style TP, but only YOU can decide when to take profits. Your money, your rules, your risk.
🔍 Technical Analysis Deep Dive
Key Levels to Watch:
Resistance: $240 (current), $270 (target), $280 (danger zone)
Support: $220 (our safety net)
The Correlation Play 📈
Related Pairs to Monitor:
CRYPTOCAP:BTC (Bitcoin) - The market's king affects all. If BTC pumps, SOL typically follows with 1.5x volatility
CRYPTOCAP:ETH (Ethereum) - Direct competitor in smart contracts; inverse correlation on capital rotation
CRYPTOCAP:AVAX (Avalanche) - Similar L1 narrative; watch for sector rotation signals
SEED_DONKEYDAN_MARKET_CAP:MATIC (Polygon) - L2 competitor; check for broader altcoin momentum
💡 Correlation Strategy: If BTC holds above $65K while ETH consolidates, SOL historically outperforms due to capital flow seeking higher beta plays.
⚡ The Gentleman Thief's Trading Philosophy
This isn't gambling — it's calculated robbery from the market's inefficiencies. We enter with precision, manage risk like professionals, and exit before greed becomes our enemy.
Remember:
✅ Breakouts need volume confirmation
✅ Risk management is non-negotiable
✅ Profits aren't real until you take them
✅ The market doesn't care about your feelin
📢 Community Engagement
✨ "If you find value in my analysis, a 👍 and 🚀 boost is much appreciated — it helps me share more setups with the community!"
⚖️ Legal Disclaimer
IMPORTANT: This is a "thief-style" trading strategy shared purely for educational and entertainment purposes. This is NOT financial advice. Trading cryptocurrencies involves substantial risk of loss. Past performance does not guarantee future results.
You are solely responsible for your own trading decisions. Always:
Do your own research (DYOR)
Never invest more than you can afford to lose
Understand the risks before trading
Consider your personal financial situation
The author is not a registered financial advisor and assumes no liability for your trading outcomes.
Trade safe, steal smart, exit elegant. 🎩💰
#SOLUSDT #Solana #CryptoTrading #SwingTrading #DayTrading #TradingStrategy #Breakout #TechnicalAnalysis #CryptoSignals #AltcoinSeason #SOL #USDT #CryptoAnalysis #TradingView #PriceAction #CryptoChart #BullishSetup
SOLUSDT.P - October 26, 2025Based on the 4-hour chart, the price appears to be consolidating within a triangle after a sharp decline. A long bias is supported by the potential for a breakout above the upper trendline.

SOL-USDTSolana's reaction to the $196 support I mentioned yesterday
How cool and cool it was
He reacted exactly to it 💎📊
The real growth is when it can break the $209 resistance
