SOL/USDT Weekly Chart Update !! SOL/USDT Weekly Chart Update
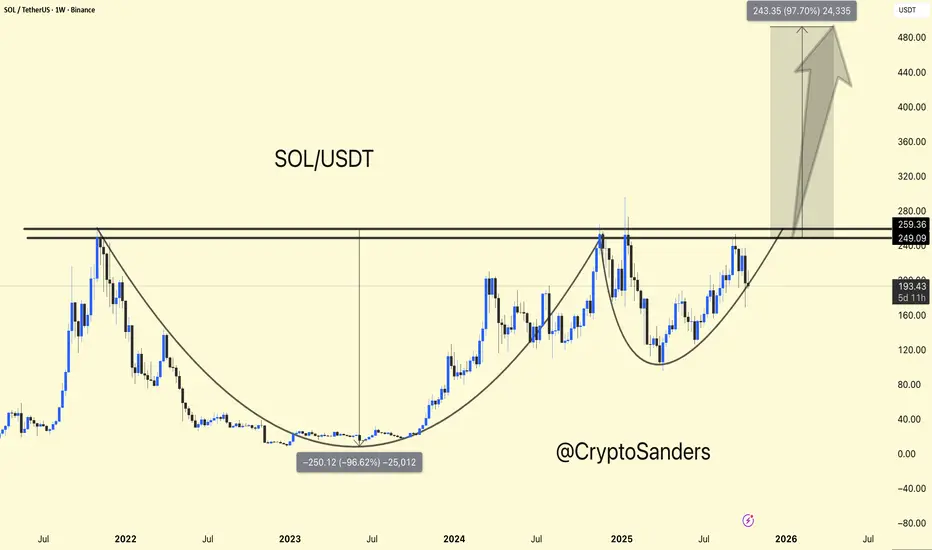
SOL is forming a massive cup and handle pattern on the weekly timeframe – a strong bullish continuation setup leading to a major breakout.
Currently trading around $199, SOL is consolidating below the key resistance level of $250-$260. Once we achieve a weekly close above $260, it could confirm a breakout move towards $450-$480 (approximately +90-100% upside).
Support: $170-$180 (handle base/accumulation zone)
Resistance: $250-$260 (breakout zone)
Target: $450-$480
Overall sentiment remains bullish – the structure is clear, and momentum is building. A confirmed breakout above the resistance level could mark the start of SOL's next major surge.
DYOR | NFA
Trade ideas
SOL last support area potenial of 20% gain toward 218$hi
the support and resistances on the chart are based on the previous data and weekly candlesticks if BINANCE:SOLUSDT holds this last support the potential of 20% gain is logical toward 218$

Lingrid | SOLUSDT Consolidation Break Expansion SetupBINANCE:SOLUSDT rebounded sharply from the $170 support after a flash crash and is now consolidating near the $200 level within a mid-range structure. The chart shows a sequence of impulse and correction leg price action patterns, with buyers attempting to establish momentum. A stable close above $10 may confirm renewed bullish activity toward the $230 resistance zone. The overall structure suggests range accumulation, with a potential upward breakout forming if momentum persists.
⚠️ Risks:
Failure to hold above $190 could lead to renewed selling pressure.
Broader crypto market weakness may cap any upside recovery.
A stronger dollar or macro risk-off sentiment could stall bullish continuation.
If this idea resonates with you or you have your own opinion, traders, hit the comments. I’m excited to read your thoughts!

TradeCityPro | SOL: Market Calms After Sharp Move & RSI Support👋 Welcome to TradeCityPro!
Let’s analyze SOL, one of the most popular Ethereum killers with a market cap of $99.9 billion, currently ranking 6th on CoinMarketCap.
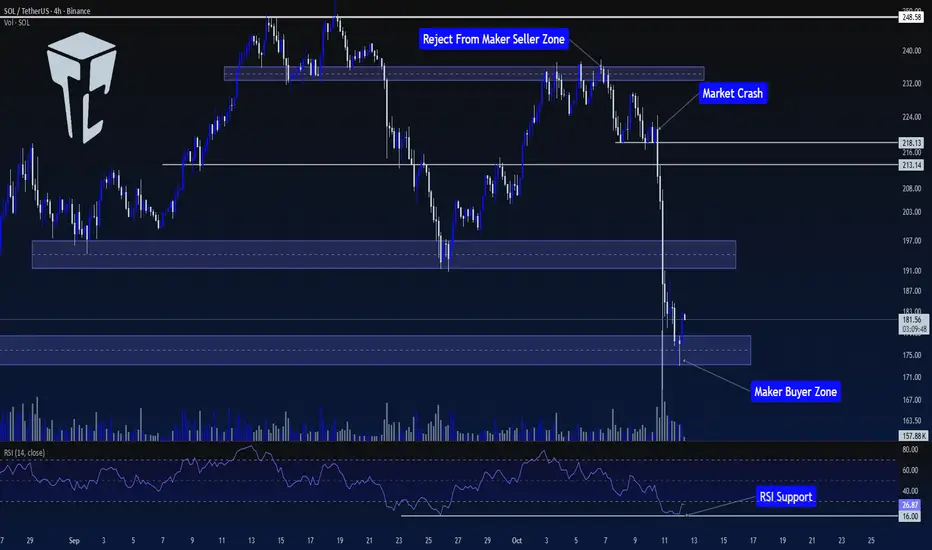
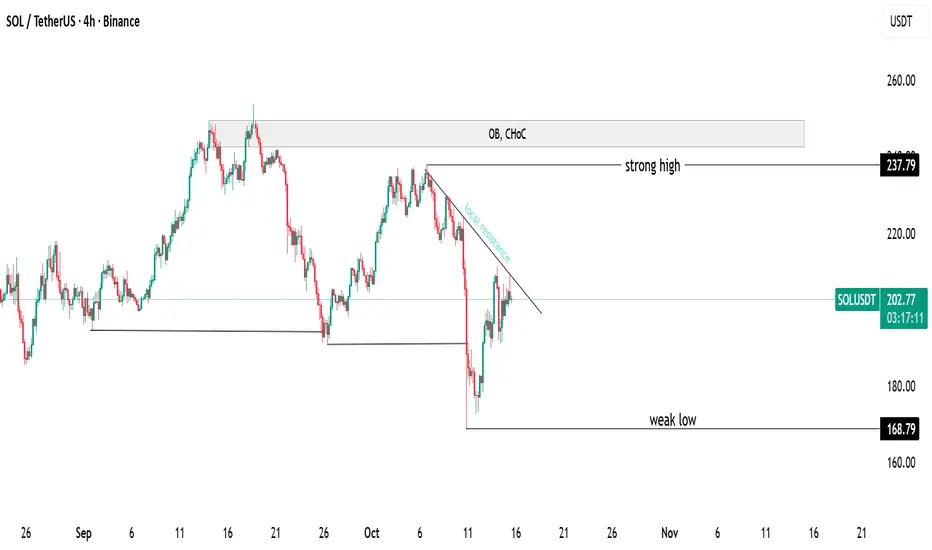
⏳ 4-Hour Timeframe
In the previous analysis, we had a Maker Buyer zone around $235. In that analysis, I mentioned that breaking this zone would be an early trigger for breaking $248.58.
🔍 However, the price never managed to sustain above this level, and after getting rejected from this zone, the price entered a corrective phase, forming a support at $218.13.
📊 After the price bounced from $218.13 for the first time, it failed to set a new high in line with previous highs and instead formed a lower high. The price returned to $218.13 again.
✔️ With the breakout of this level, coinciding with news between China and the U.S., the price started a sharp downward move, breaking through the $213.14 support.
✨ Over the course of 2-3 candles, SOL made a sharp move towards the first Maker Buyer zone, breaking it and reaching the second Maker Buyer zone.
💫 Naturally, there was a significant increase in selling volume during this move, and RSI dropped to 16, where it found support.
🧩 Currently, the market seems to have calmed down, with RSI still in the Oversell zone, but volatility has significantly decreased.
💡 Although the market has calmed, I believe the price needs to build a more structured setup before finding valid triggers, and the market conditions are not ideal for opening positions right now.
💥 So, for now, I won’t provide any triggers on this coin and will wait for more structure to form before making a better decision to open a position.
📝 Final Thoughts
Stay calm, trade wisely, and let's capture the market's best opportunities!
This analysis reflects our opinions and is not financial advice.
Share your thoughts in the comments, and don’t forget to share this analysis with your friends! ❤️
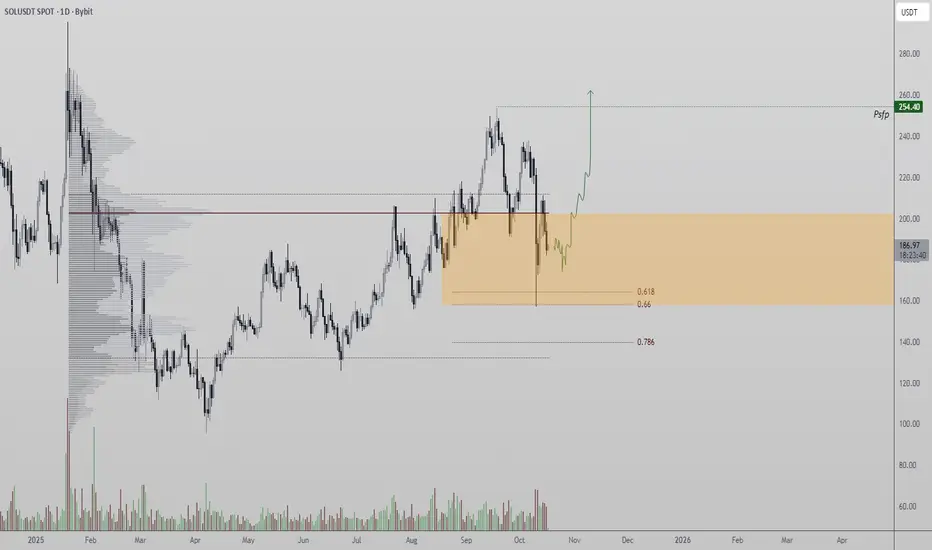
Range-Bound Between 0.618 Fibonacci and POCSolana is currently oscillating between the 0.618 Fibonacci retracement and the Point of Control (POC), forming a tight consolidation range. This zone continues to act as both support and accumulation territory for traders anticipating the next breakout.
Key Technical Points:
- Support: 0.618 Fibonacci confluence
- Resistance: POC zone
- Bias: Re-accumulation range formation
This controlled ranging behavior indicates a potential re-accumulation phase, where smart money absorbs supply before attempting a breakout above the POC. Sustained trading within this range builds a strong structural base for future continuation.
Should Solana reclaim the POC on a closing basis, a move toward higher regions becomes increasingly likely, with targets aligning to previous structural highs.
Until then, Solana remains range-bound but technically constructive, with the 0.618 region serving as a clear accumulation floor.
DeGRAM | SOLUSD held the support line📊 Technical Analysis
● SOL/USD found support near 187 after a sharp correction, rebounding from the intersection of dynamic and horizontal trendlines.
● Price structure suggests the formation of a bullish recovery pattern within a descending channel, targeting 210–220 as the next resistance zone.
💡 Fundamental Analysis
● Solana maintains strong network momentum with rising developer activity and stable DeFi inflows, supporting renewed investor confidence.
✨ Summary
● Long bias above 187; objectives 210–220. Rebound from key support and improving ecosystem fundamentals favor medium-term upside.
-------------------
Share your opinion in the comments and support the idea with a like. Thanks for your support!

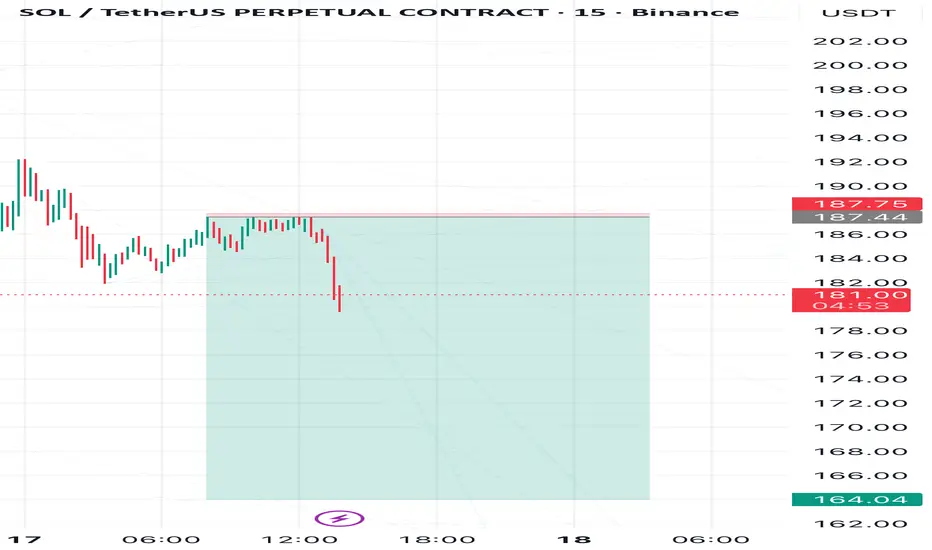
SOL Bears Still in Control — Eyes on 164Solana has repeatedly confirmed its plans to move lower toward the 164 level.
The 187.4 level is a particularly strong support, so a breakout above it would mean the plan is invalidated.
Follow me for consistent technical analysis on Solana
TA on SolanaWeekly chart shows CRYPTOCAP:SOL hitting major support. We need to stay above these levels to avoid dropping further.

Solana Holds 190 USD – Can Buyers Defend the Level?Hello everyone,
After hitting a local top near $205, Solana (SOL) entered a correction, dropping to $192 before stabilising around the crucial $190 support. This level has repeatedly acted as a “brake zone” for previous declines, and it’s once again the focal point for traders.
Technically, SOL’s short-term structure reflects a corrective pattern with descending highs. However, the 190–195 zone remains a strong demand area. Fair Value Gaps (FVGs) appear at $194, $200, and $210 — potential retest points that may define the next directional move. The Ichimoku Cloud still leans slightly bearish, with Span A below Span B, yet the thick lower cloud base sitting near support suggests a possible rebound if buyers regain momentum.
On the macro front, Solana faces pressure from the Fed’s ongoing tightening stance, which slows risk appetite. Even so, the Solana ecosystem remains vibrant — DeFi, NFT, and layer-2 activity continue to attract long-term interest, helping sustain confidence among investors.
In the short term, failure to hold above $190 could trigger a deeper pullback toward $180. Conversely, if buyers defend this zone and push through $200, an advance toward $205–$210 may follow, paving the way for a potential trend reversal.
What do you think — is Solana ready for a rebound, or are we in for one more dip?

Solana Price Holds Key Channel Support, Eyes $550BINANCE:SOLUSDT ’s recovery from the October 10 crash has reshaped its chart structure, keeping the token in a firm ascending channel that’s been intact since June 22. The channel remains one of the most reliable formations on BINANCE:SOLUSDT 's mid-term chart, with every major swing finding support and resistance within its boundaries.
On TradingView, BINANCE:SOLUSDT currently trades around $200, facing resistance at $227 and $250. A clean daily close above $287 would confirm a channel breakout — potentially opening Fibonacci targets near $346, $453, and $540–$551, a zone that marks over 100% upside from current levels.
Support remains strong near $190, where previous reversals have occurred. Holding this range keeps the uptrend valid, while losing it could invite deeper tests toward the lower boundary.
The rebound also aligns with improving holder activity, as both long-term and short-term cohorts reduced selling pressure following the “Black Friday” crash. As sentiment stabilizes, Solana’s next move may hinge on whether bulls can finally push past $287 and confirm a full breakout above the channel.

Solana Ready for Bullish ContinuationSolana demonstrates a constructive market posture with evidence of renewed accumulation following its recent corrective phase.Price activity indicates that buying momentum is gradually strengthening as liquidity continues to shift from weak hands into strategic positioning.The market structure shows improving stability,with compression patterns hinting at an impending expansion cycle.Sustained absorption near recent lows underscores growing institutional participation,reinforcing the probability of continued upward repricing.Trading volume remains consistent,reflecting controlled demand rather than speculative inflow.The overall market tone supports a constructive bias,with expectations aligning toward a progressive recovery phase and potential continuation of the broader bullish trajectory.

#SOL/USDT chart (1-hour timeframe)...#SOL
The price is moving in a descending channel on the 1-hour frame and is expected to break and continue upward.
We have a trend to stabilize above the 100 moving average again.
We have a downtrend on the RSI indicator that supports the upward move with a breakout.
We have a major support area in green that pushed the price higher at 188.
Entry price: 195.
First target: 200.
Second target: 207.
Third target: 214.
To manage risk, don't forget stop loss and capital management.
When you reach the first target, save some profits and then change the stop order to an entry order.
For inquiries, please comment.
Thank you.

#SOL still has potential for new highs 📊#SOL still has potential for new highs 🚀
🧠From a structural perspective, the daily uptrend and bullish structure remain intact, so we shouldn't be overly bearish. Currently trading near the daily neckline support, the uptrend support line at 170.777 has not yet been tested. Extreme support is near 152.
➡️If further gains are expected, sideways consolidation will be necessary to break this downtrend. Therefore, focus on range-bound trading. Patiently wait for the price to reach its limit before considering trend-based profits.
🤜If you like my analysis, please like 💖 and share 💬
BITGET:SOLUSDT.P

SOL – Short into 215–225 inside descending channel | TP Timeframe: 1D
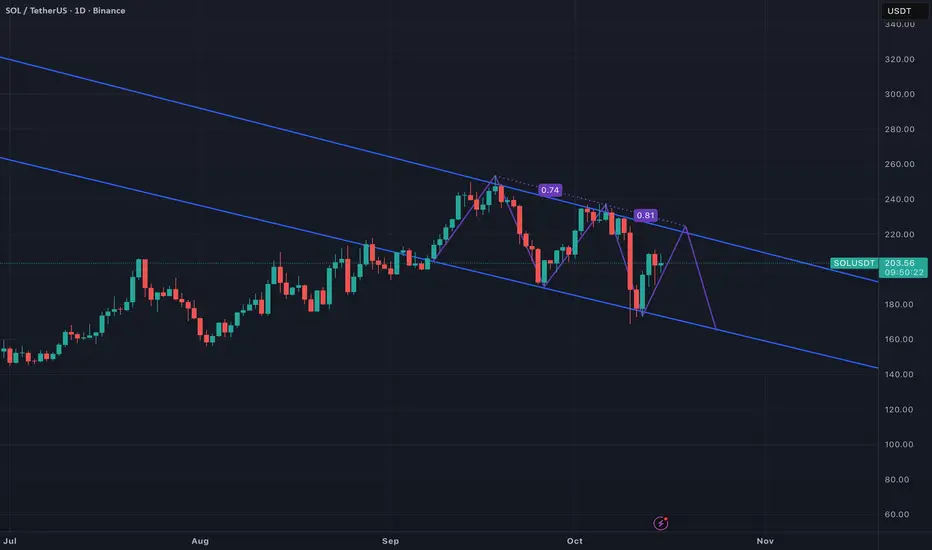
Context: SOL has been printing lower highs/lows inside a clear descending channel since mid-September. Price is hovering around the channel midline and, in my view, likely to “pop” into the upper boundary before the next leg down.
Primary setup (Short):
Entry zone: Scale in on a rejection of 215–225 (upper channel + prior swing confluence).
Confirmation: Daily close rejection (wick/engulfing), loss of intraday support, or momentum/volume fade.
Stop (invalidation): >232 (conservative: 235) above the upper channel and last LH.
Targets:
T1: 195 (channel midline)
T2: 185
T3: 170 (lower channel)
Trade management: Take partials at T1/T2 and trail to breakeven; aim for ≥2R.
Alternative (bullish breakout):
If we get a daily close >232 with follow-through and 220 holds as support, the short idea is invalidated. Consider a long on retest with:
Targets: 245 → 260 area
Invalidation: Back below 220.
Why this idea:
Well-defined down-sloping channel; prior rally-fades (0.74 and 0.81 swings) show repeated supply near the upper boundary.
Clean risk box with clear invalidation above 232 and asymmetric downside to 170.
Horizon: ~1–3 weeks, depending on when the upper-band retest occurs.
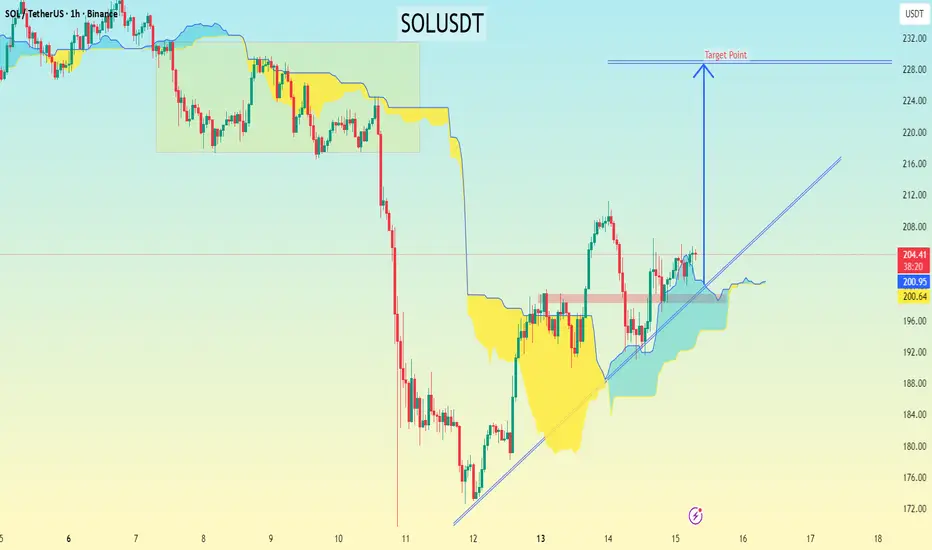
SOLUSDT chart (1-hour timeframe)...SOLUSDT chart (1-hour timeframe), here’s a detailed breakdown of the setup and the potential target based on the price structure and Ichimoku setup:
---
🔍 Chart Observations
Current price: around $205
The price has broken above the Ichimoku Cloud, confirming a short-term bullish bias.
A rising trendline from the $180 area is providing strong support.
The “Target Point” label I have drawn sits roughly around $230–232.
The cloud (Kumo) is bullish and widening, suggesting potential continuation upward.
---
🎯 Target Levels
Based on structure and Ichimoku confirmation:
1. First target (short-term): $212 — local resistance area / psychological level
2. Main target: $228–232 — aligns perfectly with my chart’s “Target Point” label and previous swing-high zone
3. Extended target (if momentum continues): $240 — strong resistance from the last consolidation before the drop
---
🛑 Stop-Loss Suggestion
Below the trendline or the Kumo support: around $198–200
(A clean break below this would invalidate the bullish setup.)
---
⚖ Trade Plan Summary
Type Entry Stop Target 1 Target 2 Risk:Reward
Long $204–206 $198 $212 $228–232 ~1:2.5–1:3
---
📈 Summary:
Trend = Bullish
Entry = On retest of $202–205 area
Target = $228–232
Stop = Below $198
SOL-USDTFor today, if it can break above its fixed resistance at $200, it could continue its upward move towards $226.

SOL ; BUY OR SELL ?Hello friends
Given the decline we had, we can see it as an opportunity to buy at lower prices with risk and capital management.
Now we have obtained support levels for you and we have an important resistance that the price must break strongly to make the climb valid for us.
The goals are also clear.
*Trade safely with us*

SOLUSDT – Weak rebound, bears back in controlAfter a sharp drop on October 14, Solana made a slight recovery but quickly hit resistance at the downtrend line — where sellers stepped back in strongly. The $208 zone continues to act as a tight lid on price action, signaling that current buying pressure isn’t strong enough for a reversal.
With U.S.–China trade tensions still simmering, the overall crypto market — including SOL — remains under pressure. If the price fails to break above this descending trendline, SOL could likely fall back toward the $188 support zone, or even $175 in the next move.
In short, the main trend remains bearish, and current rebounds look more like opportunities for sellers to reload for the next push downward.

Solana Post ETF approval RallyBINANCE:SOLUSDT is expected to show a strong market rebound due to its ETF approval this week. The price may even climb above the previous high of $254 due to FOMO led buying.
SOL; Trend Breakout.Hello Traders..
Lets take a look at SOLUSDT..it reveals to have been moving on a circle momentum of Uptrend for this couple of days, which after failing to hold and detain into this region. The price fell and broke the higher lows zone there by triggering it to go below the down division area.
We are considering a target at sections of $155-$125 as the next potential support.
Thanks for reading

Solana Recovery: Watching 178.2 Solana is also showing price recovery after last week’s crash. The key level to maintain the upward correction is 178.2 . Volatility will likely decrease to previous levels over the next few days.
Support lies in the 168.8–175.5 range — in this area, I expect a quick recovery above 178 , otherwise, the decline may continue toward 155 . Resistance is in the 216–224 range, but the price has already reacted from the 200 level, so I’m watching for a potential breakout of the current high.

Sol Next StepsBINANCE:SOLUSDT SOL is expected to retrace from $195 toward $175–160, possibly dipping into the $140–150 weekly buy zone before reversing. The chart outlines a bearish correction within a larger bullish structure, targeting $213–222 then $240+. SMA confluence and liquidity zones support a mid-term accumulation before breakout.

Support around 212.91 is crucial
Hello, fellow traders.
By "Following," you'll always get the latest information quickly. Have a great day today.
-------------------------------------
(SOLUSDT 1W Chart)
The chart may look complicated due to the drawn lines, but the key is whether the price can rise above the boxed area.
In other words, whether the price can rise above the 179.53-237.60 range and maintain its upward momentum is crucial.
-
(1D Chart)
The HA-Low indicator on the 1D chart is showing signs of forming at the 212.91 level.
Therefore, if support is confirmed around 212.91, it would be a good time to buy.
However, the HA-High ~ DOM (60) range has formed in the 236.88-237.60 range, so we need to see if it can break above this range.
If the upward breakout fails, it's time for a partial sell-off.
-
To continue the uptrend by breaking above a key zone or point,
1. The StochRSI indicator must be trending upward. If possible, it should be below the overbought level.
2. The On-By-Value (OBV) indicator must be trending upward. If possible, it should remain above the High Line.
3. The TC (Trend Check) indicator must be trending upward. If possible, it should remain above the 0 level.
If the above conditions are met, the uptrend is likely to continue.
-
Thank you for reading to the end.
I wish you successful trading.
--------------------------------------------------
