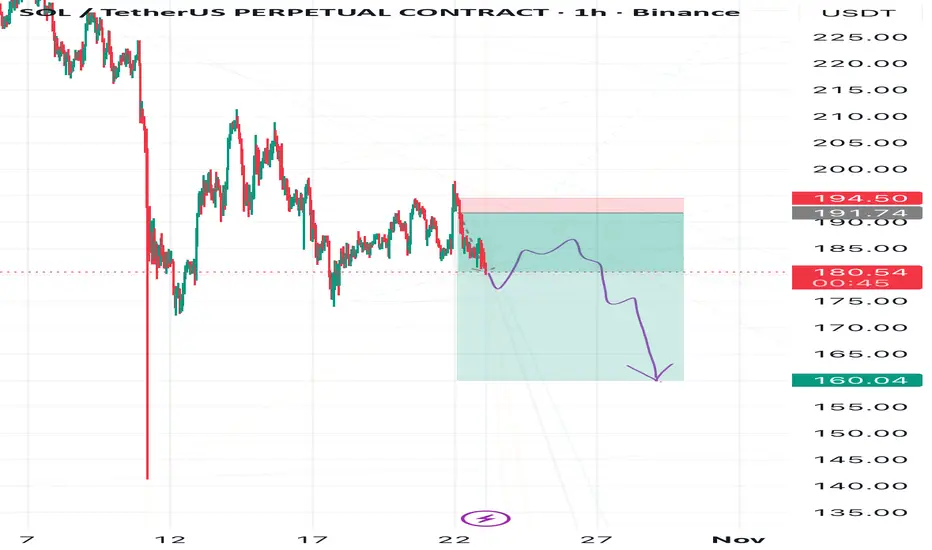
Don’t Trust the Twist — Solana’s Fall May PersistBe careful with Solana — the market might trick you into thinking a bullish reversal is forming.
In reality, the downtrend hasn’t finished yet.
A descending triangle is forming, and the breakout could be strongly to the downside.
🎯 Targets:
1️⃣ 164
2️⃣ 156
3️⃣ 138
❌ Invalidation: if price reaches the red zone marked on the chart
Trade ideas
SOLCRYPTOCAP:SOL could dip to around $150 again, maybe just a quick wick before reversing. I think that move would be short-lived and followed by a strong 160% rally toward $420. It’s shaping up to be a great opportunity for patient entries before the next breakout wave.

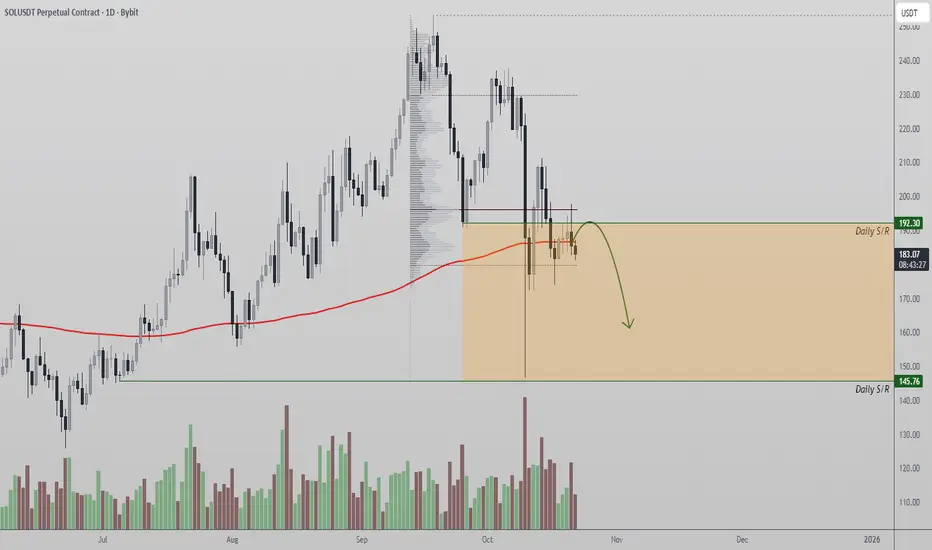
Solana Faces Strong Rejection at $192 ResistanceSolana price action is struggling to gain momentum above the $192 level, a critical zone packed with strong technical confluences. This region houses both the 200 Exponential Moving Average (EMA) and the Point of Control (POC), making it a decisive battleground for market participants.
The inability to reclaim this region suggests that bullish momentum remains limited in the short term. A rejection from this resistance could invite a deeper corrective phase, especially if buying pressure continues to fade near current levels.
Key Points:
- Major Resistance: $192, aligning with both the 200 EMA and POC, acting as a technical ceiling.
- Structural Weakness: Failure to reclaim this level limits upside continuation.
- Downside Target: Next high-timeframe support sits near $145, offering potential re-entry interest.
From a technical standpoint, Solana must close decisively above $192 to confirm strength and invalidate the current rejection bias. Until then, price remains vulnerable to a retracement toward lower liquidity zones.
What to Expect:
Expect further consolidation or minor pullbacks while below $192. A rejection from this region could accelerate a rotation toward $145, whereas a confirmed breakout would reestablish a bullish trajectory toward $210–$220.
Solana (SOL): Waiting For Ideal Buy Entry | Could Bounce +30%Looking for a long on SOL coin with our most famous strategy—wait for a break of structure/retest/another break of structure.
More in-depth info is in the video—enjoy!
Swallow Academy

SOL is the next big move? While Bitcoin is in a strong correction, bearish sentiment is reaching the highest levels in recent months, and alts are dropping to zero. It seems like the entire crypto market is dead — but is that really the case?
In fact, SOL is now the most bullish top token on the market, and it may try to update its ATH already this year. Here’s why:
➡️ While Bitcoin has already broken its structure, SOL still maintains its textbook-bullish structure, forming HH and HL.
➡️ The price continues to move in an ascending channel, while Bitcoin long ago broke down its ascending support and went significantly lower.
➡️ Money Flow shows a divergence with the price and an outflow of liquidity since July. But this happened across the market due to profit-taking after the summer rally.
➡️ Supply and demand analysis shows that there is still high demand for SOL even around current prices. Whereas in Bitcoin there is no demand at all until lower levels, and supply significantly prevails there.
➡️ SOL has almost completely closed the GAP from the drop, and a small range remains at $221–$209, which the price may want to test in the near future.
➡️ There is also a huge GAP above, which continues to attract the price.
Conclusion:
While BTC has already played out all catalysts to the maximum and is simply exhausted, with no liquidity to drive the price higher, and ETH’s rally died before it even started, SOL still maintains a bullish structure even in such periods.
🔥 Moreover, more time has passed since its last ATH than for BTC and ETH, since SOL was one of the first to move the market in this cycle. And most importantly — a decision on the SOL ETF is expected in November. I don’t expect billion-dollar inflows right away, but this is definitely a bullish catalyst toward the end of the year.

SOL ; What can be done?Hello friends
Given the decline we had, the price has been moving in an ascending channel for some time now, and now that the price is at the bottom of the channel and is on an important move, we can buy one step with risk and capital management, and in case of further correction, we can buy another two steps down and move with it to the specified targets.
*Trade safely with us*
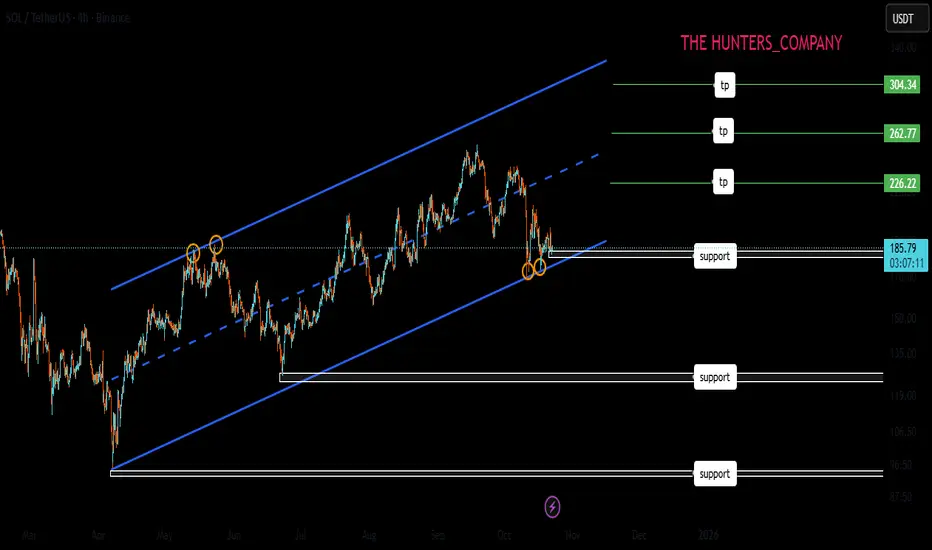
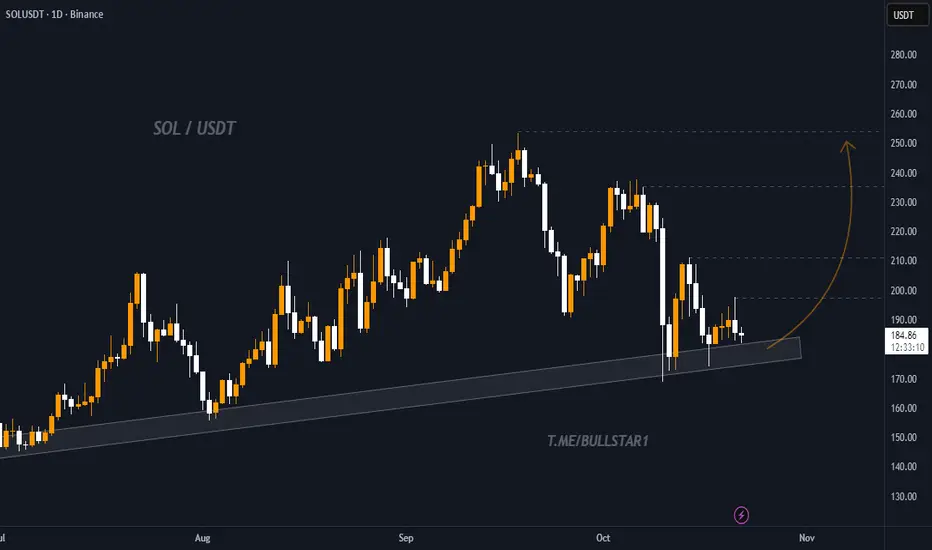
SOL / USDT – Retesting Key Trendline Support, Potential ReversalSolana (SOL) is currently retesting a strong ascending trendline that has held as support since mid-2024. The price recently bounced around the $175–$185 zone, which has acted as a major demand area multiple times in the past.
If the trendline holds, SOL could start a new upward move targeting:
- $210 – first resistance and short-term target
- $230 – medium-term resistance
- $250 – potential swing target
A daily close below the trendline or under $170 would invalidate the bullish scenario and open room for a deeper correction.
Overall, SOL remains in a long-term bullish structure as long as it stays above the trendline support.
#solana $sol long TRADENATION:SOLANA #SOLUSDT Update 🚀
london has taken out asia low ,
expect us to now move higher after this manipulation move
Trade Plan:
Longs: Above 184.80 with stop at 184.20
Adds: Break & close above 185.50
Targets: 186.50 → 188.00

SOL market snapshotSOL potential trend reversal Head & Shoulders pattern will be confirmed if the $110-120 zone is broken. Everything above this level can still be considered a bullish consolidation, with a range size of around 120%. A breakout above $250 most likely send the price toward $500

#SOL still has potential for new highs 📊#SOL still has potential for new highs 🚀
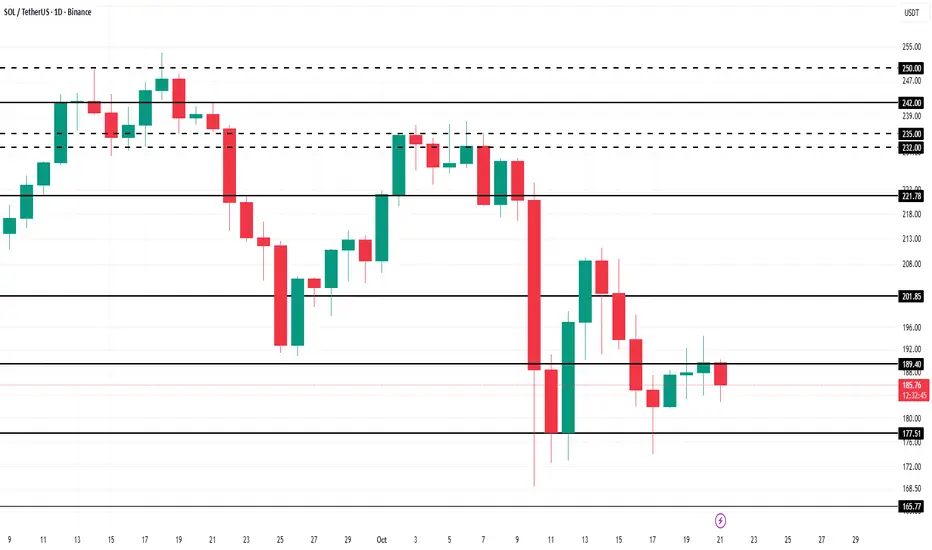
🧠From a structural perspective, the daily uptrend and bullish structure remain intact, so we shouldn't be overly bearish. Currently trading near the daily neckline support, the uptrend support line at 170.777 has not yet been tested. Extreme support is near 152.
➡️If further gains are expected, sideways consolidation will be necessary to break this downtrend. Therefore, focus on range-bound trading. Patiently wait for the price to reach its limit before considering trend-based profits.
🤜If you like my analysis, please like 💖 and share 💬
BITGET:SOLUSDT.P

Solana is undervalued | New ATH coming very soon | $250++Solana is slowly but surely grinding up, following the altcoin king ETH. ETH is already near its 2024 highs of $4000. If SOL were to be in the same position as ETH in terms of price, we should be around $250.
In technical terms, SOL is showing huge bullish strength at the $180 resistance. In the last attempt in breaking above this level, it faced multiple rejections and consolidated before ultimately backing down. This time, there is little to no resistance.
The REX-Osprey SOL staking ETF continues to garner inflows, having only one outflow day since the launch date 2nd July. That's nearly $100 million net inflows and 11 inflow days out of 12 trading days. Imagine the demand the spot SOL ETF by big players such as VanEck, Grayscale and Fidelity will have once approved.
BTC dominance is breaking below 60%. Capital is flowing from BTC into ETH, and once ETH hits $4000, a good amount will flow from ETH to SOL as people look for better potential gains.

I've played these games before!1. MA crossover and price retests the 50MA.
2. Price consolidates.
3. Higher high is printed.
Traders FOMO here.
4. Higher low forms below #2 consolidation zone between the 50MA and 200MA.
Traders are liquidated. Max fear period.
5. Lower high is printed.
Traders FOMO here.
6. Price retests the 200MA.
Traders are liquidated. Max fear period.
7. Massive leg up.
The first rally was driven by Trump's inauguration. What will it be driven by this time? The end of the US government shutdown, ETF approval, interest rate cuts, quantitative easing, institutional interest, US-China trade deal, or capital rotation from traditional investment vehicles to crypto...? Take your pick.

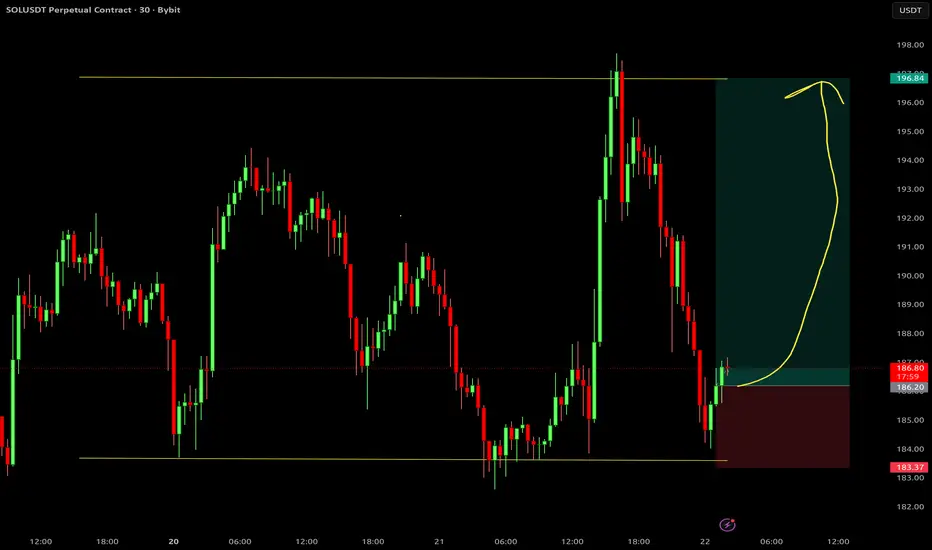
SOL Quick Bounce on Local Range SupportA local bottom with 30m range touched. Expected bounce to the upper range
Solana on the Edge: Will the Downtrend Continue?Solana has broken its key long-term uptrend, signaling increased selling pressure.
In the short term, the coin remains in a dynamic downtrend, and any minor rallies face resistance.
Indicators suggest the possibility of further correction; short-term traders should stay cautious and manage risk carefully.
Crypto markets move fast—always prioritize risk management.

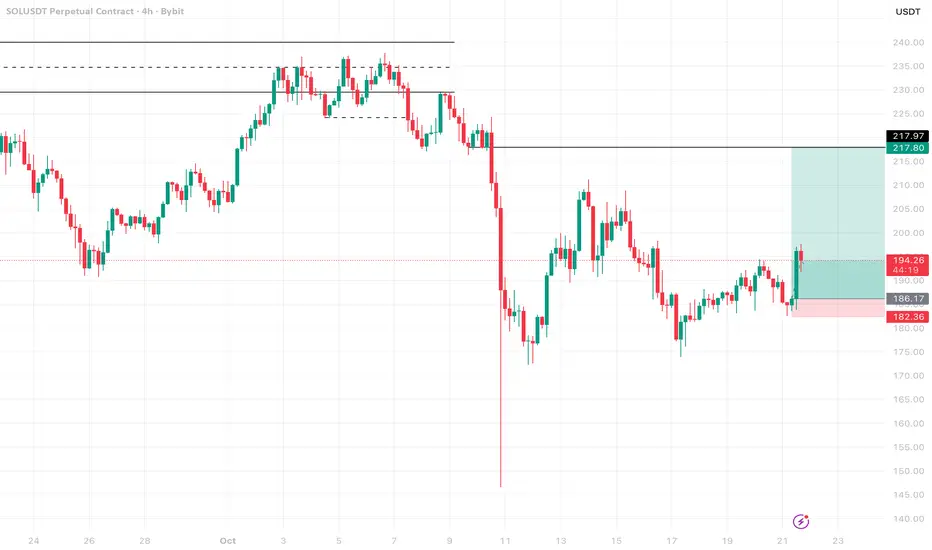
SOL – Strength Isn’t Noise, It’s Signal.Most traders hesitate when price pulls back. I look for confirmation.
SOL held structure, reclaimed momentum, and showed real strength.
Break and retest ✅
Momentum shift ✅
Tight risk, strong upside ✅
I’m long — small risk, high reward.
This isn’t guessing, it’s execution.
Would you have caught this move or waited for someone else to call it?
SOL LONG : HELLO BULL RUNSOL Price finds support at 0.618 fib eliminating thoughts of a bearish setup.
Time for price to start its move to $500.
First stop : 266 - 250

SOLCRYPTOCAP:SOL price action is tightening up with a solid base forming at support, looking strong each time it’s tested. This compression phase usually precedes a breakout. $420 remains the clear target and looks highly achievable within the next 200 days.

SOLANA BUSSING n SETTING UP sol play : Get IN wif me : we going higher after this lil shake out : THANKS CZ N TRUMP:

Solana Price May Have A Shot At $250, But Caution AdvisedAt the time of writing, Solana’s price stands at $184, holding above the crucial $183 support. The altcoin appears to be forming a flag pattern, a technical setup often associated with bullish breakouts. However, confirmation will depend on volume strength and investor conviction.
Following the recent crash, SOL briefly dropped out of this pattern before testing and validating it again. For a clear breakout, Solana needs to bounce off the lower trendline or move past $192. Failure to sustain buying pressure could drive the token below $175, potentially falling to $163, invalidating the bullish pattern.
Conversely, if Solana breaches $192, it could surpass $200, a key psychological barrier. Breaking out from the pattern could ignite renewed momentum, setting the stage for a potential surge toward $250. Nevertheless, investors and traders should proceed with caution given the current market fragility.
$sol 1hr long setup Market Structure: Higher highs/lows intact - bullish continuation pattern
Liquidity Grab: Recent dip to $182.74 likely swept sell-side liquidity below previous low
Optimal Trade Entry: Current zone around $185-186 presents potential long entry
BILL WILLIAMS ALLIGATOR CONFIRMATION:
Price currently trading ABOVE the Alligator's lips/jaws (bullish alignment)
TRADE PLAN:
Entry Zone: $185.00 - $185.50 (with confirmation)
Stop Loss: Below $182.50 (respecting market structure)
Targets:
TP1: $187.11 (immediate FVG)
TP2: $190.00 (psychological + structural)
TP3: $193.78 (swing high extension)
RISK MANAGEMENT:
Position size according to 1-2% risk rule

SOL-USDTIn order for Solana to be bullish, it must break the downtrend line, in which case it can start climbing towards $200. 🪙🪙
Solana's reliable bottom is $175

[SeoVereign] SOLANA BEARISH Outlook – October 21, 2025Hello everyone,
This idea is connected to the one shared on the 19th.
I am still holding the short position that was entered based on the October 19 idea, and since some of the underlying reasons have been slightly revised, I’m sharing this as an additional update.
Today, as of October 21, I would like to present my bearish (short) outlook on Solana.
Basis — BEARISH BAT PATTERN / BEARISH 1.13 SHARK
Solana is currently located in a zone where the Bearish Bat Pattern and the Bearish 1.13 Shark Pattern overlap simultaneously.
Both patterns are typical top reversal structures that form in upper regions,
and after the price entered the PRZ (Potential Reversal Zone), it has lost additional upward momentum and is suggesting the possibility of a bearish reversal.
In particular, the completion area of the 1.13 Shark Pattern almost perfectly coincides with the PRZ of the Bat Pattern,
and this structural confluence between the two patterns is generally interpreted as a classic reversal zone where selling pressure tends to strengthen.
Therefore, the current area is considered a valid sell zone, with a high probability of a reversal from the overheated region.
Accordingly, I set the average target price around 178.69 USDT.
Depending on the future development of the chart,
I will provide further updates regarding position management and any changes.
Thank you.

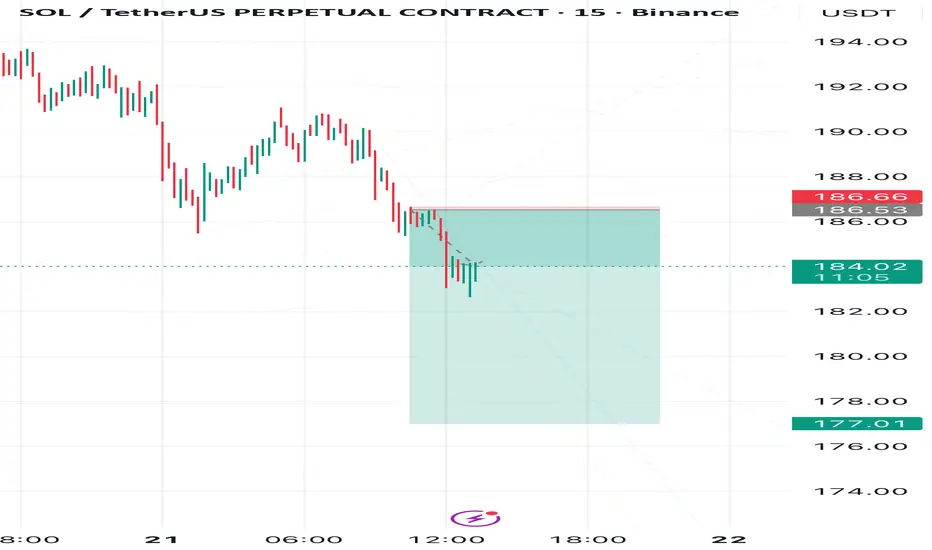
Solana Drop DramaSolana has started its decline as expected. I am now targeting a drop to 177
On the chart, I marked the plan cancellation zone—if price breaks this area, the scenario becomes invalid.