Global Currency Movements (Dollar, Euro, Yen, Yuan)Part 1: The U.S. Dollar (USD) – The Global Kingpin
1.1 Historical Background
The U.S. dollar has been the undisputed global reserve currency since World War II. Before that, the British pound held the crown during the height of the British Empire. But after the Bretton Woods Agreement (1944), the dollar became the anchor of the global monetary system, pegged to gold at $35 per ounce. Even after the Nixon Shock (1971) ended the gold standard, the dollar retained its dominance because of America’s economic size, deep financial markets, and political power.
1.2 Why the Dollar is So Dominant
Reserve Currency Status: Over 58% of global foreign exchange reserves are in USD.
Petrodollar System: Oil and many other commodities are priced and traded in dollars.
Financial Markets: U.S. bond markets are the deepest and most liquid, attracting global investors.
Military and Political Power: The U.S. exerts influence through sanctions, trade deals, and global institutions.
1.3 Movements of the Dollar
The dollar index (DXY) tracks the USD against a basket of currencies (EUR, JPY, GBP, CAD, SEK, CHF). It rises during:
Tight U.S. monetary policy (higher interest rates attract foreign capital).
Global crises (investors flee to dollar as a safe-haven).
Weakness in other currencies (especially Euro and Yen).
It falls during:
Loose monetary policy (printing money, quantitative easing).
High U.S. deficits and debt concerns.
Strong growth abroad (capital flows shift to emerging markets).
1.4 Impact of Dollar Movements
Strong Dollar: Bad for U.S. exporters, good for U.S. consumers (cheaper imports). Hurts emerging markets with dollar-denominated debt.
Weak Dollar: Boosts U.S. exports, fuels inflation at home, but supports global liquidity.
Part 2: The Euro (EUR) – The Challenger
2.1 Birth of the Euro
The Euro was launched in 1999 as a bold project of European integration. Today, 20 of 27 EU nations use the Euro, making it the second-most traded currency after the dollar.
2.2 Strengths of the Euro
Large Economy: The Eurozone has a GDP close to the U.S.
Trade Power: Europe is a major exporter of machinery, luxury goods, and chemicals.
Reserves: Around 20% of global reserves are in euros.
2.3 Weaknesses of the Euro
Lack of Fiscal Unity: Different countries, different budgets, but one currency.
Debt Crises: The 2010–2012 Eurozone debt crisis (Greece, Italy, Spain) exposed structural flaws.
Political Tensions: Brexit and rising nationalism pose risks.
2.4 Euro Movements
The euro’s value against the dollar (EUR/USD) is the world’s most traded currency pair. It rises when:
The European Central Bank (ECB) raises rates.
Europe has strong trade surpluses.
Dollar weakens due to U.S. deficits.
It falls when:
Debt crises or recessions hit Europe.
Energy shocks raise import costs (Europe imports lots of oil & gas).
ECB follows looser monetary policy compared to the Fed.
2.5 Impact of Euro Movements
Strong Euro: Hurts European exports but reduces import costs.
Weak Euro: Boosts exports but fuels inflation (especially energy prices).
Part 3: The Japanese Yen (JPY) – The Safe Haven
3.1 Historical Role
Japan became a global economic powerhouse in the 1970s–80s. The yen was seen as a strong currency due to Japan’s trade surpluses, technological dominance, and manufacturing exports.
3.2 Why Yen is a Safe Haven
High Current Account Surplus: Japan consistently exports more than it imports.
Political Stability: Despite slow growth, Japan is politically stable.
Low Inflation: The yen has maintained purchasing power compared to many currencies.
3.3 Yen Movements
The yen is often linked to carry trades:
Japan keeps ultra-low interest rates.
Investors borrow cheaply in yen and invest in higher-yielding assets abroad.
When global risk sentiment worsens, investors unwind trades, repurchasing yen → yen strengthens.
So the yen tends to:
Strengthen in crises (safe-haven flows).
Weaken when global markets are bullish (carry trades flourish).
3.4 Impact of Yen Movements
Strong Yen: Hurts Japanese exporters like Toyota, Sony, and Panasonic. But lowers import costs (energy, raw materials).
Weak Yen: Helps exporters, boosts inflation, but reduces Japanese consumers’ purchasing power.
Part 4: The Chinese Yuan (CNY/RMB) – The Rising Power
4.1 Historical Transformation
Before the 2000s, the yuan was tightly controlled and not relevant globally. But as China opened up, became the world’s factory, and the second-largest economy, its currency gained importance.
In 2016, the IMF included the yuan in its SDR (Special Drawing Rights) basket, alongside the dollar, euro, yen, and pound—cementing its status as a global currency.
4.2 Controlled Currency
Unlike the dollar, euro, or yen, the yuan is not fully free-floating. The People’s Bank of China (PBOC) sets a daily reference rate and allows it to trade within a band.
4.3 Yuan Movements
The yuan rises when:
China’s trade surplus is strong (exports booming).
PBOC supports stability to attract global investors.
Global demand for Chinese bonds and equities grows.
It weakens when:
China faces capital outflows.
U.S. imposes tariffs or sanctions.
Domestic economy slows down (property crisis, low growth).
4.4 China’s Strategy
China actively promotes the yuan in trade (especially with Belt & Road partners). Many oil deals with Russia, Iran, and Middle Eastern countries are increasingly settled in yuan—challenging the petrodollar system.
4.5 Impact of Yuan Movements
Strong Yuan: Makes Chinese exports less competitive but strengthens China’s global financial credibility.
Weak Yuan: Helps exports but risks capital flight and global accusations of “currency manipulation.”
Part 5: Interplay Between Dollar, Euro, Yen, and Yuan
Currencies don’t move in isolation—they interact.
Dollar vs Euro: Often a mirror image. If dollar rises, euro falls (and vice versa).
Dollar vs Yen: Sensitive to Fed and Bank of Japan interest rate policies.
Dollar vs Yuan: Politically charged, linked to U.S.-China trade tensions.
Euro vs Yen/Yuan: Reflects Europe’s role in Asia trade.
These currencies dominate Forex trading:
EUR/USD → most traded.
USD/JPY → second most traded.
USD/CNY → increasingly important.
Conclusion
The U.S. Dollar, Euro, Yen, and Yuan are not just symbols on forex screens—they are reflections of global power, trade, and politics. The dollar remains king, the euro is a strong but fractured challenger, the yen is a safe haven, and the yuan is the ambitious rising star.
Currency movements will continue to shape the global economy—deciding who gains, who loses, and how wealth shifts across borders. For traders, policymakers, and everyday citizens, watching these four currencies is key to understanding the world’s financial heartbeat.
SOLVUSDT.P trade ideas

SOLV/USDT +100%has been consolidating in a tight accumulation range for an extended period (~6 months), consistently defending the $0.04 support zone. Price action suggests a potential base-building phase, with buyers repeatedly absorbing dips below $0.04 and establishing a clear floor.
A breakout scenario is developing as SOLV attempts to challenge the key resistance at $0.05 ,Above this level will see big push toward $0.09 zone
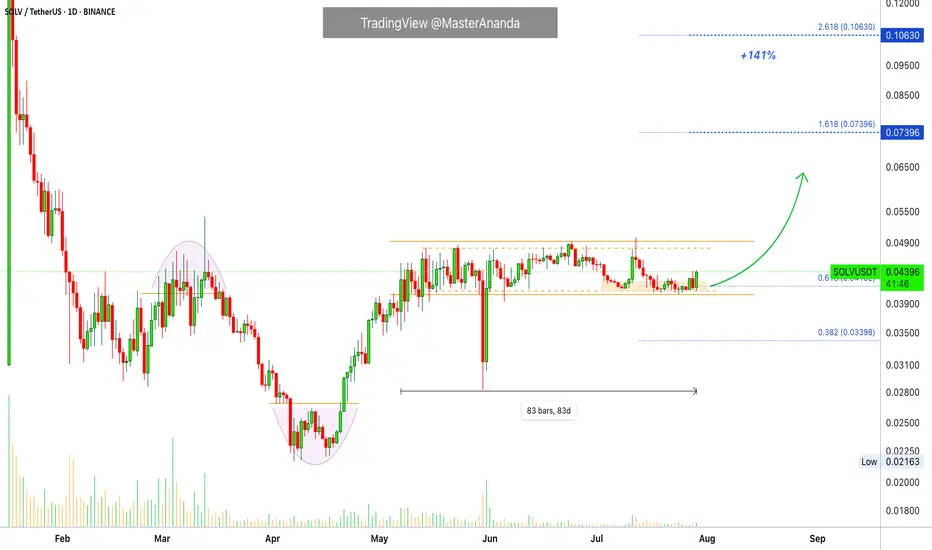
Solv Protocol · Bitcoin Staking · 140% Profits PotentialSolv Protocol has been sideways for 83 days, and it looks ready to rise. The market bottomed in April and afterward has been bullish ever since. It is nice to see how tight the trading range is.
This chart pattern is not very common. When a pair has a chart drawing that is not seen often, it means that it can move differently to others. It can go down while others are going up, but it can also go up while others go down.
The action is happening near the lower boundary of the range, perfect to buy as the action happens near support. When at resistance we can expect a drop; at support, a rise. And here SOLVUSDT seems eager to start rising.
With a close today above 0.04411, we get a strong signal for additional growth. The breakout can happen within a few days but the trend that follows can last for months. Catching the breakout can be nice and fun. Sometimes they reverse though to grow only after a few weeks.
Namaste.
Solv Protocol Conquers Resistance, Easy 120%SOLVUSDT has been creeping higher slowly. It has been challenging resistance for weeks and finally, just today, the major resistance level on this chart breaks. It has been conquered.
SOLVUSDT is now in bullish territory and moving higher. The way I see it goes something like this: There will be a small time window for SOLV to develop bullish force. As soon as prices move higher, just a bit higher, say above 0.05000, bullish momentum will grow and there will be a major jump. The 120% target on the chart is intended for the short-term and should be an easy one.
This is another good chart for short-term profits. Everything altcoins will do great in the coming weeks and days. If you waited patiently, you will be rewarded. If you held through the final shakeout and market flush, you are about to get paid for doing a good job. You deserve all the best and more.
Thanks a lot for your continued support.
Namaste.

SOLVUSDTBullish Trend continuation expectation as there is no bearish divergence till now.
buying instantly
sl last ll
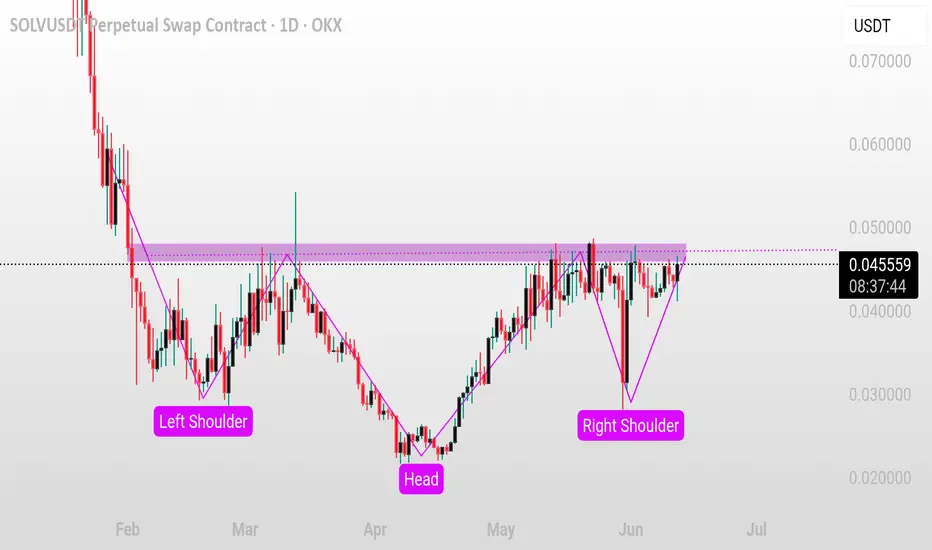
SOLV/USDT – Inverse Head & Shoulders Breakout Setup
Pair: SOLV/USDT 💱
Timeframe: 1D 📅
Pattern: Inverse Head & Shoulders 👕 (Reversal Setup)
SOLV is forming a clean inverse head & shoulders pattern on the daily chart, with the neckline resistance sitting near 0.046–0.047. Price is currently retesting this area, signaling a potential breakout attempt 🔍📈.
Bullish Scenario ✅
A daily close above the neckline (>0.047) with strong volume could trigger a breakout:
🎯 Target 1: 0.060
🎯 Target 2: 0.070
🛑 Suggested SL: below 0.038 (right shoulder low)
Bearish Risk ❌
Rejection from neckline without volume confirmation may lead to another pullback toward the 0.038–0.035 zone.
⚠️ Let the pattern complete — confirmed breakout only!
SOLVUSDT Forming a Bullish waveSOLVUSDT is showing a strong bullish wave pattern after an extended downtrend, suggesting that it may have completed its accumulation phase. The chart clearly illustrates a double-wave reversal formation with higher lows, pointing toward a bullish continuation. The recent breakout candle combined with solid trading volume indicates renewed market interest and a possible start of a major uptrend. Based on the structure, a potential move of 90% to 100% from current levels seems realistic, as highlighted in the price projection zone.
Solv Protocol, the project behind SOLV, has been making strides in the decentralized financial instrument space, particularly around tokenized vouchers and structured assets. With increasing on-chain activity and protocol developments, investor sentiment appears to be turning positive again. SOLV’s listing on major exchanges like Binance further supports the legitimacy and growing traction of the token. As crypto markets rotate capital into emerging sectors, tokens like SOLV are gaining more visibility.
From a technical perspective, SOLVUSDT has broken out from a significant descending channel, forming a base with strong upward momentum. Each retracement is being bought up quickly, confirming bullish strength. If the price holds above key support zones, the upside continuation may play out rapidly as traders and algorithms begin to follow the breakout signal.
With bullish market structure, increasing investor attention, and favorable tokenomics, SOLVUSDT looks poised for a powerful upward run. This is one of the more promising setups for traders looking to ride a fresh wave with high risk-reward potential.
✅ Show your support by hitting the like button and
✅ Leaving a comment below! (What is You opinion about this Coin)
Your feedback and engagement keep me inspired to share more insightful market analysis with you!

Study SOLV strength!Study SOLV strength! Fully recovered
Once it flips trendline, then no one will be able to stop it.

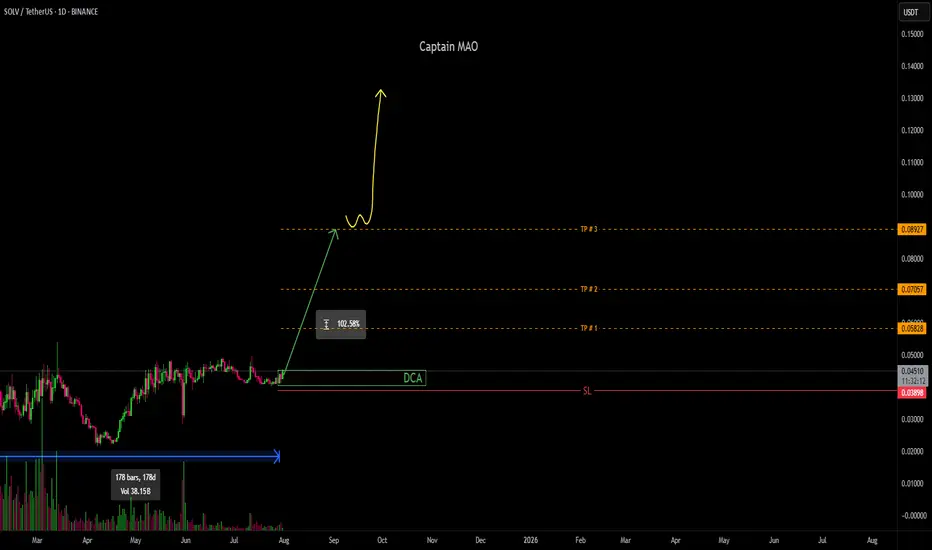
SOLV/USDT – Coiled and Ready to Launch?
Good morning!!
SOLV is quietly building strength under the radar. After weeks of compression, price action is forming a clean ascending channel with increasing volume and RSI momentum. It just broke above the 4EMA and is now pressing into the $0.0388 level — potentially prepping for a breakout.
📈 Key Technicals:
EMA 4 & 20 (black & green) flipping bullish – short-term structure is turning positive.
RSI at 65.19 and climbing steadily, showing sustained buying interest.
Price riding the EMA curve after reclaiming the descending resistance — a classic pre-breakout setup.
🛠️ Entry Ideas:
Aggressive entry: At current breakout levels ($0.0388) with volume confirmation.
Safer entry: On pullback and bounce from the $0.0350–$0.0360 zone (EMA & trendline confluence).
📌 Validation:
Bullish thesis valid as long as price stays above the $0.0330 area.
Breakdown below this would invalidate the ascending structure.
🎯 Target Zones (based on structure & historical S/R):
TP1: $0.0542 – local horizontal resistance and psychological barrier.
TP2: $0.0793 – volume gap fill zone; blue box = key liquidity pocket.
TP3: $0.0866 – strong resistance zone from earlier March spike.
🧠 Final Take: SOLV is showing accumulation behavior with tightening price action, increasing RSI, and EMA support. A clean breakout from here could kick off a fast move toward $0.05 and beyond.
Good trading !!!

SOLV/USDT – Ready for TakeoffSOLV has been building under the surface and now everything’s aligning. The blue box down below is where buyers will likely step in. Volume’s been creeping up, CDV is showing a bullish divergence, and on the one- and five-minute charts you can already spot the structure you want to see before a move.
Here’s the plan:
• Watch for a quick dip into that blue zone
• Look for a surge in volume that outpaces recent selling
• Check that CDV lines up with the volume spike
• On your low-timeframe chart, wait for a small break below the box followed by a reclaim backed by aggressive bids
When all three things line up—volume, CDV confirmation, and that break-retest on the low timeframe—it’s time to get involved. If you jump in before any of those signals show up, you risk getting caught when price slips through. But if it never happens, don’t force it.
Miss this move and you’ll probably kick yourself later. See it play out exactly like this and you’ll be glad you waited for the green light. Let’s see if that zone lights up.
📌I keep my charts clean and simple because I believe clarity leads to better decisions.
📌My approach is built on years of experience and a solid track record. I don’t claim to know it all but I’m confident in my ability to spot high-probability setups.
📌If you would like to learn how to use the heatmap, cumulative volume delta and volume footprint techniques that I use below to determine very accurate demand regions, you can send me a private message. I help anyone who wants it completely free of charge.
🔑I have a long list of my proven technique below:
🎯 ZENUSDT.P: Patience & Profitability | %230 Reaction from the Sniper Entry
🐶 DOGEUSDT.P: Next Move
🎨 RENDERUSDT.P: Opportunity of the Month
💎 ETHUSDT.P: Where to Retrace
🟢 BNBUSDT.P: Potential Surge
📊 BTC Dominance: Reaction Zone
🌊 WAVESUSDT.P: Demand Zone Potential
🟣 UNIUSDT.P: Long-Term Trade
🔵 XRPUSDT.P: Entry Zones
🔗 LINKUSDT.P: Follow The River
📈 BTCUSDT.P: Two Key Demand Zones
🟩 POLUSDT: Bullish Momentum
🌟 PENDLEUSDT.P: Where Opportunity Meets Precision
🔥 BTCUSDT.P: Liquidation of Highly Leveraged Longs
🌊 SOLUSDT.P: SOL's Dip - Your Opportunity
🐸 1000PEPEUSDT.P: Prime Bounce Zone Unlocked
🚀 ETHUSDT.P: Set to Explode - Don't Miss This Game Changer
🤖 IQUSDT: Smart Plan
⚡️ PONDUSDT: A Trade Not Taken Is Better Than a Losing One
💼 STMXUSDT: 2 Buying Areas
🐢 TURBOUSDT: Buy Zones and Buyer Presence
🌍 ICPUSDT.P: Massive Upside Potential | Check the Trade Update For Seeing Results
🟠 IDEXUSDT: Spot Buy Area | %26 Profit if You Trade with MSB
📌 USUALUSDT: Buyers Are Active + %70 Profit in Total
🌟 FORTHUSDT: Sniper Entry +%26 Reaction
🐳 QKCUSDT: Sniper Entry +%57 Reaction
📊 BTC.D: Retest of Key Area Highly Likely
📊 XNOUSDT %80 Reaction with a Simple Blue Box!
📊 BELUSDT Amazing %120 Reaction!
📊 Simple Red Box, Extraordinary Results
I stopped adding to the list because it's kinda tiring to add 5-10 charts in every move but you can check my profile and see that it goes on..

SOLV Looks Bearish (8H)SOLV appears to be completing an ABC or WXY pattern.
Recently, it lost a trendline, which is a significant bearish signal.
If it loses the white box, it could enter a heavy drop phase.
A daily candle closing above the invalidation level will invalidate this analysis.
For risk management, please don't forget stop loss and capital management
Comment if you have any questions
Thank You

Will SOLV pump more? (4H)It seems that a wave A has completed, and wave B has started from the point where we placed the green arrow on the chart.
This wave appears to be a diametric, and we are currently in its wave e.
The red zone is a supply zone that is fresh and untouched. This zone could complete wave e of B, leading us into wave f of B.
A daily candle closing above the invalidation level will invalidate this analysis.
For risk management, please don't forget stop loss and capital management
Comment if you have any questions
Thank You

SOLVUSDT → Retest of resistance in a bearish trendBINANCE:SOLVUSDT is strengthening within a neutral range, which is formed amid a downtrend. Cryptocurrency market quickly sells off potential after Sunday's news
Bitcoin is back to the selling zone, under the 90K area. A subsequent decline in the flagship could negatively impact the entire market.
SOLV is forming a range of 0.044 - 0.0292. The price is strengthening and tends to the zone of interest and liquidity. Against the background of key preconditions (downtrend, weak market, absence of driver, falling bitcoin) we can assume that the coin has no potential for further growth and the current maneuver may end up with a false break of resistance followed by a fall.
Resistance levels: 0.0436, 0.0439, 0.0494
Support levels: 0.0369, 0.0345
From the opening of the session, the daily ATR will be exhausted by the time resistance is reached, thus there will be no potential for resistance breakout. High probability of a bounce from 0.0436-0.0439 with the purpose of further fall to the key zones of interest located below.
Regards R. Linda!

SOLVUSDT 1H – Bearish Setup with TP LevelsSOLVUSDT is testing a key resistance level and could reject from here. I'll be targeting lower levels for potential scalps.
Key Levels:
📌 Resistance: Watching reaction near 0.03500
📌 TP1: 0.03250
📌 TP2: 0.03100
📌 TP3: 0.02768
Risk Management:
⚠️ Trading is risky! No setup is 100% correct. Manage your risk properly.

BUY SPOT SCALPING SOLVUSDT SIGNAL🚀 BUY SPOT SCALPING SOLVUSDT SIGNAL
📢 Short-term scalping opportunity for SOLVUSDT – Cashflow strategy for quick profits!
📌 Strategy & Trade Plan
✔ Scalping Spot Trade with a 1-2 day execution window
✔ Targeting 30-60% profit, depending on market momentum
✔ Signal expires automatically after 1-2 weeks if the target is not met
📌 Trade Plan
📍 Trade Type: Scalping Spot (Cashflow Strategy)
📍 Entry Point: $0.0395 or lower if possible
📍 Target: $0.051 (~40-60% profit)
📍 Hold Time: 1-2 weeks, after which the signal is automatically invalidated
💡 Key Considerations
📍 Monitor price action closely for the best entry and exit timing
📍 Exit early if momentum weakens before reaching the target
📍 Use stop-loss to protect capital and secure profits
🔥 SOLVUSDT is setting up for a high-reward scalping trade – Act quickly to capitalize! 🚀

SOLVUSDT Perpetual Contract | Bybit | 1H TFCurrently testing the lower boundary of the channel. If the first orange support level at 0.03377 breaks, the next target is 0.02672. If it holds, I’ll close the position.
Watching for a decisive break before confirmation.
