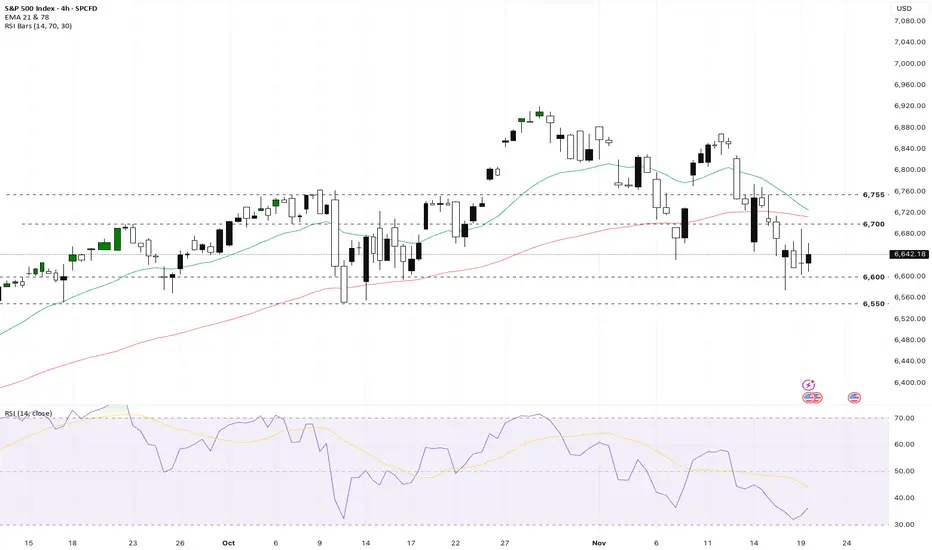
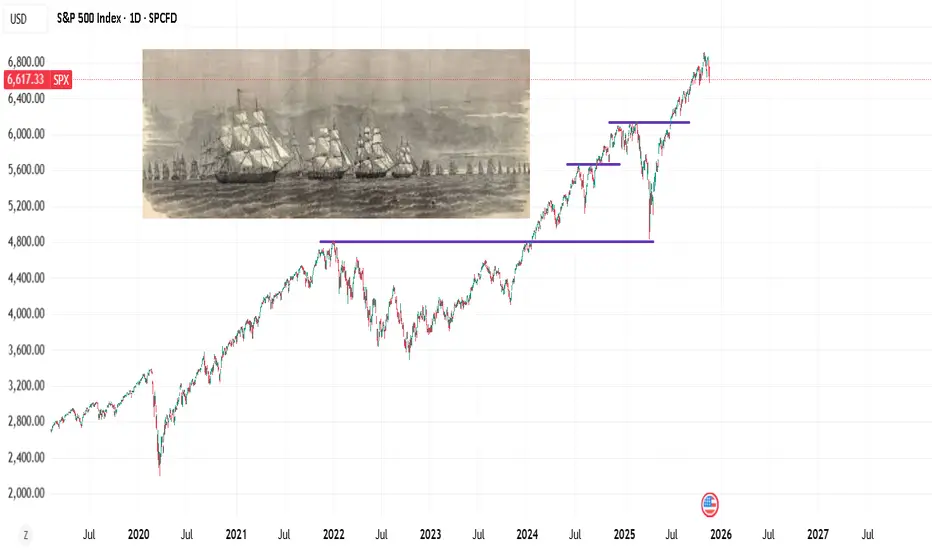
S&P 500 — Double Top Setup by FRLThe market remains in an uptrend, but FRL highlights a critical moment.
Price is testing the origin of the last impulse — the key FRL level that separates continuation from reversal.
A confirmed close below this level will complete the double-top formation and shift the trend into a corrective phase.
If confirmation comes, the natural FRL target lies at the 0.618 retracement, which aligns with the 200-day SMA — a strong confluence support.
Previous similar FRL setup (fully played out):
Nasdaq 100: Double Top or Double Bottom? (FRL Setup)
Trade ideas

US500 Post-Nvidia Earnings: A Cautiously Optimistic RevivalThe release of Nvidia's robust quarterly earnings will serve as a critical pivot point for the US500, temporarily dispelling acute market anxieties that led to a recent four day losing streak. The overall outlook shifts from one of pre-earnings jitteriness and valuation concerns to cautious optimism driven by fundamental strength in the dominant tech sector.
Fundamental Analysis: AI Momentum Validated
The core of the market's positive reaction lies in the fundamental validation of the Artificial Intelligence (AI) mega-trend, which Nvidia remains the central, high-beta bellwether for.
Robust Financial Performance: Nvidia is expected to deliver a significant beat, reporting Q3 revenue of $54.9 billion, a staggering 57% year-over-year increase and providing bullish Q4 guidance of $62.2 billion in projected revenue, alongside strong EPS.
Sector Wide Relief: These numbers directly address the market's key worry, whether the elevated valuations of tech stocks, particularly those linked to AI, were justified. The massive revenue and growth trajectory from the AI chip leader suggests that the capital expenditure cycle in data centers and AI infrastructure remains incredibly strong.
The Valuation Dilemma: While the results provide support, the broader US500's valuation remains elevated at approximately 25 times earnings. This suggests that while the growth engine of AI/Tech is firing on all cylinders, the market's pricing leaves little room for error. The fundamental analysis suggests that the current rally must be consistently backed by strong economic data or further aggressive growth from the largest companies.
Technical Analysis: Battle at Resistance
The price action of the US500 suggests a recovery is underway, but key technical hurdles must be overcome to confirm a re-establishment of the medium-term uptrend.
Recovery and Support: The index successfully recovered from multi-day losses, with immediate support forming near 6,600. This area, combined with the technical floor from the recent pullback at 6,574, is now viewed as the crucial dip-buying zone for bulls seeking trend stability.
Overhead Resistance: The immediate technical challenge for the US500 is the resistance 6,700. A decisive breakout above this level is mandatory to trigger fresh buying momentum and signal a potential move toward testing recent all-time highs.
Volatility Remains High: The recent spike in the Volatility Index (VIX), which touched 22, highlights that despite the positive catalyst, the market structure remains highly volatile. Traders are still anticipating sizable moves, indicating that the index is not yet in a period of calm, sustained advance. The overall medium-term uptrend is intact above key support but is vulnerable to renewed profit-taking.
Sentiment Analysis & Outlook: Relief vs. Lingering Risk
Market sentiment has shifted from anxiety to a sense of relief and renewed optimism, but deep seated macro risks prevent euphoria.
The AI Bubble Fear Eases: Nvidia's expected strong performance has temporarily quieted concerns about an imminent "AI bubble" or a broader market correction led by tech weakness. Momentum stocks, especially semiconductors and megacap tech, are enjoying a strong tailwind.
Macro Risks on the Horizon: The market's focus will quickly pivot to non-tech catalysts, specifically interest rates and the highly anticipated delayed jobs report later this week. Any downside surprise from this key economic data could immediately negate the tech-driven positive sentiment.
Near-Term Outlook: The outlook is for cautious stabilization and the potential for modest further gains. For the US500 to sustain a rally and target new highs, it must achieve two things:
Technical Confirmation: Sustain above the 6,600 support and successfully break the 6,700 resistance.
Macroeconomic Alignment: The upcoming economic data must not present a surprise that forces the market to re-evaluate the Federal Reserve's policy path.
Nvidia has bought the market time and provided a strong catalyst. The US500 is breathing a sigh of relief, but the path forward remains highly sensitive to macro news flow and the resilience of the AI trade outside of this singular earnings report.
This analysis is by Terence Hove, Senior Financial Markets Strategist at Exness
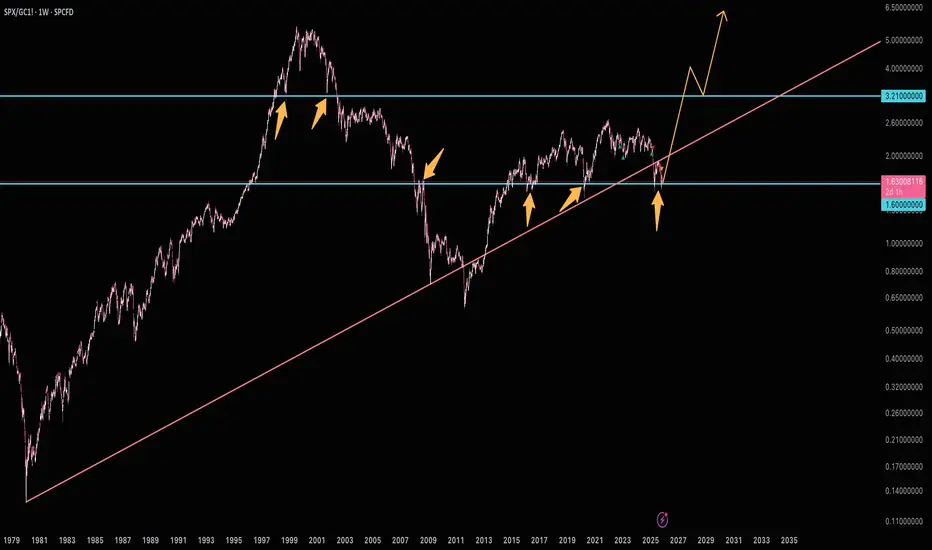
Stocks set to significantly outperformStocks are back on major support and are set to significantly outperform. It's a good idea to be out of gold or USD and pile into stocks for a real increase in value. Shorting gold isn't a bad idea either.
Ignore the bubble talk. When there's a real bubble you'll go out to eat and hear the table next to you talking about stocks.
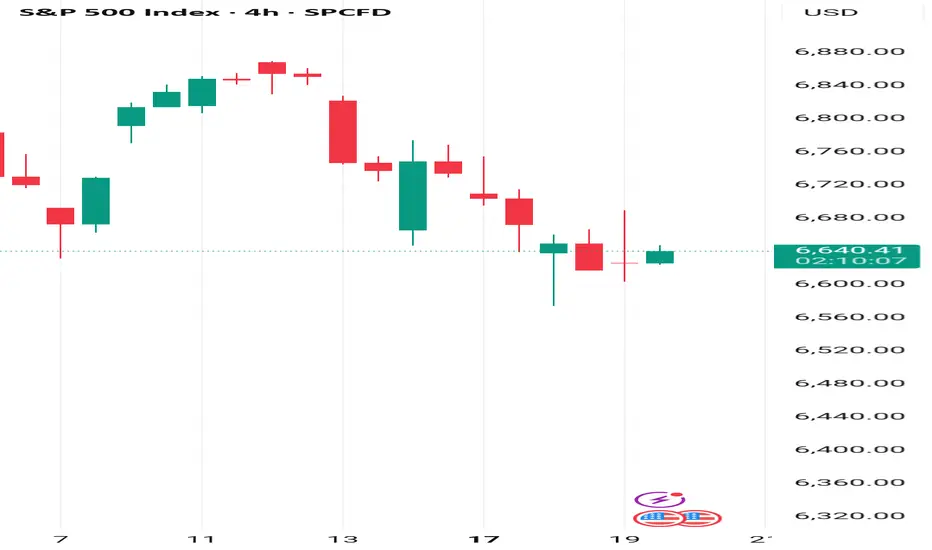
Wednesday 19 November: Forex thoughts Today's 4 HR S&P opening candle (for me) epitomises the trading week so far. Periods of positivity and periods of negativity, with neither action particularly having any 'juice' behind it. It feels like we are 'waiting for something' (NFP?).
Currently, correlations are out of the window and it's difficult.
Sentiment for the JPY remains subdued (rate hike pushed back, if there will be one at all). Which makes the JPY very shortable. But getting the timing correct is easier said than done.
The GBP continues to be remarkably resilient and the AUD continues to under perform its fundamentals.
As things stand, I wouldn't like to hazard a guess at the outcome or reaction to any of the upcoming events (FOMC, NVIDIA, NFP). So, I'm content to observe and form a fresh opinion post NFP.
Yesterday's trade stopped out very quickly, I realise it was bold and unconventional but given the underlying negativity at the time, I still don't think it was the worst idea in the world.
Maybe you have a different interpretation of the week's events so far?
S&P 500 Reversal Roadmap: Second Bottom Forming at PRZ?As I expected in the previous idea , the S&P 500 index has indeed reached its targets after breaking through the Support lines .
Currently, the S&P 500 is approaching the Support zone($6,580_$6,490) , Potential Reversal Zone (PRZ) , and the 100_SMA(Daily) .
There’s a possibility of forming a second bottom and a descending channel in the S&P 500, suggesting that the second bottom could form near the PRZ .
From an Elliott Wave perspective, it seems that the S&P 500 is completing the microwave 5 of the microwave C of the main wave Y .
I expect that, after entering the PRZ or approaching the 100_SMA(Daily) , the S&P 500 will resume its upward movement and potentially rise to around $6,664 .
Note: The S&P 500 currently has a significant impact on the markets, especially cryptocurrencies like Bitcoin( BINANCE:BTCUSDT ). Therefore, a potential rise in the S&P 500 could positively influence Bitcoin as well.
First Target: $6,664
Second Target: $6,723
Stop Los(SL): $6,499
Please respect each other's ideas and express them politely if you agree or disagree.
S&P 500 Index Analyze (SPX500USD), 1-hour time frame.
Be sure to follow the updated ideas.
Do not forget to put a Stop loss for your positions (For every position you want to open).
Please follow your strategy and updates; this is just my Idea, and I will gladly see your ideas in this post.
Please do not forget the ✅' like '✅ button 🙏😊 & Share it with your friends; thanks, and Trade safe.

DECODED ANALYSIS S&P 500 INDEX DECODED ANALYSIS S&P 500 INDEX
Historical Chart Study from1871 to Present.
Based on the decoded multiple yearly candle structure, the S&P 500 grand cycle confirms that its final (last yearly pattern) is forming in a downtrend.
In comparison, the Dow Jones Industrial Average formed its final (last yearly pattern) in an uptrend in 1974.
For the S&P 500 to maintain its structure, the index must move above $6,993.
Key Resistance Levels noted:$6,993
Additional Resistances: $7,256, $7,362, $7,633
Resistances noted for year 2030 at $10,396, $10,740
Support Levels:
Upper Supports: $5,903, $4,871, $3,947, $3,688, $3,590, $3,385
Main Yearly Pattern Support: $2,476
Multiple skipped supports detected, with the lowest noted at $3.25
Disclaimer:
This analysis is for educational purposes only.
Always conduct your own research DYOR.

SPX500 Softens as Tech Valuation Concerns Rise Before EarningsSPX500 | Overview
U.S. futures slipped lower as traders shifted into risk-off mode, driven by renewed concerns over stretched AI and tech valuations ahead of Nvidia’s earnings, set to be released after the market close tomorrow.
Sentiment remains cautious, and price action continues to respect the current bearish structure.
Technically:
SPX500 maintains a bearish momentum while trading below 6670, with downside targets at 6635 and 6610.
A break below 6610 would extend losses toward 6578.
A bullish recovery will only be possible if the price closes a 1H or 4H candle above 6670, which would open the path for a move toward 6706 and potentially 6722–6754.
Key Levels
Pivot Line: 6670
Support: 6635 · 6610 · 6578
Resistance: 6706 · 6722 · 6754
Outlook:
SPX500 remains bearish below 6670, targeting 6635–6610.
A confirmed 1H/4H close above 6670 would shift momentum toward 6706–6722, signaling the first sign of a bullish reversal.

Cognitive Bias VS PrejudgmentCognitive Bias is how you or your brain process or interpret information. What you strongly believe in. (Influenced by beliefs, expectations, emotions, and shortcuts).
Prejudgment could be things that are "most of time true, but not always". Learned truths that can be false. (Prejudgment is treating a general rule as always true).
... markets move based on Supply-Demand dynamic, structural positioning and "least resistance". Markets follow the economy. And there are merits to using quant statistics.
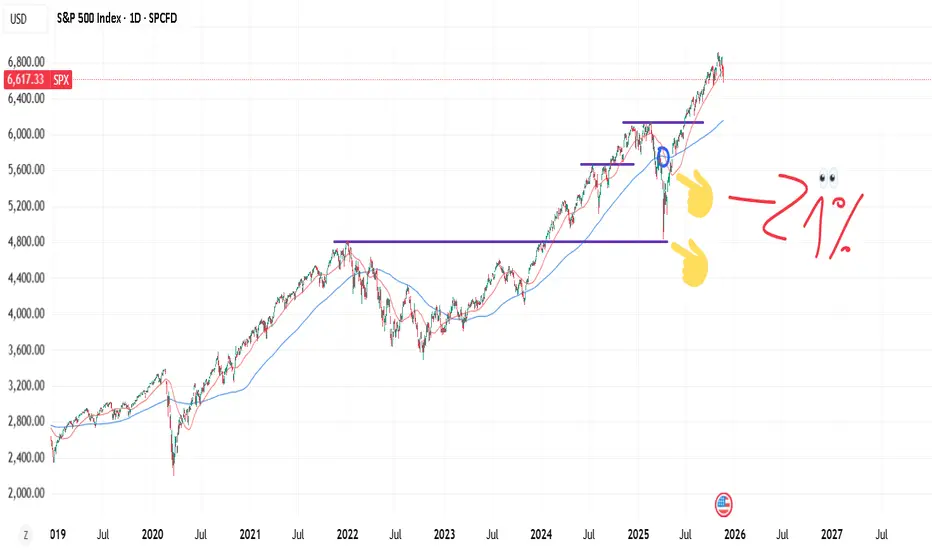
Prejudgment: (Based on DOW theory or Tudor Jones upsloping 200dma) - there is less risk buying strong bull markets. When DOW is broken, price bellow 200dma - it means bear market. In practice this was a statistical scarce spot where big money is made.
-20% is usually a good indicator as well as bottom for the top1% stocks? as well in bitcoin, that wouldn't fall that much.
Prejudgment: Stocks follow the economy (true), tariffs pose risks to economy ie cause recession, hence a bear market.
Statistically, based on like previous 6 years, every sharp drop gets re-filled instantly. ie the V shape recoveries. mirroring 2020. There was a positional imbalance.
Cognitive Bias: trending near the bottom ---> affirms your fears of crash. or bubble talks. Prices follow S-D dynamic, not charts.
Another one is believing that most people are in fear. Which equates a crash.
cognitive biases in short -- you favor or over emphasize the importance of near term events over longterm proven statistics. Markets repeat over and over again, in same psychological patterns.
Old Ship Fleet: uncertainty and risk.In the old days, buying a trading ship posed risks due to natural disasters. Later on, people could have option to buy lets say a 10% share in a fleet of 10 trading ships. When one ship goes down, it doesn't ruin your "portfolio".
I think the concept about not putting all eggs in one basket fits well into risk taking.
Then you have some investors claim, you put all your eggs into one basket - and guard the basket.
The ship fleet works as a syllogism about uncertainty. Math (probability of disaster on statistical basis). And risk taking.
Eggs in one basket is a syllogism about losing everything. But not uncertainty or risk-taking per se.
-> In competitive spaces, with only few or one winner. With exponential, explosive returns -- diversifying or putting eggs in separate baskets make no sense. "Fortune favors the bald" is a better way to describe it.
but it says nothing about mathematical side of uncertainty or risk taking. Hence the "old ship fleet".
Past Resistance = Future Support: Winter 2025-2026 Rally Coming!Past Resistance = Future Support: Winter 2025-2026 Rally Coming!
This video discusses technical reasons why a winter rally is forthcoming; and why market fears are only that; 'pivots' toward the growth of the US economy and new all time highs.

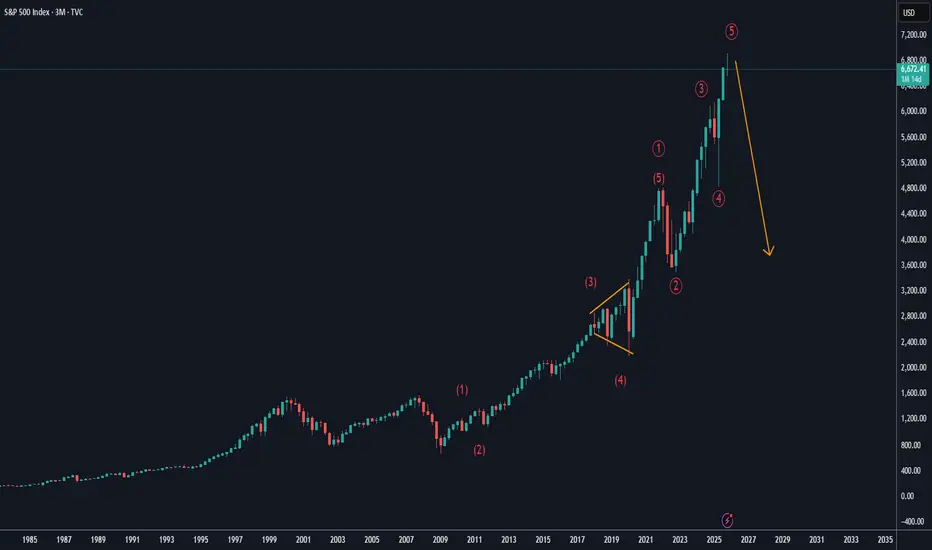
7K End Of Year $SPX Rally into Bearish Deep Crab Plummet? Let's see if this pattern plays out with the Administration touting "money printing" to stimulate the economy, while jobs and the economy are in major decline. Not trading or investment advice. Entertainment only.

Sell you stocks! -227.20% the secreat ATH finder
We reached the secret Fibonacci level (-227.20%) on SPX.
Something big is going on.
This level worked perfectly to spot 2021 ATH on the SPX and now seems to be happening again.
I sold the majority of my stocks. What are you doing?


the PopLooks like a reversal here. A break below the lows and I'm incorrect. Everything is popping. Watch Oil for a break up above the 18ma soon.

S&P 500 falls below 6K - key levels to watchAs highlighted the possibility yesterday, the S&P 500 has now fallen to a fresh multi-week low. The old low at 6631 is now the most important level to watch in terms of upside resistance. Above that 6638, yesterday's low, will come into focus ahead of 6650/5 area.
On the downside, the mid-October lows of 6533 and 6500 are the next areas of interest for the bears. Will we get there? Perhaps if NVidia earnings disappoint tomorrow night.
By Fawad Razqzada, market analyst with FOREX.com

#SPX Intraday Institutional Update. 18 November 2025**S&P 500 – Intraday Institutional Update | 18 November 2025**
The index continues to hover in an extremely uncomfortable elevation zone (~6,870–6,920) after failing multiple times to sustain above the psychologically significant 6,900 round. On the 4-hour timeframe, price action is manifesting as a sequence of indecisive, high-wick candles with diminishing real-body progression — a classic hallmark of structural instability at extreme deviation levels.
Key observations from a risk-desk perspective:
- The S&P 500 remains ~480–510 points detached above the 9-period monthly moving average, a magnitude of extension that historically compresses aggressively once bidirectional order flow reasserts itself.
- 4H momentum profiles (RSI, StochRSI, MACD histogram) are flattening to negatively sloping while price refuses to commit directionally — a textbook precursor to sharp liquidity-driven resolution.
- Equal-high retests over the past 72 hours coupled with expanding H4 range ATR but contracting realized volatility underscore fading conviction among fast-money participants.
- Micro-composite breadth (NYSE advance-decline line, % of stocks above 50-day MA) continues to deteriorate beneath the surface, widening the divergence with price.
From a professional standpoint, the current configuration is one of the more precarious “equilibrium-at-extremes” setups we have monitored in the post-2022 regime. The balance of probabilities now leans toward a violent mean-reversion episode rather than an orderly consolidation. Positioning should reflect heightened caution: elevated gamma exposure, concentrated long positioning in systematic vehicles, and still-rich implied volatility term structure all point to asymmetric downside risk in the very near term.
A decisive 4H close below 6,835 would likely trigger stop clusters toward 6,650–6,680 initially, with risk of acceleration toward the 6,400–6,500 zone if monthly support layers fail to attract defensive capital.
Institutional risk committees are strongly encouraged to re-evaluate gross and net exposure, widen hedging coverage, and prepare contingency capital for volatility expansion.
**Tags**
#SP500 #ES_F #Equities #USMarkets #RiskManagement #MarketStructure
#TechnicalAnalysis #Momentum #Breadth #Volatility #GammaExposure
#InstitutionalInvesting #PortfolioConstruction #Hedging #MacroTrading
#SystematicStrategies #VolatilityTargeting #CTAs #RiskParity
#GlobalMacro #AssetAllocation #QuantFinance #TradingDesk
#GoldmanSachs #JPMorgan #MorganStanley #BankofAmerica #Citi
#UBS #DeutscheBank #Barclays #HSBC #BNPP #SocGen #RBC
#Citadel #Millennium #Point72 #TwoSigma #DEShaw #AQR
#Bridgewater #BlackRock #Vanguard #StateStreet #PIMCO #FidelityInvestments
Possible drop and popIf we breakdown at open be careful of a rally to recover 6650 support. Oil is at it's 18ma, needs to get over it to be bullish. Gold maybe rally to 4100 area before further downside. BTC could go a bit lower but again I think it will bounce sooner rather than later.

S&P500 remain under pressure, support at 6580Equities remain under pressure, with the S&P 500 down 0.92% yesterday, marking:
3rd straight decline (first since September)
Worst 3-day stretch since April (-2.61%)
Futures down another ~0.5% this morning
The index has now broken below its 50-day moving average for the first time in 139 sessions—its longest stretch above the level since 2007—adding to technical downside pressure.
Drivers of the Selloff
AI trade concerns continue to weigh:
Nvidia -1.88%, Philadelphia Semi Index -1.55%
JPMorgan’s Daniel Pinto warned of AI-rich valuations posing broader market risk.
Broad selling across the S&P:
407 decliners, most in 5 weeks
Equal-weight S&P -1.31%, Russell 2000 -1.96%, both at lowest since August
Credit risk sentiment deteriorated:
US HY +5bps, IG +1bps wider
Amazon priced $15bn in new bonds, adding to supply pressure
Mega-cap Tech
Mag-7 only slightly lower (-0.08%), saved by:
Alphabet +3.11% on Berkshire stake news
Apple sentiment mixed:
Design group loss, but strong China iPhone 17 sales (+37%) provided support
Crypto Risk Pressure
Bitcoin -3.3%, touching its lowest since April
Down ~4% YTD 2025
Down nearly 30% from highs 6 weeks ago
Modest rebound this morning helping stabilize risk tone
Macro Tone
Mass layoffs surged in October (Cleveland Fed) → signs of labour softening
Focus shifts to Thursday’s delayed September jobs report for confirmation
Trading Takeaway
Tone remains fragile, but S&P futures and Bitcoin stabilizing suggest some cooling of the global selloff.
Break of the 50-day MA is a key technical negative; next support levels likely in focus.
AI sector weakness + broader macro softening remain dominant headwinds today.
Key Support and Resistance Levels
Resistance Level 1: 6707
Resistance Level 2: 6757
Resistance Level 3: 6785
Support Level 1: 6580
Support Level 2: 6554
Support Level 3: 6530
This communication is for informational purposes only and should not be viewed as any form of recommendation as to a particular course of action or as investment advice. It is not intended as an offer or solicitation for the purchase or sale of any financial instrument or as an official confirmation of any transaction. Opinions, estimates and assumptions expressed herein are made as of the date of this communication and are subject to change without notice. This communication has been prepared based upon information, including market prices, data and other information, believed to be reliable; however, Trade Nation does not warrant its completeness or accuracy. All market prices and market data contained in or attached to this communication are indicative and subject to change without notice.

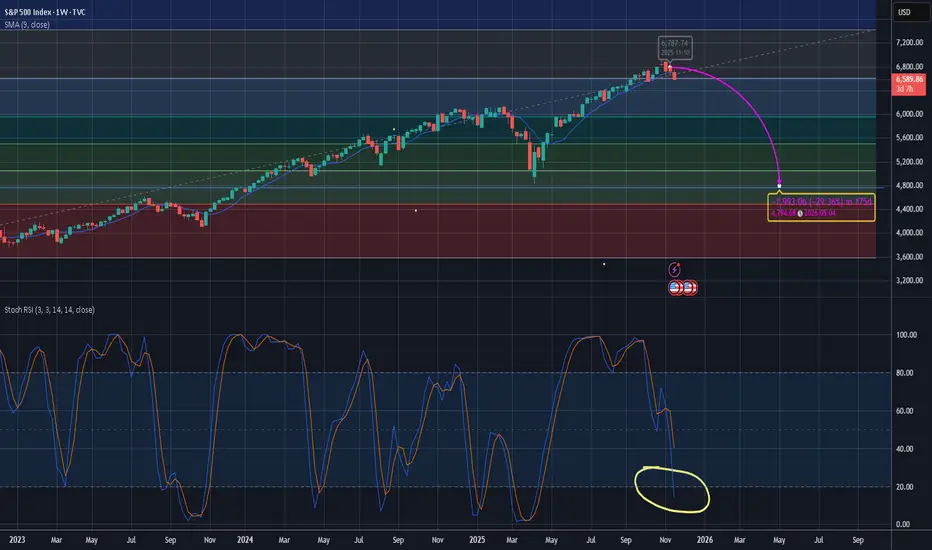
S&P500 close to confirming the new Bear Cycle.The S&P500 index (SPX) broke below its 1D MA50 again yesterday (even closed the day below) and is showing clear signs of weakness at least for the short-term.
This can't be ignored as it may be transferred to the long-term time-frames where the market has been forming a Bearish Divergence on its 1W RSI since October 27. RSI Lower Highs against the market's Higher Highs.
This is similar to the November 15 2021 1W RSI Bearish Divergence, which led to one last quick rally and 1.5 month later the Bull Cycle topped and the 2022 inflation crisis Bear Cycle started.
The signal was given by a weekly closing below the 1D MA100 (red trend-line), which has been the market's natural Support in the past 5 months and also during every major Bullish Leg of the Bull Cycle.
As a result, if the index closes a 1W candle below its 1D MA100, we will call the start of a new Bear Cycle, potentially aiming for the 1W MA200 (orange trend-line), which is where the 2022 Bear Cycle bottomed after a -27.62% correction. Our Target Zone for the next long-term buying will be 5300 - 5000, assuming the top is already in. If not, the -27.62% decline will be re-adjusted to the new top.
---
** Please LIKE 👍, FOLLOW ✅, SHARE 🙌 and COMMENT ✍ if you enjoy this idea! Also share your ideas and charts in the comments section below! This is best way to keep it relevant, support us, keep the content here free and allow the idea to reach as many people as possible. **
---
💸💸💸💸💸💸
👇 👇 👇 👇 👇 👇

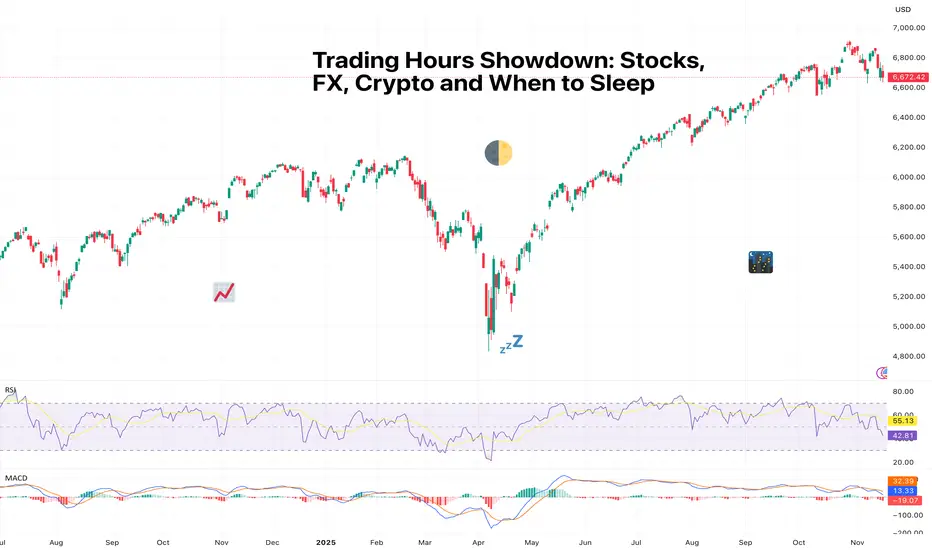
Trading Hours Showdown: Stocks, FX, Crypto and When to SleepSome markets close, some don’t, and some don’t care that you need rest.
If financial markets were people, they’d each have wildly different sleeping habits. Stocks tuck themselves in usually at 4 p.m. (that is, where they originate from), FX stays up all night but insists it’s “fine,” and crypto is that friend who messages you at 3 a.m. with a life-changing idea (and a 12% move for fun).
Understanding when each market is awake, liquid, and volatile is one of the most underrated skills a trader can have. It’s not just about timing entries; it’s about managing risk while you’re away from your devices.
Let’s break down the global sleep schedule and why your portfolio should care.
🌅 Stocks: The 9-to-5ers of the Financial World
US stocks like routine. They open at 9:30 a.m. ET, close at 4 p.m., and observe weekends and holidays like well-behaved citizens.
There’s also pre-market and after-hours trading, but liquidity dries up real fast and moves tend to be exaggerated.
Why it matters:
Limited hours = overnight gap risk
Most volume typically happens in the first and last 30 minutes
Big news after hours can cause violent opens the next day
Stops can’t protect you when price jumps over your level
Every trader eventually experiences the heartbreak of a perfect setup ruined by an overnight earnings surprise. Consider it a rite of passage.
🌍 Forex: The Market with No Bedtime
FX ( forex or foreign exchange) trades 24 hours a day, five days a week, rotating through global sessions:
Asia (Tokyo)
Europe (London)
US (New York)
That’s a 120-hour work week with no break. Think of it like a global relay race where someone is always awake and analyzing inflation differentials.
Why traders love it:
Continuous liquidity = fewer gaps
Beautiful macro-driven trends
Volatility waves follow session overlaps (London–NY especially)
But…
FX weekends could be silent killers. You’re unprotected from Friday close to Sunday open. That’s plenty of time for geopolitical headlines, surprise events, central bank drama, or a country deciding to unpeg its currency.
🔥 Crypto: The Market That Never Sleeps or Blinks
The cryptocurrency market trades 24/7/365. No days off, no weekends, no holidays, no rest. Just pure, unfiltered price action around the clock.
This sounds great until you realize you can never fully unplug. Bitcoin BITSTAMP:BTCUSD does not respect your circadian rhythm.
Why it’s unique:
No “overnight gaps” because it never closes
But liquidity gaps may appear during low-volume hours
Late-night moves can be extreme due to thin order books
Leverage unwinds can trigger liquidation cascades at 3 a.m.
Global retail participation exaggerates emotional spikes
Crypto doesn’t gap like stocks, but it drifts, snaps, and rips through levels and can make your stomach churn.
🧭 Liquidity: The Real Story Behind the Sleep Schedule
Across markets, the one concept that ties them all together is liquidity. That is, how deep the order book is and how efficiently your trades can execute.
Stocks
Thick liquidity during US hours
Thin, jumpy after-hours
Prone to large news-driven gaps
Forex
Deep liquidity almost 24 hours a day
Most volume during London–NY overlap
Macro news instantly reflected in price
Crypto
Liquidity pockets vary wildly
Exchanges differ in depth
Weekends and Asia-over-US crossovers can trigger whipsaws
😴 The Question of Sleep (And How Traders Manage It)
Traders eventually learn a few things about trading various asset classes.
If you:
Hate surprises → Avoid overnight stock positions
Love macro trends → FX is your playground
Enjoy volatility → Crypto keeps things interesting
Value sleep → Choose an asset class that aligns with your time zone and day trade it
Choosing a market to trade isn’t just about your strategy, but also about your lifestyle.
Volatility doesn’t just depend on the asset. It depends on when you’re watching.
Off to you : How do you deal with trading different assets in different time zones? Are you a niche player or a broader market maven? Share your comments below!
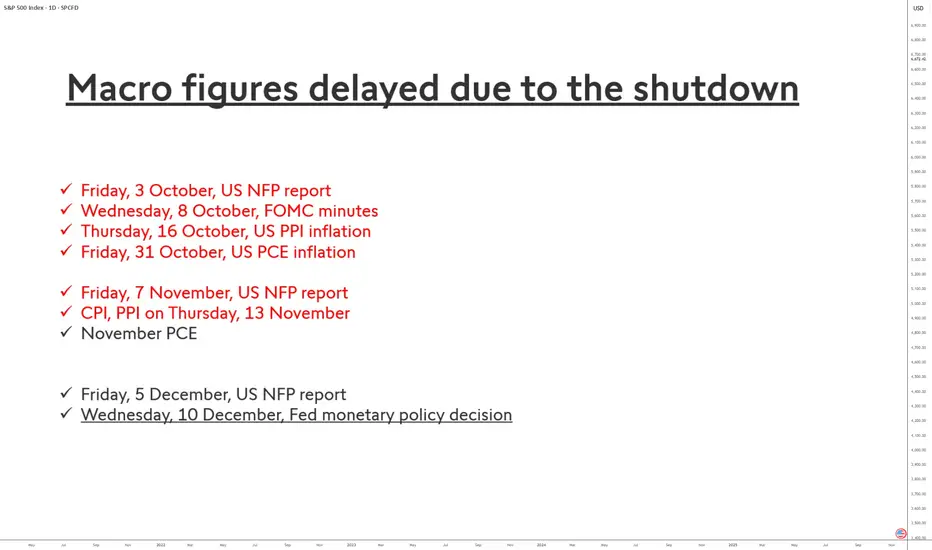
Imminent End of the U.S. Statistical Blackout!The prolonged shutdown of the U.S. federal government has had an exceptional impact on the release of some of the country’s most important economic statistics. Indicators such as the employment report (NFP), PCE inflation, or the CPI are the backbone of the Federal Reserve’s monetary policy and heavily influence financial market volatility. Their delay therefore creates a true statistical “black hole.”
Why are these indicators delayed?
Two federal agencies have been affected:
• the Bureau of Labor Statistics (BLS), responsible for NFP and CPI;
• the Bureau of Economic Analysis (BEA), which publishes PCE inflation as well as household income and spending data.
During the shutdown, these agencies had to suspend the collection, processing, and validation of data. Unlike a simple administrative pause, this disrupts complex statistical pipelines built on surveys of businesses and households. Some data cannot be “caught up” immediately because they depend on strict deadlines, which explains why certain series may be incomplete, revised late, or even canceled.
The case of Non-Farm Payrolls (NFP)
The October NFP report — normally released in early November — was entirely blocked. Signals from the BLS suggest that this report may be partially or totally compromised, especially the household survey, which is more difficult to reconstruct.
By contrast, the September report, which was also delayed, now has a confirmed publication date: Thursday, November 20, 2025.
For the October report, there is still no official date. The most likely estimates point to a possible release in late November or early December, provided the data quality is deemed acceptable.
The case of PCE inflation
The October PCE inflation figure — scheduled for October 31 — was also halted. The BEA announced it would revise its entire calendar but has not yet provided firm replacement dates.
Economists currently expect a publication around November 26, 2025, potentially in a partially “imputed” form (with statistical estimates filling missing data).
Market consequences
The absence of these key data forces investors and the Fed to navigate blindly. Volatility could remain elevated until the full or partial release of these indicators, which should gradually return to a normal schedule starting in December.
DISCLAIMER:
This content is intended for individuals who are familiar with financial markets and instruments and is for information purposes only. The presented idea (including market commentary, market data and observations) is not a work product of any research department of Swissquote or its affiliates. This material is intended to highlight market action and does not constitute investment, legal or tax advice. If you are a retail investor or lack experience in trading complex financial products, it is advisable to seek professional advice from licensed advisor before making any financial decisions.
This content is not intended to manipulate the market or encourage any specific financial behavior.
Swissquote makes no representation or warranty as to the quality, completeness, accuracy, comprehensiveness or non-infringement of such content. The views expressed are those of the consultant and are provided for educational purposes only. Any information provided relating to a product or market should not be construed as recommending an investment strategy or transaction. Past performance is not a guarantee of future results.
Swissquote and its employees and representatives shall in no event be held liable for any damages or losses arising directly or indirectly from decisions made on the basis of this content.
The use of any third-party brands or trademarks is for information only and does not imply endorsement by Swissquote, or that the trademark owner has authorised Swissquote to promote its products or services.
Swissquote is the marketing brand for the activities of Swissquote Bank Ltd (Switzerland) regulated by FINMA, Swissquote Capital Markets Limited regulated by CySEC (Cyprus), Swissquote Bank Europe SA (Luxembourg) regulated by the CSSF, Swissquote Ltd (UK) regulated by the FCA, Swissquote Financial Services (Malta) Ltd regulated by the Malta Financial Services Authority, Swissquote MEA Ltd. (UAE) regulated by the Dubai Financial Services Authority, Swissquote Pte Ltd (Singapore) regulated by the Monetary Authority of Singapore, Swissquote Asia Limited (Hong Kong) licensed by the Hong Kong Securities and Futures Commission (SFC) and Swissquote South Africa (Pty) Ltd supervised by the FSCA.
Products and services of Swissquote are only intended for those permitted to receive them under local law.
All investments carry a degree of risk. The risk of loss in trading or holding financial instruments can be substantial. The value of financial instruments, including but not limited to stocks, bonds, cryptocurrencies, and other assets, can fluctuate both upwards and downwards. There is a significant risk of financial loss when buying, selling, holding, staking, or investing in these instruments. SQBE makes no recommendations regarding any specific investment, transaction, or the use of any particular investment strategy.
CFDs are complex instruments and come with a high risk of losing money rapidly due to leverage. The vast majority of retail client accounts suffer capital losses when trading in CFDs. You should consider whether you understand how CFDs work and whether you can afford to take the high risk of losing your money.
Digital Assets are unregulated in most countries and consumer protection rules may not apply. As highly volatile speculative investments, Digital Assets are not suitable for investors without a high-risk tolerance. Make sure you understand each Digital Asset before you trade.
Cryptocurrencies are not considered legal tender in some jurisdictions and are subject to regulatory uncertainties.
The use of Internet-based systems can involve high risks, including, but not limited to, fraud, cyber-attacks, network and communication failures, as well as identity theft and phishing attacks related to crypto-assets.
Artificial Intelligence & Tech Stocks Rally1. The Rise of AI as an Economic Catalyst
AI has shifted from being a futuristic concept to a real-world productivity enhancer. It now influences every major industry: financial services, healthcare, manufacturing, retail, cybersecurity, logistics, and more. Technologies such as deep learning, natural language processing, and autonomous systems have prompted companies worldwide to accelerate their digital transformation.
The introduction of large language models (LLMs), AI chips, robotics, and automation has created a new economic cycle driven by data, computing power, and algorithmic intelligence. As a result, companies directly involved in AI development—along with those supplying the hardware and cloud platforms—have become market favorites.
Investors increasingly view AI as the next “industrial revolution” capable of reshaping global productivity, profitability, and innovation. This belief has driven massive capital inflows into tech stocks, especially those perceived as leaders in AI research and commercialization.
2. Key Drivers Behind the AI-Fueled Tech Rally
A. Explosive Growth of Generative AI
The launch of advanced generative AI systems dramatically accelerated interest in AI stocks. Major companies quickly integrated generative AI into search engines, productivity tools, customer support, and software development workflows. This rapid adoption strengthened the revenue outlook for tech giants and reinforced investor confidence.
B. Demand for High-Performance Computing & AI Chips
Semiconductor companies, particularly those producing AI GPUs and specialized accelerators, have emerged as the backbone of the AI revolution. The massive need for computational power has pushed chip manufacturers to record valuations. Cloud service providers and hyperscale data centers are investing billions to upgrade their infrastructure to handle AI workloads.
C. Cloud Expansion & Software AI Integration
Tech firms integrating AI into their existing cloud and software offerings have seen rising subscription revenue and improved customer retention. The “AI upgrade cycle”—where businesses adopt AI features as part of cloud services—has enhanced long-term earnings visibility for cloud companies.
D. Automation & Productivity Gains
AI-driven automation is helping businesses improve productivity while reducing costs. Companies that demonstrate measurable efficiency gains from AI adoption are rewarded by investors, who view this as margin-expansion potential. As firms show better earnings due to AI-enabled efficiencies, market optimism increases.
E. Global Government Support
Governments worldwide are prioritizing AI policy, infrastructure, and innovation funding. This includes national AI strategies, incentives for semiconductor manufacturing, and investment in digital public infrastructure. These initiatives create favorable environments for AI-driven business growth, further strengthening investor sentiment.
3. Major Sectors Benefiting from the AI Rally
1. Semiconductor & Chip Manufacturing
AI requires enormous computing power, leading to unprecedented demand for GPUs, neural processing units (NPUs), and specialized chips. Semiconductor companies have seen massive revenue growth due to AI training and inference workloads.
2. Cloud Computing Platforms
AWS, Microsoft Azure, Google Cloud, and others are increasingly viewed as the “AI backbone” because they host AI models and provide infrastructure. Cloud giants benefit from scalable subscription revenue and enterprise AI spending.
3. Software as a Service (SaaS)
SaaS companies integrating AI into CRM, automation, analytics, and productivity tools are experiencing an upgrade cycle. New AI features allow them to charge premium subscription fees, boosting profitability.
4. Cybersecurity
AI-powered cybersecurity systems detect threats faster and manage huge volumes of data. With rising cybercrime, demand for AI-based security tools continues to expand.
5. Robotics & Automation
AI is powering industrial robotics, warehouse automation, and autonomous machinery. The increased demand for efficiency in logistics and manufacturing fuels revenue growth for automation firms.
6. Consumer Technology
AI is enhancing smartphones, smart home systems, wearables, and personal digital assistants. Tech companies adding AI capabilities have seen surging demand for next-generation devices.
4. Why Investors Are Bullish on AI's Long-Term Outlook
A. Multi-Trillion Dollar Market Potential
AI’s total addressable market (TAM) is expected to surpass trillions of dollars over the next decade. Analysts predict long-term growth across nearly every industry, making AI one of the largest commercial opportunities in history.
B. Continuous Innovation & Rapid Deployment
AI models and systems improve continuously. Every new innovation—smarter models, faster chips, more efficient algorithms—creates new commercial opportunities. This rapid pace of change fuels sustained investor enthusiasm.
C. Enterprise Adoption at Massive Scale
Companies across sectors are integrating AI into operations, decision-making, and customer experience. Enterprise adoption is one of the biggest drivers of long-term revenue growth for AI suppliers and service providers.
D. Network Effects & Data Advantages
Companies with massive data pools, extensive user bases, and strong computational capacity benefit from network effects. This creates “winner-take-most” dynamics favoring tech giants—which attract substantial investor capital.
5. Risks & Challenges to the AI Tech Rally
While the AI-driven rally is strong, it is not without risks:
1. Overvaluation Concerns
Some tech stocks have reached extremely high valuations. If earnings growth fails to match expectations, corrections may occur.
2. Supply Chain Constraints
AI hardware requires complex semiconductor supply chains. Shortages in advanced chips could impact production and revenue.
3. Regulatory & Ethical Uncertainty
Governments are increasing oversight over AI data use, privacy, and safety. Regulatory risks can affect growth prospects.
4. High Capital Expenditure
AI infrastructure—data centers, chips, cloud systems—is extremely expensive. Some companies may face profitability pressures due to high capex.
5. Competitive Intensity
AI markets are highly competitive. New entrants, rapid innovations, or pricing pressures could disrupt market leaders.
6. Future Outlook of AI & Tech Stocks
The long-term outlook for AI and tech remains highly positive. Over the next decade, AI is expected to shape global economic growth, productivity, and technological innovation. Key trends include:
Expansion of generative AI across enterprise workflows
Surge in demand for AI chips, data centers, and cloud computing
Growing adoption in healthcare, finance, logistics, education, and retail
AI-powered robotics reshaping manufacturing
Increased global investment in digital and computational infrastructure
Despite market volatility or occasional corrections, AI’s economic impact is expected to grow significantly, making AI and tech stocks central to modern global portfolios.
