SPX500 Analysis SPX500 Analysis 📈
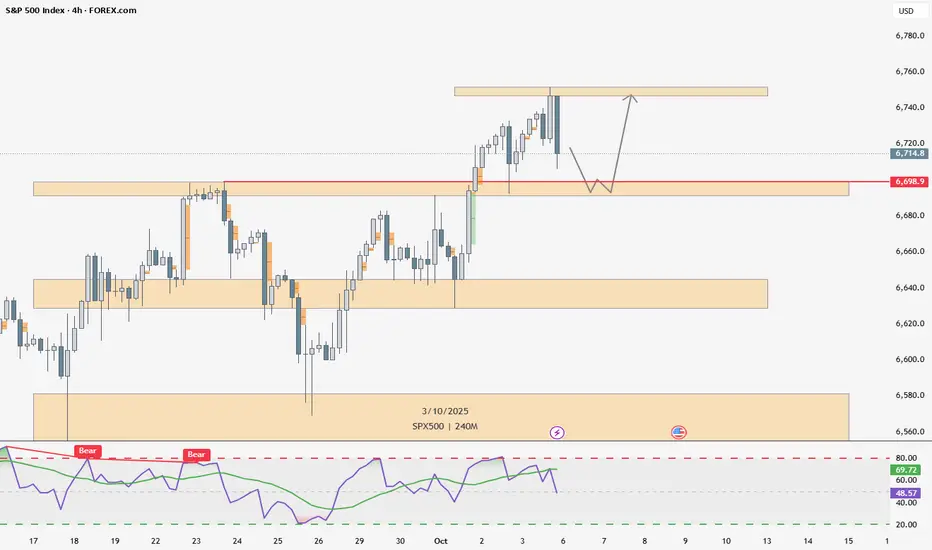
On the daily timeframe, SPX500 has broken the previous Higher High (6698.9), creating a new Break of Structure (BOS).
On the 4H chart, price is currently making a bearish retracement — I expect it could pull back into the demand zone between 6698.9 and 6691.4.
I’m waiting for confirmation to go long from that area,
with a target at the upper supply zone between 6751.8 and 6746.9
SP500FT trade ideas


S&P500 fresh all time highUS equities regained momentum yesterday, with the S&P 500 up 0.58% to a fresh all-time high as investors shrugged off political uncertainty and the ongoing government shutdown. The broader risk-on tone was supported by strong global sentiment, easing bond yields, and renewed optimism across multiple asset classes.
Key drivers:
Political backdrop: Despite the US shutdown and political noise in France, markets focused on stability signals — notably President Macron’s decision to delay a snap election by pledging a new prime minister.
Global rally: Equities, bonds, oil, and gold all moved higher, reflecting a broad-based risk appetite. Gold hit a record $4,042/oz, suggesting some defensive hedging alongside equity strength.
AI momentum: The AI investment boom continued to fuel tech optimism, with Nvidia-backed startup N8n raising $180m at a $2.5bn valuation, underscoring ongoing enthusiasm around AI-linked growth.
Macro & policy: Investors largely looked past Washington gridlock, though air traffic disruptions and debate over furloughed workers’ pay added to the shutdown narrative.
Market tone:
Sentiment remains constructive for the S&P 500, with investors betting on resilient corporate earnings and continued AI-driven growth. However, elevated valuations and political uncertainty may temper further near-term upside.
Key Support and Resistance Levels
Resistance Level 1: 6768
Resistance Level 2: 7800
Resistance Level 3: 6820
Support Level 1: 6695
Support Level 2: 6672
Support Level 3: 6642
This communication is for informational purposes only and should not be viewed as any form of recommendation as to a particular course of action or as investment advice. It is not intended as an offer or solicitation for the purchase or sale of any financial instrument or as an official confirmation of any transaction. Opinions, estimates and assumptions expressed herein are made as of the date of this communication and are subject to change without notice. This communication has been prepared based upon information, including market prices, data and other information, believed to be reliable; however, Trade Nation does not warrant its completeness or accuracy. All market prices and market data contained in or attached to this communication are indicative and subject to change without notice.

SPX500 ShortElite Analysis
Discretionary trade, (80% of Confirmations met)
Targeting lower liquidity pools

SPX × US10Y: A Signal for Market Tops and Economic Shifts1. Combining Equity Levels and Yield Sensitivity
SPX (S&P 500) reflects equity market strength and investor sentiment. When SPX is rising, it typically indicates optimism or strong earnings growth expectations.
US10Y (10-year Treasury yield) reflects the cost of capital and inflation expectations. Rising yields can signify tightening financial conditions or economic overheating.
When you multiply these two metrics, the product magnifies the impact of simultaneous market exuberance (high SPX) and rising yields (high US10Y). A very high SPX × US10Y value could indicate a market environment where valuations are stretched, and higher yields are increasing the cost of capital—often a precursor to market corrections.
2. Historical Patterns
In prior market tops, both equity valuations (SPX) and yields (US10Y) often peak together before significant corrections:
Dot-Com Bubble (2000): SPX was highly elevated, and rising yields signaled an end to loose monetary conditions.
2007-2008 Financial Crisis: SPX was at record highs, and US10Y yields were climbing, reflecting tighter monetary policy.
2021-2022 Post-Pandemic: SPX hit record highs, and yields started to rise sharply as inflation surged, leading to a market correction.
The SPX × US10Y value tends to peak during these moments, providing a warning signal of market excess.
If you are using the SPX × US10Y (multiplication) instead of division, it can still serve as a market indicator, though the mechanics are slightly different. Here’s why the product of the S&P 500 and the 10-year Treasury yield (SPX × US10Y) might be relevant for predicting market tops:
3. Economic Logic Behind the Indicator
A. Reflects Cost of Capital
Rising US10Y yields increase the discount rate used to value stocks. High SPX × US10Y suggests equities are vulnerable to revaluation if yields continue to rise.
B. Overheating Economy
High SPX × US10Y often coincides with an overheating economy, where inflation pressures push yields higher, while equities are driven by optimism. This imbalance can quickly reverse if monetary tightening occurs.
C. Peak Growth Phase
A peak in the SPX × US10Y value might signal the economy is at the late stage of the business cycle, where growth slows, and equities face headwinds.
4. Why It May Predict Market Tops
Valuation Excess: A high SPX × US10Y product reflects elevated valuations combined with tightening financial conditions.
Transition to Risk-Off Environment: Rising yields make bonds more attractive relative to stocks, potentially triggering equity outflows.
Fed Policy Influence: If yields are rising due to Federal Reserve tightening, equity markets often react negatively as borrowing costs rise and liquidity is withdrawn.

US500 Remains BullishUS500 is currently near record levels. The index maintains robust overall performance, with monthly and yearly gains standing above +3.00% and +15%, respectively. This strength is fundamentally driven by broad based bullish sentiment, confidence in strong corporate results, and particularly the ongoing technology sector leadership and AI-related dealmaking, which recently propelled the index to new all-time highs.
Fundamental Analysis
The market's optimism is tempered by underlying caution. Persistent inflation in the services sector remains a key concern, fueling expectations that the Federal Reserve may be compelled to keep interest rates higher for longer, a factor that could limit short-term upside momentum. Despite this, the index's current technical posture remains positive.
Technical Analysis
From a technical perspective, the US500 is in a strong upward trend, but the index is showing signs of being overbought after its recent surge. The immediate key support level is noted at 6,570 points. Looking ahead expect the bullish momentum to continue in the medium term, targeting 6,805 as the next potential resistance milestone. Conversely, the index might enter a period of consolidation or retreat, with projections near 6,485 points and a possible longer-term below 6,000.

Volatility ahead for S&P500The S&P500 index is positioned above the upper line of the Bollinger Bands (20) indicator, showing weakening momentum. Market breadth is slowly decreasing, as the tech sector has got under pressure on Friday. That might be a normal sector rotation mechanism within a bullish market, or a precursor of a wider correction.
Anyways, the bullish trend might persist, but upside breakouts might be vulnerable to profit taking and corrections as the upside rally reaches the plateau.
Don't forget - this is just the idea, always do your own research and never forget to manage your risk!

SPX - Bearish ScenarioContinuous three point touches along a down trend line can be seen in red
Right now price may experience this third touch on its current down trend in red.
From there I think it collapse may follow down to levels in 02 and 08 or a bit above them. (price could recover at the red line along the timeframe when covid was occurring.)
Not sure when it will occur but its going to.
Weekly timeframe

Fundamental Analysis S&P500 NEOWavehere’s a short economic analysis of the U.S. economy in English:
🇺🇸 U.S. Economic Analysis (2025)
The U.S. economy remains resilient in 2025, supported by strong consumer spending, a stable labor market, and easing inflation. GDP growth is expected to hover around 1.8–2.0%, indicating moderate expansion after a period of tight monetary policy.
The Federal Reserve has begun gradual rate cuts, aiming to sustain growth while keeping inflation near its 2% target. Corporate earnings are steady, but high valuations and policy uncertainty present risks.
Overall, the outlook is cautiously optimistic, with solid fundamentals but potential headwinds from global trade tensions and fiscal pressures.

S&P 500 (US500) holds near records high on AI/Fed-cut betsS&P 500 holds near records on AI/Fed-cut bets
Technical analysis
1. US500 has been forming series of higher swings, and the bullish EMAs signal firm upside momentum. Intraday pullbacks are viewed as short-term dips.
2. If US500 breaks above the 6740 resistance, the index could extend to 6770.
3. However, if US500 pulls back and breaks below the 6720 support, a deeper consolidation toward 6700, previously a resistance, may follow.
Fundamental analysis
4. S&P 500 edged up and hovered near record highs, supported by optimism around AI and expectations of additional Fed rate cuts, even as the US government shutdown drags on and delays the release of employment data.
5. Analysts see the market impact of the shutdown as limited compared with the larger risk from a weakening labor market—evident in the mixed labor data (fewer Challenger layoffs but a weaker ADP report), which reinforces that view.
6. With NFP likely to be delayed, investors are focusing on the September ISM services index, which is expected to ease to 51.8 from 52.0.
7. Analysts expect the S&P 500 to remain bullish this week, driven by strong earnings, seasonal trends, and positive technicals. While macro news could cause volatility, the overall trend points upward.
Analysis by: Krisada Yoonaisil, Financial Markets Strategist at Exness

S&P500 H1 | Bullish Momentum Extending FurtherBased on the H1 chart analysis, we could see the price fall to the buy entry at 6,682.33, which is a pullback support and could bounce from this level to the upside.
Stop loss is at 6,651.10, which is a pullback support.
Take profit is at 6,731.11, which line sup with the 161.8% Fibonacci extension.
High Risk Investment Warning
Trading Forex/CFDs on margin carries a high level of risk and may not be suitable for all investors. Leverage can work against you.
Stratos Markets Limited (tradu.com ):
CFDs are complex instruments and come with a high risk of losing money rapidly due to leverage. 65% of retail investor accounts lose money when trading CFDs with this provider. You should consider whether you understand how CFDs work and whether you can afford to take the high risk of losing your money.
Stratos Europe Ltd (tradu.com ):
CFDs are complex instruments and come with a high risk of losing money rapidly due to leverage. 66% of retail investor accounts lose money when trading CFDs with this provider. You should consider whether you understand how CFDs work and whether you can afford to take the high risk of losing your money.
Stratos Global LLC (tradu.com ):
Losses can exceed deposits.
Please be advised that the information presented on TradingView is provided to Tradu (‘Company’, ‘we’) by a third-party provider (‘TFA Global Pte Ltd’). Please be reminded that you are solely responsible for the trading decisions on your account. There is a very high degree of risk involved in trading. Any information and/or content is intended entirely for research, educational and informational purposes only and does not constitute investment or consultation advice or investment strategy. The information is not tailored to the investment needs of any specific person and therefore does not involve a consideration of any of the investment objectives, financial situation or needs of any viewer that may receive it. Kindly also note that past performance is not a reliable indicator of future results. Actual results may differ materially from those anticipated in forward-looking or past performance statements. We assume no liability as to the accuracy or completeness of any of the information and/or content provided herein and the Company cannot be held responsible for any omission, mistake nor for any loss or damage including without limitation to any loss of profit which may arise from reliance on any information supplied by TFA Global Pte Ltd.
The speaker(s) is neither an employee, agent nor representative of Tradu and is therefore acting independently. The opinions given are their own, constitute general market commentary, and do not constitute the opinion or advice of Tradu or any form of personal or investment advice. Tradu neither endorses nor guarantees offerings of third-party speakers, nor is Tradu responsible for the content, veracity or opinions of third-party speakers, presenters or participants.

S&P 500 - GRAND MARKET OUTLOOKS&P 500 - GRAND MARKET OUTLOOK BY FIBCOS
This analysis integrates multiple layers of market interpretation, combining Elliott Wave Theory across Supercycle , Macro , Micro , and Sub-Micro degrees with Smart Money Concepts (SMC) , price action behavior, and Fibonacci retracements/extensions to project the S&P 500 ’s long-term trajectory. It captures how institutional capital rotates through accumulation and distribution phases, aligned with macroeconomic cycles, policy shifts, and investor sentiment. Each wave is grounded in historical and forward-looking fundamental events—from post-war booms to financial crises to the current AI-driven tech surge. The use of Fibonacci ratios (1.618, 3.618, 5.618) provides mathematical confluence for wave targets, while price structure confirms the ongoing impulsive behavior. Altogether, it creates a cohesive, multi-dimensional forecast expected to culminate in a Supercycle Wave (III) top around Q1 2029 , with an S&P 500 target between 20,000(20K).
🌀 Supercycle Wave (III) — The Final Ascent (1942–2029*)
🌍 SUPERCYCLE STRUCTURE: The Multi-Generational Bull
We are inside Supercycle Wave (III) which began in 1942 and is unfolding in 5 Macro Impulse Waves . Each of these macro waves has further Micro and Sub-Micro waves. As of 2025, we're in the final stretch of this grand cycle, specifically:
👉 Sub-Micro Wave ③ of Micro Wave ⑤ of Macro Wave ⑤ of Supercycle Wave (III)
Final top expected in Q1 2029 , around the 20,000 (20K) zone 📍
🧭 MACRO WAVE TIMELINE (Supercycle III)
🔹 Macro Wave ① (1942–1968): 🌟 Post-War Industrial Renaissance
Fundamentals:
WWII victory → economic dominance
Baby boom, suburbanization, auto and housing expansion
Bretton Woods system established USD supremacy 💵
Smart Money Insight:
Institutional capital rotated from war manufacturing into consumer goods, construction, and tech foundations
Price Action: Strong impulsive move with clean higher highs/lows
Fibonacci Insight: Laid the base for 1.618 extension targets
Ends in 1968 with rising inflation and Vietnam drag
🔹 Macro Wave ② (1968–1974): 🌪️ Stagflation Storm
Fundamentals:
Vietnam War expenditures
Gold standard broken (1971 Nixon shock)
Oil embargo, inflation > growth
Price Action: Deep correction, volatile chop, broad distribution
SMC Insight: Institutions exited cyclicals, quietly accumulated future outperformers (tech, defense)
Fibonacci: 0.236% retracement of Super Cycle Wave ii
🔹 Macro Wave ③ (1974–2000): 🚀 Tech & Financialization Explosion
Fundamentals:
Reaganomics & deregulation
PC revolution, Internet birth, globalization 🌐
Explosion in derivatives, S&P futures, ETFs
SMC: Institutions accumulated during 70s lows, fueled tech IPO boom (Apple, Microsoft)
Price Action: Violent rallies with accelerating slope — classic 3rd wave behavior
Fibonacci: Extended well beyond 4.618% of Macro ① & ② — true power wave
🔹 Macro Wave ④ (2000–2009): 🌊 Dot-Com + Financial Crisis Correction
Fundamentals:
Dot-Com bust ➜ $5T in lost value
9/11 shocks & Iraq war
GFC: Housing bubble → global banking collapse
Price Action: Double top structure (2000 & 2007), multi-leg correction
SMC Insight: Smart money cashed out in 2000 and 2007; bought again heavily in March 2009
Structure: WXY complex correction, bottoming with V-shape GFC recovery
Fibonacci: 0.236% retracement of Macro ②
🔶 MACRO WAVE ⑤ (2009–2029): 🔥 The Final Ascent – AI, Liquidity & Euphoria
This is the final macro wave of Supercycle (III), and it subdivides into 5 Micro Impulse Waves.
We are now in Micro Wave ⑤ , which itself contains Sub-Micro Waves 1–5.
🔷 Micro Wave ① (2009–Apr 2010): 🪙 The Bounce from Oblivion
Fundamentals:
Fed QE1 💉, bailouts (TARP), 0% rates
Fear of deflation flipped to hunt for yield
Price Action: Clean V-bottom, shallow pullbacks
SMC: Institutions were loading REITs, tech, and banks post-GFC carnage
🔷 Micro Wave ② (Apr 2010–Jun 2010): 🩻 Flash Crash Flush
Fundamentals:
Euro debt scare, Greece bailout, volatility spike
Price Action: Sharp correction, liquidity vacuum
Fibonacci: Textbook 0.236% retracement
SMC: Stop hunt phase — liquidity grab before next leg
🔷 Micro Wave ③ (Jun 2010–2018): 🚀 Passive Investing Boom
Fundamentals:
QE2, QE3 → massive central bank asset inflation
Apple, Amazon, Google explode in earnings and valuation
ETF revolution = automated capital flows
Price Action: Relentless trend with low volatility
Fibonacci: 2.618+ extension of Wave ①
SMC: Institutions began multi-year hold strategies (FANGM), volatility sellers emerged
🔷 Micro Wave ④ (2018–2020): ⚠️ Volatility & COVID Shock
Fundamentals:
Rate hikes (2018), trade war (US-China)
COVID black swan — global shutdown, crude oil collapse (went negative!)
Price Action: Massive drop with record velocity (VIX > 80)
SMC: Panic selling, smart money accumulation March 2020
🔵 MICRO WAVE ⑤ (2020–2029): 📈 The Final Climb Begins
This is where we are now. This Micro Wave ⑤ is subdividing into:
🟢 Sub-Micro Wave ① (Mar 2020 – Nov 2021): 💹 Stimulus Mania
Fundamentals:
Unlimited QE, COVID relief checks
Crypto/NFT mania, meme stocks (GME/AMC)
Retail explosion via Robinhood & Reddit
Price Action: Parabolic rally, overbought signals
SMC: Institutions faded retail euphoria mid-2021
🟡 Sub-Micro Wave ② (Nov 2021 – Oct 2022): 🔻 Inflation Reckoning
Fundamentals:
CPI > 9%, Fed hikes aggressively
Yield curve inversion, tech meltdown
Price Action: 0.236% retracement
SMC: Smart money rotated into energy, defense, and value stocks during panic
Sentiment : Retail fled, fear extreme — perfect accumulation zone
🔴 Sub-Micro Wave ③ (Oct 2022 – Est. 2027): ⚡ AI Supercycle Ignites
CURRENT WAVE IN PROGRESS
Fundamentals:
AI revolution (ChatGPT, LLMs, Robotics, Automation)
Cloud, semiconductors, defense, biotech surge
Fiscal policy dominance, wars & tech race 🧠
Price Action:
Clean impulse structure
Shallow pullbacks, breakout-retest continuation
SMC:
Institutions aggressively long AI/Defense (Nvidia, Palantir, defense contractors)
Liquidity injections in dips, stealth breakouts
Fibonacci Target: 3.618 extension ~11,200
Expected to peak in 2026
🟠 Sub-Micro Wave ④ (Est. 2027-2028): 🧯 Last Shakeout Before the Climax
Expect:
Profit-taking, geopolitical panic, credit stress
Retest of broken trendline or previous resistance zone
Fibonacci : Retrace 0.236–0.382 of Wave ③
SMC: Final accumulation before blow-off top
🔵 Sub-Micro Wave ⑤ (Est. 2028–Q1 2029): 🚨 Blow-Off Top: 20,000 Target
Fundamentals:
Peak optimism: “AI replaces everything”, euphoria
Retail mania, influencer ETFs
Fed/central banks possibly easing again to avoid slowdown
Price Action: Parabolic, low pullbacks, extreme momentum, RSI divergence, volume climax
SMC: Massive institutional distribution — quiet selling into strength
Target: ~20,000 (5.618 of Wave ①), final top of Supercycle (III)
🛑 What Comes After? SUPERCYCLE WAVE (IV): 🔻 Decade-Long Reset (2029–2040?)
Major correction, potentially multi-decade sideways or secular bear
Catalyst? AI bust, geopolitical war, credit collapse
"Stay focused on structure, not emotions." - FIBCOS
📘 Disclaimer: This is a structural, educational market outlook. Not financial advice. Please do your own due diligence and risk management.
#FIBCOS #ElliottWave #SmartMoneyConcept #MarketAnalysis #Gold #XAUUSD #ElliottWave #WaveTheory #SuperCycle #MacroTrend #SmartMoney #Fibonacci #PriceAction #Commodities #TechnicalAnalysis #LongTermOutlook

Inflation 2022 trendline now is the keyAs you can see this trendline is acting as a major resistance. Once Spx break it out it is highly probable that that trendline turns into a support.
Spx will test is and if it holds we can see 7000/7050 pips by the end of November 2025. That is a 4% gain.
I would like to highligh that because the liquidity in the system is so high is very probable to see this happen... and yes... this is only the beginning because then at 7000 pips there is a Fib ring which could provide us the real progression of the Sp500

S&P 500, Has the Annual High Been Reached?Has the S&P 500 index made its annual peak at 6,700 points? This is the legitimate question technical analysts are asking after the market reached the upper part of a long-term bullish channel last week. The valuation of the S&P 500 has surpassed its late 2021 highs, and the market seems to have reached the end of a bullish rally that began last April.
1. It is logical that the market entered a technical pause after reaching a major target (6,700 points)
In an analysis published on TradingView in mid-September, we highlighted the presence of a medium/long-term bullish channel on the S&P 500. This channel passes around 6,700 points, which was also the median price target of financial analysts for 2025.
The 6,700-point level was therefore both a technical and a fundamental target, so it is logical that this resistance triggered a pause in the S&P 500.
However, it is still far too early to speak of the end of the long-term bullish trend, even if the market enters a short-term correction. The first chart below shows this bullish channel acting as resistance, but it also shows that there is currently no bearish price/momentum divergence (with momentum represented here by the RSI).
2. Market sentiment analysis still does not display the characteristics of a final top
Market tops are always built during phases of retail investor euphoria, while bottoms occur during phases of extreme fear. The latest sentiment survey by the American Association of Individual Investors shows that there is still a balance between buyers and sellers, despite the strong bullish phase between April and September. Here too, the characteristics of a final annual market top are not present, even if a short-term correction is legitimate.
3. Quantitative analysis also does not indicate the end of a long-term bullish trend
It is therefore too early to claim that this upper channel boundary is the final peak of 2025. This is also the message conveyed by quantitative market analysis, which shows that US equities (S&P 500 components) are not in an extreme overheating zone overall. In fact, only 55% of S&P 500 stocks are above their 50-day simple moving average, and the market has not recently entered a phase of excessive bullishness.
DISCLAIMER:
This content is intended for individuals who are familiar with financial markets and instruments and is for information purposes only. The presented idea (including market commentary, market data and observations) is not a work product of any research department of Swissquote or its affiliates. This material is intended to highlight market action and does not constitute investment, legal or tax advice. If you are a retail investor or lack experience in trading complex financial products, it is advisable to seek professional advice from licensed advisor before making any financial decisions.
This content is not intended to manipulate the market or encourage any specific financial behavior.
Swissquote makes no representation or warranty as to the quality, completeness, accuracy, comprehensiveness or non-infringement of such content. The views expressed are those of the consultant and are provided for educational purposes only. Any information provided relating to a product or market should not be construed as recommending an investment strategy or transaction. Past performance is not a guarantee of future results.
Swissquote and its employees and representatives shall in no event be held liable for any damages or losses arising directly or indirectly from decisions made on the basis of this content.
The use of any third-party brands or trademarks is for information only and does not imply endorsement by Swissquote, or that the trademark owner has authorised Swissquote to promote its products or services.
Swissquote is the marketing brand for the activities of Swissquote Bank Ltd (Switzerland) regulated by FINMA, Swissquote Capital Markets Limited regulated by CySEC (Cyprus), Swissquote Bank Europe SA (Luxembourg) regulated by the CSSF, Swissquote Ltd (UK) regulated by the FCA, Swissquote Financial Services (Malta) Ltd regulated by the Malta Financial Services Authority, Swissquote MEA Ltd. (UAE) regulated by the Dubai Financial Services Authority, Swissquote Pte Ltd (Singapore) regulated by the Monetary Authority of Singapore, Swissquote Asia Limited (Hong Kong) licensed by the Hong Kong Securities and Futures Commission (SFC) and Swissquote South Africa (Pty) Ltd supervised by the FSCA.
Products and services of Swissquote are only intended for those permitted to receive them under local law.
All investments carry a degree of risk. The risk of loss in trading or holding financial instruments can be substantial. The value of financial instruments, including but not limited to stocks, bonds, cryptocurrencies, and other assets, can fluctuate both upwards and downwards. There is a significant risk of financial loss when buying, selling, holding, staking, or investing in these instruments. SQBE makes no recommendations regarding any specific investment, transaction, or the use of any particular investment strategy.
CFDs are complex instruments and come with a high risk of losing money rapidly due to leverage. The vast majority of retail client accounts suffer capital losses when trading in CFDs. You should consider whether you understand how CFDs work and whether you can afford to take the high risk of losing your money.
Digital Assets are unregulated in most countries and consumer protection rules may not apply. As highly volatile speculative investments, Digital Assets are not suitable for investors without a high-risk tolerance. Make sure you understand each Digital Asset before you trade.
Cryptocurrencies are not considered legal tender in some jurisdictions and are subject to regulatory uncertainties.
The use of Internet-based systems can involve high risks, including, but not limited to, fraud, cyber-attacks, network and communication failures, as well as identity theft and phishing attacks related to crypto-assets.

SPX - That's all folks?The world has gone nuts, but markets didn't even blink.
Now the SPX has reached it's U-MLH, which means, it's at a real extreme.
This is a level where price starts to stall, then turn.
Often we see "a last attempt" to break through, and it really could happen. But then, gravity again takes it's toll and the rocket starts to turn south.
Here are the scenarios I see:
1. Immediate turn at the U-MLH. Target is the Centerline.
2. A break of the U-MLH, then back into the fork and a fall down to the Centerline.
3. Break the U-MLH, continuation to the WL1.
The most unlikely would be 3.
In my view, Party People should have left allready, but they refused to.
And that's why this time headaches will be the least problem they face.
Wating for a short signal, to load up heavy.

S&P500 pushing to a new ATH?The S&P 500 (+0.34%) pushed to another record high as Q4 began, showing resilience despite ongoing US government shutdown risks and a weaker ADP private payrolls report, which signaled contraction. Markets leaned on expectations of faster Fed rate cuts, with Treasury yields falling sharply as investors reassessed labor market strength.
Sector drivers:
Gold and defensive plays gained as shutdown uncertainty supported safe-haven demand.
Tech outperformed: OpenAI’s $500bn valuation lifted AI-linked sentiment, with gains spilling into suppliers like Samsung and SK Hynix.
Cybersecurity risk weighed on software names after hackers claimed a breach of Oracle’s E-Business Suite, demanding ransom payments.
Apple slipped on reports it is halting Vision Pro updates to prioritize AI glasses.
Market tone: Optimism around rate cuts and AI-driven growth continues to underpin the S&P 500, but shutdown risks and labor market fragility remain key watchpoints for near-term volatility.
Key Support and Resistance Levels
Resistance Level 1: 6750
Resistance Level 2: 6770
Resistance Level 3: 6800
Support Level 1: 6680
Support Level 2: 6660
Support Level 3: 6640
This communication is for informational purposes only and should not be viewed as any form of recommendation as to a particular course of action or as investment advice. It is not intended as an offer or solicitation for the purchase or sale of any financial instrument or as an official confirmation of any transaction. Opinions, estimates and assumptions expressed herein are made as of the date of this communication and are subject to change without notice. This communication has been prepared based upon information, including market prices, data and other information, believed to be reliable; however, Trade Nation does not warrant its completeness or accuracy. All market prices and market data contained in or attached to this communication are indicative and subject to change without notice.

Some ideas and some concernsSP long term view, Dow Jones Transports, and I discuss the patterns on High Yeild Bonds. Cycle experts are warning that a recession may be very close.

$SPX500 Swing Trade: Bullish SMA Setup!📈 S&P 500 CFD: Thief’s Bullish Pullback Plan 🤑💰
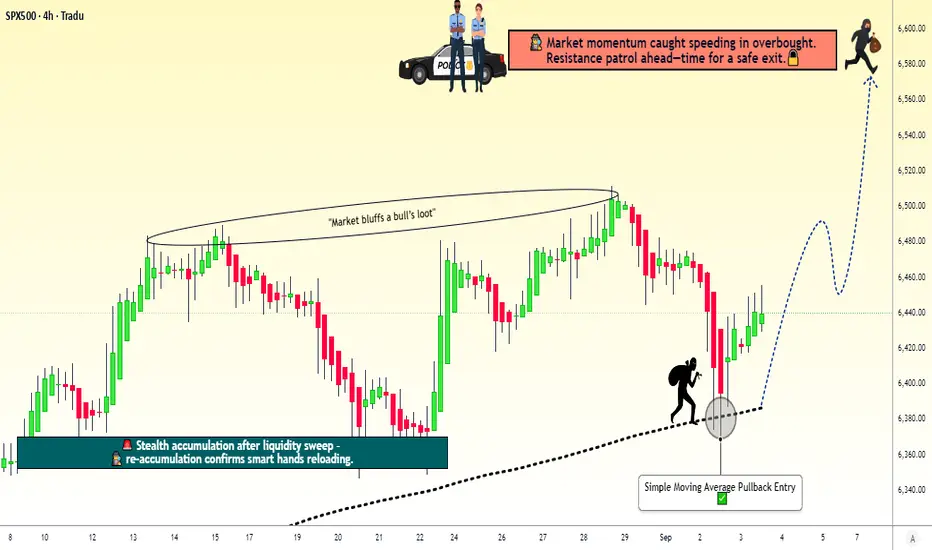
🚨 Swing/Day Trade Setup: S&P 500 Index CFDSteal profits with this 200 SMA Pullback Plan using the "Thief" layered entry strategy! 📊💸 Below is a detailed breakdown combining technicals, fundamentals, and market sentiment to help you navigate this bullish opportunity. Let’s dive in! 🐂
🎯 Trading Plan Overview
Asset: S&P 500 Index CFD ( FOREXCOM:SPX500 )
Bias: Bullish 🐂
Strategy: Pullback to 200 SMA with layered "Thief" limit orders for entries
Why This Plan?
Technicals: The S&P 500 is riding record highs with strong momentum, supported by the 200 SMA as a dynamic support level.
Fundamentals: Cooling inflation (PPI -0.1% vs. +0.3% expected), 100% Fed rate cut probability, and robust corporate earnings (+10% in 2025, +13% in 2026) fuel bullish sentiment.
Sentiment: Neutral Fear & Greed Index (51/100) with low volatility (VIX ~15.04) and AI-driven institutional flows (e.g., Oracle +30%).
📊 Thief’s Technical Setup
Entry Strategy:
Use the Thief Layered Entry approach with multiple buy limit orders to catch pullbacks:
🔔 Buy Limit 1: $6,460
🔔 Buy Limit 2: $6,480
🔔 Buy Limit 3: $6,500
🔔 Buy Limit 4: $6,520
💡 Pro Tip: Adjust layer levels based on your risk tolerance and market conditions. You can enter at any price level or add more layers for flexibility!
Entry Trigger: Pullback to the 200 SMA for optimal risk-reward.
Stop Loss (SL):
Suggested "Thief" SL: $6,440 (below key support).
⚠️ Note: Adjust your SL based on your risk management and strategy. Trade at your own risk, dear Traders!
Take Profit (TP):
Target: $6,700 (near resistance, potential overbought zone, or "police barricade" trap).
🚨 Note: Escape with profits before resistance hits! Set your TP based on your goals—don’t blindly follow mine. Take money at your own risk!
📡 Real-Time Market Data (10 Sept 2025, UTC+1)
Daily Change: +37.43 points (+0.57%)
YTD Performance: Record highs driven by AI optimism and Fed rate cut expectations.
😰😊 Fear & Greed Index
Current Sentiment: Neutral (Score: 51/100)
Breakdown:
📈 Market Momentum: Bullish (S&P 500 above 125-day MA).
🌬️ Volatility (VIX): Low (~15.04), signaling calm markets.
🛡️ Safe Haven Demand: Moderate (bonds lagging stocks).
💰 Junk Bond Demand: Slight greed (narrowing yield spreads).
⚖️ Options Activity: Balanced put/call ratio.
🏛️ Macro & Fundamental Analysis
Producer Price Index (PPI): August PPI fell -0.1% (vs. +0.3% expected), easing inflation concerns.
Fed Rate Cut: 100% probability of a 25-50 bps cut in September 2025.
Labor Market: Weaker-than-expected (911K jobs revised down through March 2025).
Corporate Earnings: Strong outlook (+10% growth in 2025, +13% in 2026).
Key Drivers:
🚀 AI investment surge (e.g., Oracle +30%, Nvidia strength).
🌍 Geopolitical risks (Poland-Russia tensions, Middle East concerns).
📉 Trade policy uncertainties (Trump tariff threats).
🐂🐻 Sentiment Analysis
Institutional Outlook: Cautiously optimistic
🏦 Deutsche Bank & Wells Fargo: S&P 500 targets at 7,000+ by 2026.
💡 Focus: AI capex and earnings resilience.
Retail Trader Mood: Mixed but leaning bullish
📈 Meme stock activity (e.g., GameStop +10%).
₿ Crypto correlation (Bitcoin at $111.9K, Solana at 7-month highs).
⚡ Why This Plan Stands Out
Technical Edge: The 200 SMA pullback is a proven strategy for swing/day traders, offering high-probability entries.
Thief Strategy: Layered limit orders maximize flexibility and reduce risk of missing the move.
Macro Support: Cooling inflation, Fed rate cuts, and AI-driven earnings create a bullish backdrop.
Sentiment Boost: Neutral sentiment with low volatility supports steady upside potential.
Risks to Watch: Geopolitical shocks, overvaluation concerns, and seasonal market weakness.
🔍 Related Pairs to Watch (in USD)
Nasdaq 100 CFD ( NASDAQ:NDX ): Tracks tech-heavy AI stocks driving S&P 500 momentum.
VIX ( TVC:VIX ): Monitor volatility spikes for potential reversals.
US 10-Year Treasury Yield ( TVC:TNX ): Impacts risk sentiment and stock valuations.
FX:USDJPY : Correlates with risk-on/risk-off market moves.
Bitcoin ( BITSTAMP:BTCUSD ): Tracks retail sentiment and risk appetite.
🚨 Key Takeaways
🏆 S&P 500 at record highs, supported by soft PPI and Fed cut expectations.
😎 Neutral sentiment with a greedy tilt if macro data improves.
🤖 AI trade dominates institutional flows, powering bullish momentum.
📅 Watch upcoming CPI data and Fed meeting for next catalysts.
✨ “If you find value in my analysis, a 👍 and 🚀 boost is much appreciated — it helps me share more setups with the community!”
#SPX500 #SwingTrading #DayTrading #ThiefStrategy #Bullish #TechnicalAnalysis #Macro #AI #FedRateCut #TradingIdeas

SPX500 – Bearish Below 6,662 as Shutdown Risks Cloud Fed OutlookSPX500 – Overview
SPX500 is trading cautiously as Wall Street weighs the risk of a potential U.S. government shutdown and the Fed’s next policy steps.
The lack of clarity over upcoming economic data—especially if NFP is delayed—adds to volatility and makes short-term moves highly data- and headline-driven.
Technical Outlook
The index has stabilized below the 6,662 pivot, which supports ongoing bearish momentum.
→ As long as price stays under 6,662, downside targets are 6,635 and 6,617, with a further extension toward 6,580 if momentum accelerates.
However, if price stabilizes above 6,673, the bullish trend could resume toward 6,699 and higher.
Pivot: 6,662
Support: 6,635 – 6,617 – 6,580
Resistance: 6,674 – 6,699 – 6,742

SPX500 Index – Ready for the Next Pullback Heist Move?🚨 SPX500 / US500 Index – The Money Heist Swing Plan 🎭💰
📊 Plan Overview
Bias: Bullish 200-SMA Pullback Plan @ 6380.00
Entry Strategy (Layering Style):
Thief strategy = multiple buy limit orders stacked like layers 🎯
6400.00 ✅
6410.00 ✅
6420.00 ✅
6440.00 ✅
(You can increase or adjust the layering based on your own style and risk tolerance.)
🛡️ Stop Loss (Thief SL)
SL: 6360.00 ⚠️
Dear Ladies & Gentlemen (Thief OG’s), adjust your SL to fit your risk style. This is just the plan’s guardrail.
🎯 Target / Exit
Target Zone: 6580.00 🚀
Note: This is the “Police Resistance” 🛑 – an overbought + trap zone. Escape with the stolen money 🎭💰 before getting caught.
Reminder: Not financial advice. You decide where to take profits.
🤔 Why This Plan?
🔹 200 SMA Pullback Logic: Price retraced into moving average = classic thief-style entry.
🔹 Layering Strategy Advantage: Building positions gradually improves average entry price & reduces risk.
🔹 Momentum & Sentiment: Neutral Fear & Greed Index (53/100) 😐 and low volatility (VIX 16.9) = stable environment for pullback entries.
🔹 Market Strength: US500 is up +16.81% YTD 🚀 with strong sector support (Alphabet +8.57%, Macy’s +19%).
🔹 Risk Factor: Economic data shows weakness (job openings & factory orders ↓), but bulls remain in control = reason for cautious layering.
🔹 Overall Outlook: Bullish score 65/100 ✅ → Mildly bullish bias fits perfectly with a buy-the-dip pullback strategy.
🔹 Trap Zone Awareness: Plan exits near resistance at 6580.00 to avoid overbought trap — thieves always escape before alarms go off 🚨.
📊 US500 INDEX CFD Real-Time Data (September 03)
Daily Change: +0.51% ↗️
Monthly Performance: +1.87% ↗️
Yearly Performance: +16.81% 🚀
All-Time High: 6,510.93 (August 2025)
😰😊 Investor Sentiment: Fear & Greed Index
Current Reading: 53/100 (Neutral) 😐
Trend: Balanced sentiment with no extreme fear or greed.
Key Indicators:
Market Momentum: S&P 500 above 125-day moving average (positive momentum) ↗️
Volatility (VIX): Low volatility (16.90), indicating stability 🟢
Options Activity: Put/Call ratio stable (no significant fear)
Junk Bond Demand: Moderate risk appetite
Safe Haven Demand: Bonds underperforming stocks (greed signal)
📈 Fundamental & Macro Score
Market Breadth: Moderate (balanced volume) ⚖️
Economic Data:
Job openings lowest since Sept (weakness) 🔻
Factory orders down -1.3% 🔻
Friday’s jobs report = critical ⚠️
Sector Performance:
Communication services (Alphabet +8.57%) 🟢
Consumer discretionary (Macy’s +19%) 🟢
Energy sector weak (Exxon Mobil -2.08%) 🔻
🐂🐻 Overall Market Outlook
Bullish Score: 65/100 (Mildly Bullish) ✅
Reasons:
Strong yearly gains (+16.81%)
Low volatility & neutral sentiment support stability
Tech & communication sectors leading momentum
Risks:
Weakening job & factory data
High valuations near ATH
💡 Key Takeaways
US500 trending upward with neutral short-term sentiment.
Friday’s jobs report = key catalyst.
Sector rotation in play: tech strong, energy weak.
Balanced fear/greed supports controlled bullish setups.
📌 Related Pairs to Watch
FOREXCOM:SPX500
CAPITALCOM:US500
TVC:DJI
NASDAQ:NDX
TVC:VIX (for risk gauge)
✨ “If you find value in my analysis, a 👍 and 🚀 boost is much appreciated — it helps me share more setups with the community!”
#SPX500 #US500 #IndexTrading #SwingTrade #LayeredEntry #SMAPullback #TradingPlan #StockMarket #SP500 #InvestorSentiment #FearGreed
S&P 500 – Steady Uptrend Within Rising ChannelThe S&P 500 continues to grind higher within a well-defined rising channel, holding above both the 50-day SMA (6,486) and the 200-day SMA (6,023), which reinforces the broader bullish structure. Price action has respected the channel boundaries since May, with the recent bounce off the mid-line suggesting buyers remain in control.
Momentum indicators support the bullish bias:
MACD is positive, showing steady upside momentum.
RSI sits near 68, not yet overbought but approaching elevated levels, hinting at a possible test of the channel’s upper boundary.
As long as price holds above the 6,600 zone, the path of least resistance remains higher, with the channel top near 6,800 as the next potential target. A break below the channel support, however, could trigger a corrective pullback toward the 6,450–6,500 area, aligning with the 50-day SMA.
Overall, the trend remains bullish, with dips likely to be treated as buying opportunities while the channel structure holds. -MW
