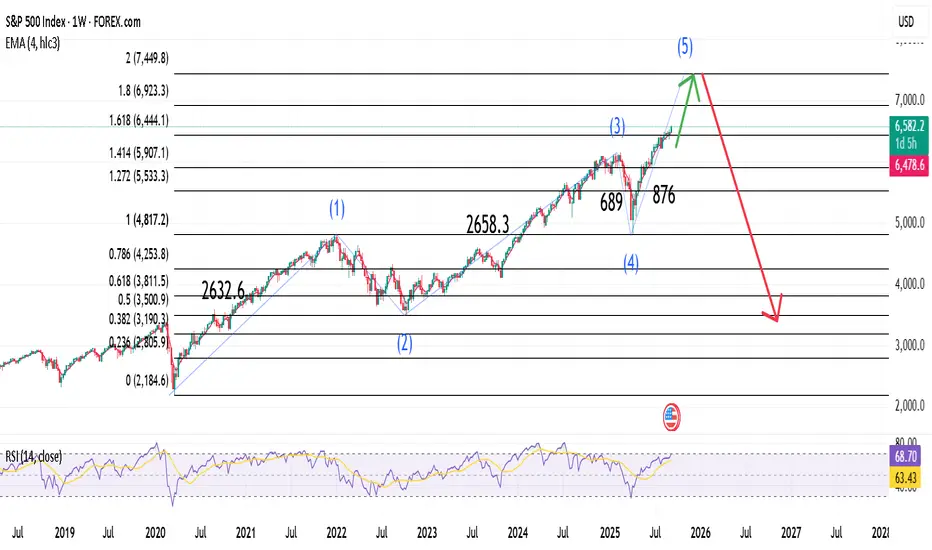
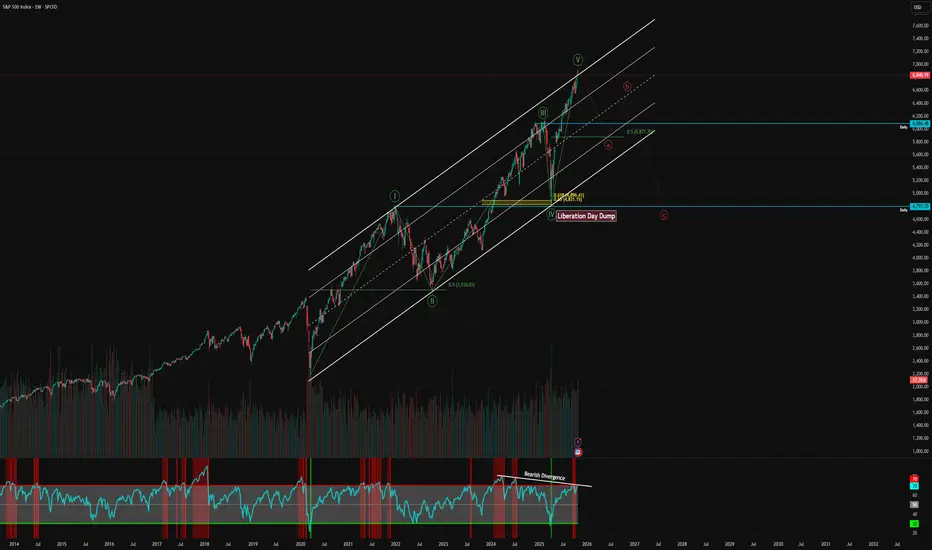
SPX 7450 end of bull cycle then3400In my view bullish cycle started in 2020 will complete at 7450 where massive crash will start to target 3400 area
Trade ideas
S&P 500: Overheated Valuation vs. SeasonalityAs the S&P 500 posts a Shiller CAPE ratio of 40.24 in early November 2025 — nearly equivalent to the dot-com bubble peak in 2000 (~44) — a key question arises: can the U.S. market still advance during the last two months of the year? History suggests that November and December seasonality often favors bulls, yet economic reality and valuation levels may temper this optimism.
Valuations on the Verge of Overheating
Fundamental indicators speak for themselves. A Shiller P/E around 40 signals extreme overvaluation; the historical average is around 17. The Buffett Indicator, which compares total market capitalization to GDP, exceeds 200% — an all-time high, well above levels seen before the 2000 and 2007 crises. In other words, U.S. equity prices are today largely disconnected from the size of the real economy.
Historical comparisons are striking: the market has only been this expensive on the eve of the tech crash twenty-five years ago. This makes any new bullish episode difficult to justify fundamentally. Yet history also shows that markets can remain overvalued for long periods, especially when liquidity is abundant and investors fear “missing out” on gains.
Seasonality: A Favorable Tailwind at Year-End
Statistically, November and December are the most favorable months for U.S. equities. According to Topdown Charts (1964–2024), November delivers an average return of +1%, positive in 69% of cases, while December rises +1.2% on average, gaining nearly 70% of the time.
Market Paradox: Expensive Yet Bullish?
This coexistence of extreme valuation and seasonal bullish momentum is not unprecedented. In 1999, for instance, the S&P 500 gained over 20% in the six months leading up to its historical peak, even though its CAPE exceeded 40. Investor psychology and flow dynamics often play a more significant role than fundamental reasoning in the short term.
However, such an environment reduces the margin of safety: any macroeconomic shock or earnings disappointment could trigger a sharp correction. History shows that markets can ignore excesses … until the moment they cannot.
Conclusion
The S&P 500 approaches the end of 2025 in a paradoxical situation: supported by historically favorable seasonality but in fundamental weightlessness. November and December could indeed be positive due to bullish inertia, liquidity effects, and collective psychology. Yet at these valuation levels, every additional point of gain also brings the market closer to an inflection point.
DISCLAIMER:
This content is intended for individuals who are familiar with financial markets and instruments and is for information purposes only. The presented idea (including market commentary, market data and observations) is not a work product of any research department of Swissquote or its affiliates. This material is intended to highlight market action and does not constitute investment, legal or tax advice. If you are a retail investor or lack experience in trading complex financial products, it is advisable to seek professional advice from licensed advisor before making any financial decisions.
This content is not intended to manipulate the market or encourage any specific financial behavior.
Swissquote makes no representation or warranty as to the quality, completeness, accuracy, comprehensiveness or non-infringement of such content. The views expressed are those of the consultant and are provided for educational purposes only. Any information provided relating to a product or market should not be construed as recommending an investment strategy or transaction. Past performance is not a guarantee of future results.
Swissquote and its employees and representatives shall in no event be held liable for any damages or losses arising directly or indirectly from decisions made on the basis of this content.
The use of any third-party brands or trademarks is for information only and does not imply endorsement by Swissquote, or that the trademark owner has authorised Swissquote to promote its products or services.
Swissquote is the marketing brand for the activities of Swissquote Bank Ltd (Switzerland) regulated by FINMA, Swissquote Capital Markets Limited regulated by CySEC (Cyprus), Swissquote Bank Europe SA (Luxembourg) regulated by the CSSF, Swissquote Ltd (UK) regulated by the FCA, Swissquote Financial Services (Malta) Ltd regulated by the Malta Financial Services Authority, Swissquote MEA Ltd. (UAE) regulated by the Dubai Financial Services Authority, Swissquote Pte Ltd (Singapore) regulated by the Monetary Authority of Singapore, Swissquote Asia Limited (Hong Kong) licensed by the Hong Kong Securities and Futures Commission (SFC) and Swissquote South Africa (Pty) Ltd supervised by the FSCA.
Products and services of Swissquote are only intended for those permitted to receive them under local law.
All investments carry a degree of risk. The risk of loss in trading or holding financial instruments can be substantial. The value of financial instruments, including but not limited to stocks, bonds, cryptocurrencies, and other assets, can fluctuate both upwards and downwards. There is a significant risk of financial loss when buying, selling, holding, staking, or investing in these instruments. SQBE makes no recommendations regarding any specific investment, transaction, or the use of any particular investment strategy.
CFDs are complex instruments and come with a high risk of losing money rapidly due to leverage. The vast majority of retail client accounts suffer capital losses when trading in CFDs. You should consider whether you understand how CFDs work and whether you can afford to take the high risk of losing your money.
Digital Assets are unregulated in most countries and consumer protection rules may not apply. As highly volatile speculative investments, Digital Assets are not suitable for investors without a high-risk tolerance. Make sure you understand each Digital Asset before you trade.
Cryptocurrencies are not considered legal tender in some jurisdictions and are subject to regulatory uncertainties.
The use of Internet-based systems can involve high risks, including, but not limited to, fraud, cyber-attacks, network and communication failures, as well as identity theft and phishing attacks related to crypto-assets.

More upside for SPX500USDHi traders,
Last week SPX500USD went up and made a correction down.
So next week we could see more upside for this pair.
Let's see what the market does and react.
Trade idea: Wait for the correction down to finish. After that look for an impulse wave with a correction down on a lower timeframe. After a change in orderflow to bullish you could trade longs.
This shared post is only my point of view on what could be the next move in this pair based on my technical analysis.
But I react and trade on what I see in the chart, not what I've predicted or expect.
Don't be emotional, just trade your plan!
Eduwave

1.6 FIB Ceiling - Stock market correction soon in NOV/DEC.You can apply 1.6 FIB to FAANG or QQQ for high probability ceilings. VIX "structure" (pattern) or setup also indicates it. Stocks forming a sharp "wedge drop", extension from 50dma.
Bullish near term (probably?), correction in NOV/DEC.
I wonder if the first 5 (monthly) trading days in NOV are not volatile AF. 😂
S&P500 pullback reaching pivotal zone at 6748The S&P 500 (+0.17%) eked out a small gain yesterday, but market breadth remained weak. The Magnificent 7 (+1.18%) continued to drive performance while the S&P 500 ex-Mag 7 (-0.30%) and equal-weighted index (-0.30%) both declined, highlighting the narrow leadership.
The main positive driver came from another AI-related deal—Amazon’s partnership with OpenAI, which boosted sentiment in large-cap tech. However, overall momentum was capped by soft economic data, hawkish Fed commentary, and concerns around a prolonged U.S. government shutdown, now matching the longest on record and set to surpass it by midnight.
Overnight sentiment turned weaker, with Palantir (-4% after hours) dragging tech sentiment lower after offering limited 2026 guidance despite solid results. Nasdaq and S&P futures are down -0.85% and -0.59%, respectively, and Asian markets are mostly lower, adding to the cautious tone.
Today’s focus:
Earnings: A busy session with results from AMD, Shopify, Uber, Pfizer, BP, and others, likely to shape sector moves.
Politics: U.S. state elections (New York mayoral, New Jersey and Virginia gubernatorial races) could test political sentiment but are unlikely to have major near-term market impact.
Outlook: Expect a softer start for the S&P 500 as tech momentum fades and macro uncertainty persists, with investor focus shifting to corporate earnings and central bank commentary for direction.
Key Support and Resistance Levels
Resistance Level 1: 6830
Resistance Level 2: 6857
Resistance Level 3: 6880
Support Level 1: 6748
Support Level 2: 6727
Support Level 3: 6707
This communication is for informational purposes only and should not be viewed as any form of recommendation as to a particular course of action or as investment advice. It is not intended as an offer or solicitation for the purchase or sale of any financial instrument or as an official confirmation of any transaction. Opinions, estimates and assumptions expressed herein are made as of the date of this communication and are subject to change without notice. This communication has been prepared based upon information, including market prices, data and other information, believed to be reliable; however, Trade Nation does not warrant its completeness or accuracy. All market prices and market data contained in or attached to this communication are indicative and subject to change without notice.

S&P 500 Bulls Back in Control – New All-Time High Ahead?As I expected in my previous idea , the S&P 500 index( SP:SPX ) pulled back from its Resistance lines and hit its target.
Right now, the S&P 500 index is in the process of breaking through a Resistance zone($6,894_$6,859). Just a few hours ago, it successfully broke above the upper line of a descending channel , which is a positive sign for a renewed upward move .
From an Elliott Wave perspective, it seems that the S&P 500 index has completed its main wave four, and after breaking this Resistance zone($6,894_$6,859) , we can anticipate the start of a main wave 5 .
I expect that once the S&P 500 index breaks through this Resistance zone($6,894_$6,859) , it will likely climb at least up to the next Resistance lines and the Potential Reversal Zone (PRZ) .
Note: The cryptocurrency market, and especially Bitcoin( BINANCE:BTCUSDT ), has been highly correlated with the S&P 500 index these weeks.
Please respect each other's ideas and express them politely if you agree or disagree.
S&P 500 Index Analyze (SPX500USD), 1-hour time frame.
Be sure to follow the updated ideas.
Do not forget to put a Stop loss for your positions (For every position you want to open).
Please follow your strategy and updates; this is just my Idea, and I will gladly see your ideas in this post.
Please do not forget the ✅' like '✅ button 🙏😊 & Share it with your friends; thanks, and Trade safe.

Topping Signal?To me this looks like Wave 5 of the Elliott Wave supercycle in the stock market. We had a monster rally since the liberation day dump, now we are coming up against some strong resistance.
Should we be concerned? So far I have taken a lot of chips of the table. I am still very much long, we don't fight the tape, but if you haven't already started booking profits; have a good hard think about how much higher we could go from here.
The government shutdown will start to filter through the earnings reports next earnings season, especially if it persists over a month. Consumer stocks are showing weakness, whilst the AI trade continue to go vertical, but it will not go on forever - something will eventually give.
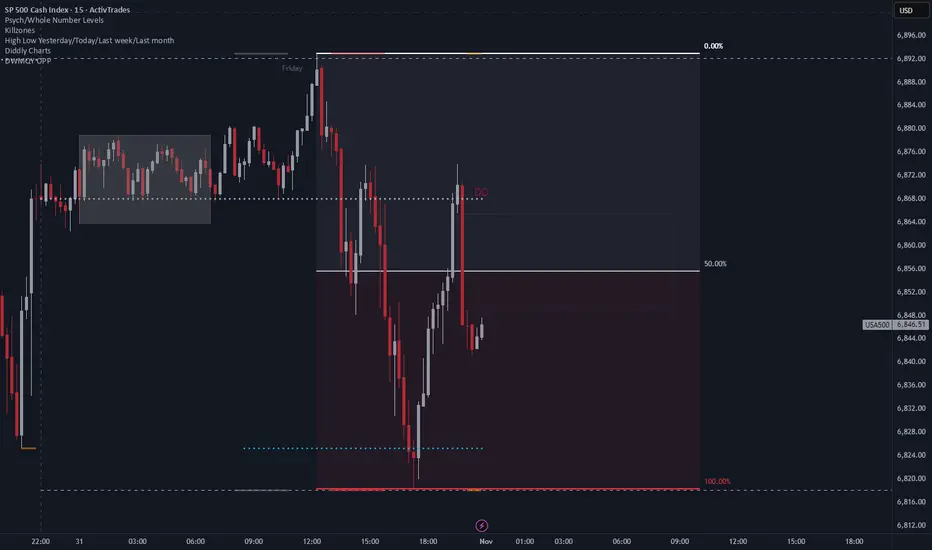
Intraday Range Expansion and Potential Repricing on the SPXFollowing a clean sweep of Friday’s high, price delivered a strong displacement to the downside, breaking short-term structure and rebalancing inefficiencies left behind. The subsequent rebound towards the daily open suggests a retracement into a premium area, potentially setting up for continuation lower if rejection holds around that zone.
If buyers fail to sustain price above the daily open, the market could aim for a full range fill back toward the previous low or discount zones below, maintaining the current bearish intraday order flow.
SPX to 7450?Looking at the long term chart starting from the covid crash we can see 2 impulse of average 2650 pts and two retracement, so from the trump crash to 4800 we could see one last bullish impulse of around 2650 pts to target 7450 in autumn.
Now I expect a retracement to 5965-5970 area before last bullish impule

Weekend Analysis: DXY, BTC, Gold, Silver, Nas100 and SPX500In this video presentation I am expecting the dollar index to continue its uptrend on the lower time frame towards the liquidation level target of 99.500.
Bitcoin is still in a distribution range and currently correcting the sharp sell off from $126,296. I am observing an A-B-C corrective pattern potentially to targets of either $115,044 or $117,653. These are confluence of resistance level and will be expecting a sell off from these levels. If these levels gets invalidated then potentially the all time highs of $126k is in view. However that's not my expectation so a breach of the target level will invalidate the bearish analysis on Bitcoin.
I think Gold and Silver have peaked out for now and smart money is off loading to FOMO retail traders. I am expect Silver to sell off much faster than Gold.
Nas100 and SPX500 clinched to a breakout of new highs but the buying volume is fading out and seems to be a fake out. I will be watching if the breakout levels gets support or breakdown on pullback to decide a long position or short position.
This is my opinion on the market this week and I thank you for your time to visit my publications.
Have a great trading week and don't forget risk and money management is your first job as trader or investor. Cheers!!

SPX500 Eyes 7000 — Breakout or Bull Trap Ahead?🦸♂️ SPX 500 Heist: The 7K Bull Run Playbook (Swing Trade Setup) ✅
Alright, crew, listen up! The market is a vault, and we're here to make a strategic withdrawal. The SPX 500 is showing us the blueprints for a potential bullish breakout. This is our plan to ride the wave.
🎯 The Master Plan: BULLISH
We're looking for a classic breakout play. The gates are at 6780, and once they're open, we're going in.
⚡ Entry Signal (The "Go" Signal)
Action: Consider long positions ONLY AFTER a confirmed daily breakout and close above the key level of 🎯 6780.00.
Translation: Don't jump the gun. Wait for the market to show its hand.
🚨 Stop Loss (The "Escape Route")
Location: My suggested escape hatch is down at 🛡️ 6600.00. Place it after the breakout we talked about.
A Note from the OG: "Dear Ladies & Gentleman (Thief OG's), I am not recommending you set only my SL. It's your own choice. You can make money, then take money at your own risk." 😉
💰 Profit Target (The "Loot Bag")
Destination: We're aiming for the major resistance zone at 🎯 7000.00. This is a psychological magnet and a previous area where sellers stepped in.
Why Here? It's a zone of strong resistance, potential overbought conditions, and traps for the greedy. Be smart and escape with your profits!
Another OG Note: "Dear Ladies & Gentleman (Thief OG's), I am not recommending you set only my TP. It's your own choice. You can make money, then take money at your own risk." 😎
🔍 Market Intel: Pairs to Watch
A master thief always checks the surrounding area. Keep an eye on these correlated assets:
AMEX:SPY (SPDR S&P 500 ETF): The direct tracker. Moves almost tick-for-tick with the SPX.
NASDAQ:NDX (Nasdaq 100): Tech-heavy cousin. If NDX is strong, it often pulls SPX up with it.
TVC:DXY (U.S. Dollar Index): Our usual antagonist. A stronger dollar can be a headwind for large-cap stocks.
CME_MINI:ES1! (S&P 500 E-mini Futures): The real-time action. This is where the big moves often happen first.
✨ Community Boost
If you find value in my analysis, a 👍 and 🚀 boost is much appreciated — it helps me share more setups with the community!
#SPX500 #SP500 #SwingTrading #MarketPlaybook #PriceAction #ThiefTrader #IndexAnalysis #TechnicalAnalysis #TradingStrategy #US500 #Equities #BreakoutStrategy #TradingView #StockMarket #RiskManagement

S&P will decline to 6350 from 6840 in the next 2-5 daysS&P will decline to 6350 from 6840 in the next 2-5 days

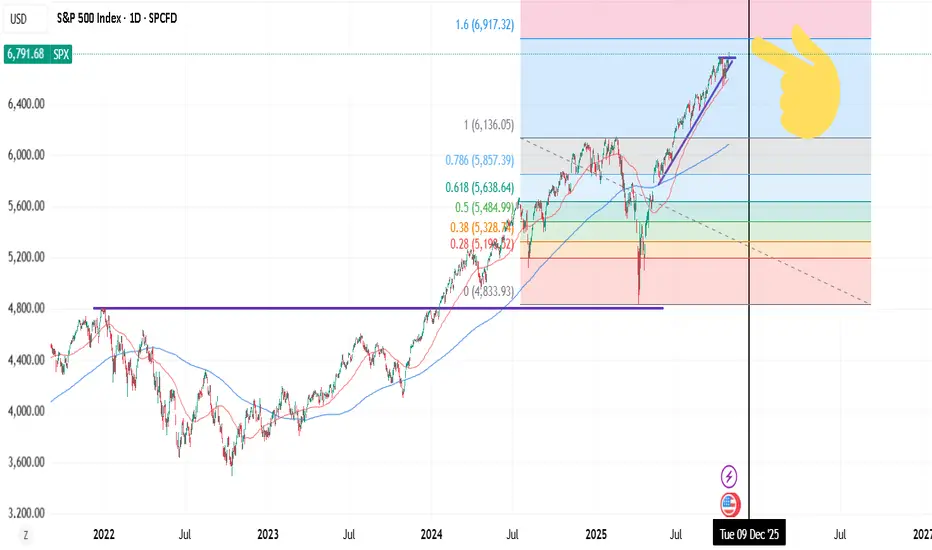
S&P Nearing Major Resistance (Update)This updates my previous S&P chart back last year showing the S&P still had room to run until any major resistance. We're nearing that major resistance at 7577. Looks like it might hit around January 2026.
The trouble is this trend is heating up and we needed a pullback to 6295. With all the excitement from Nvidia and other major Hyperscalers I'm worried it's going to just go straight to Major resistance. *If it does* we could be looking at a decently large pullback next year (finishing around August) down to that 6295 area and back into the supporting trend line for the next big uptrend to start.
If however we slow down here and get a pullback back to 6295 then I think we're good to make it over the major resistance without that big pullback next year.
Either way once we hit the major resistance at 7577 we'll need to get close to that lower trend line at some point to begin a new bull run.
Good luck and take caution as we approach this resistance!

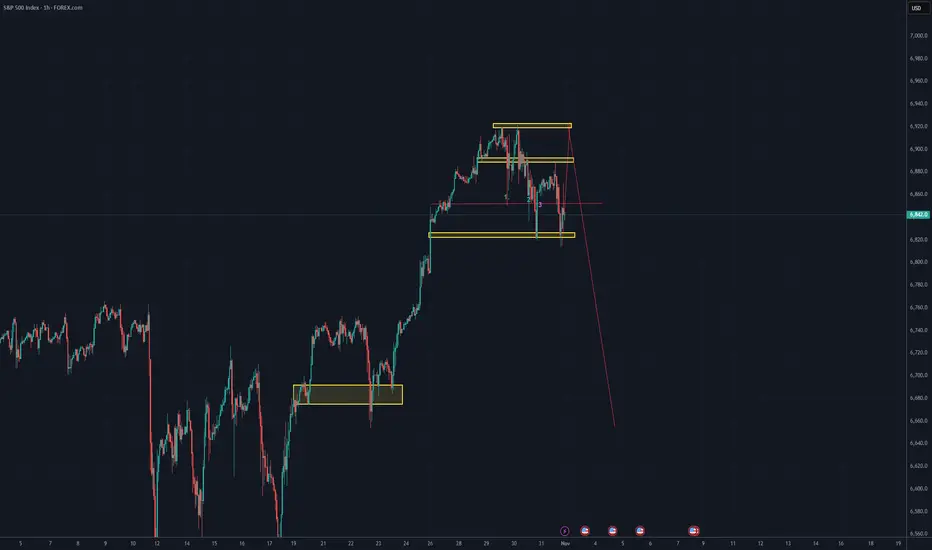
Forget A Pump In SPX Expect A Dump!Hey fellow traders!
We made good money on the SPX pump now it's time to make more on the dump.
8hr chart is making a inverted V pattern another name is a A pattern, none the less we be dropping a long way if we take out and have a 2hr candle close below the break-line of 6859.3 area.
Target 1) 6799.8 area fills a gap.
Target 2) 6691.6 area is a long way down making bears good money :) $$$
Best of luck in all your trades.

SPX | Daily Analysis #11 - 4 November 2025Hello and Welcome back to DP
Review and News Coverage:
As mentioned in the previous daily analysis, the market saw a nice decline — even breaking through the 6811 area and reaching down to 6766. There wasn’t any major news driving the move; it seems the market simply took a breather to gather strength for the next potential rally.
Now that the past move is complete, our focus shifts forward. Tomorrow brings key economic events — NFP (Non-Farm Payrolls) and PMI data — both of which are likely to bring significant volatility to the market.
1H Time Frame Technical Analysis:
At the moment, this bull run could face resistance around the 6826 area. From there, a short-term correction toward the 6800 zone is possible (6811 is no longer relevant).
Personally, I believe the recent downside move has finished, and we should now start looking for buy opportunities. If the price retraces and holds above 6800, it could open the door for long entries and a continuation of the bullish move.
Summary:
• Resistance: 6826
• Support: 6800
• Bias: Bullish (Buy on dips)
• Key Events Tomorrow: NFP & PMI — expect high volatility
Disclaimer:
This content is for informational purposes only and does not constitute financial or investment advice. © DIBAPRISM
Amir D.Kohn

SPX500 | Futures Steady Near Highs, Key Level 6,877 in FocusSPX500 – MARKET OUTLOOK | Futures Edge Higher as Earnings Season Heats Up 🇺🇸
U.S. stock futures inched higher on the first trading day of the month, as traders focus on a busy week of earnings across major sectors.
🔽 Below 6,877: Bearish momentum toward 6,842 → 6,800 → 6,770.
🔼 Above 6,888: Bullish reversal toward 6,918 → 6,941.
Pivot: 6,877
Support: 6,843 · 6,800 · 6,770
Resistance: 6,918 · 6,941
SPX500 remains bearish while below 6,877, though earnings results could trigger short-term volatility or a potential breakout.


SPX500 | Consolidation Phase Before BreakoutSPX500 – MARKET OUTLOOK | Consolidation Phase Before Breakout 🇺🇸
The S&P 500 is consolidating between 6,918 and 6,879, as traders await the next breakout following recent Fed guidance and earnings results.
Above 6,918: Bullish continuation toward 6,941 → 6,991.
Below 6,879: Opens correction toward 6,842 → 6,770.
Pivot: 6,918
Support: 6,879 · 6,843 · 6,770
Resistance: 6,941 · 6,991
SPX500 remains range-bound, but a breakout from this zone will define the next trend direction.

SPX - clear bullish signs ahead..SPX Has recently tested major support levels but struggled to break through below and bounced back up to the upside. The price also broke through the resistance trendline to the upside which is a major clear sign that SPX will be hitting the next upward target (fibonacci extension) shown on the chart

SPX: Bullish Exhaustion Signals a Short-Term PullbackThe TVC:SPX is currently showing signs of a potential short-term retracement after rejecting the 6,860–6,880 supply zone. The recent upswing into this zone lacked strong bullish momentum, suggesting that buyers are losing control. If price maintains below this resistance area, it could indicate the continuation of the short-term bearish structure.
The red zone marks a clear supply area where previous bullish attempts were absorbed, while the green zone below highlights a demand area between 6,740–6,770 — a potential target for sellers. A clean break below the recent intraday low would likely accelerate bearish momentum toward that zone.
Traders may look for confirmation from lower timeframes before shorting, as the broader structure still remains within a corrective phase after the prior rally.

SP500The S&P 500 has been in a strong uptrend since 2023 continuing its long-term bull run.
Currently the index is testing a critical resistance zone near the top trendline and the Fibonacci 1.618 extension (6800 – 7000) an area where rallies often pause or correct.
This makes it a decisive moment for the market: a confirmed breakout above this level could signal further upside while a rejection may trigger a healthy correction before the next move higher.

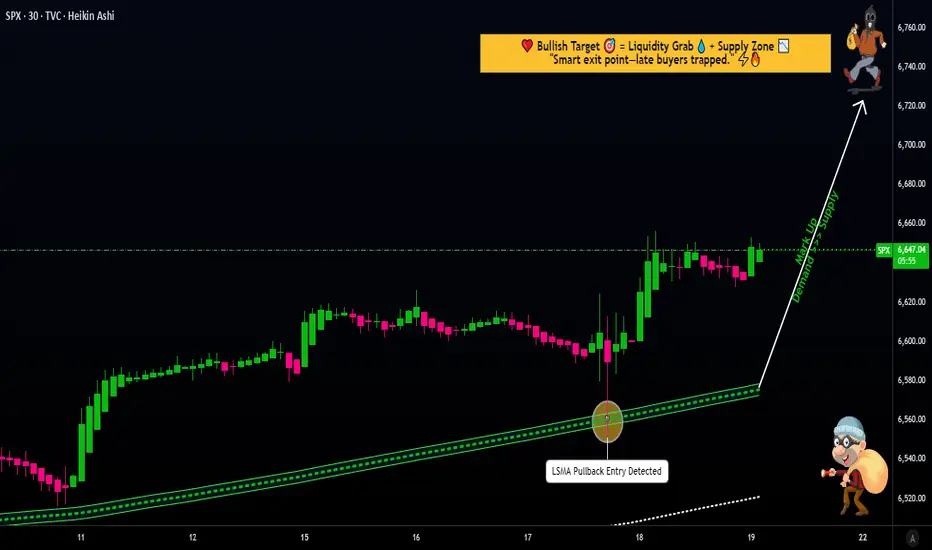
SPX500 Trading Strategy Explained: From Entry to Exit⚡ SPX500 “STANDARD & POOR” Indices Market Wealth Strategy Map ⚡
(Swing / Day Trade Plan – Thief OG Style)
🧭 Plan
📈 Bias: Bullish confirmed with 30m LSMA pullback + 0.786 Fibonacci-based MA confluence.
💡 Entry Approach (Thief Layering Strategy™):
Instead of one-shot entry, I place multiple buy-limit layers to average into strength. Example setup:
Buy limit: 6600
Buy limit: 6620
Buy limit: 6640
👉 You can extend or adjust the layering based on your own strategy.
🎯 Stop Loss (SL)
This is my Thief SL @6560.
⚠️ Note to Ladies & Gentlemen (Thief OG’s): This SL is not a recommendation. Use your own judgment — protect your loot at your own risk.
💰 Target (TP)
📌 6750 — sitting at strong resistance + overbought zone + possible bull-trap.
⚠️ Again, OG’s — this is not financial advice. Take profit when it fits your plan. Secure the bag, then enjoy the loot!
🔍 Related Pairs to Watch
Keep an eye on these correlated assets to confirm the SPX500’s move:
NASDAQ:NDX (Nasdaq 100): Tech-heavy index with strong correlation to SPX500. If tech stocks are pumping, it’s a bullish signal for our trade. 📊
TVC:DXY (US Dollar Index): A weaker dollar often boosts equities. Watch for inverse correlation—DXY dropping could mean SPX500 is ready to fly! 🚀
TVC:VIX (Volatility Index): Low VIX levels signal market calm, supporting our bullish setup. A spike in VIX could warn of trouble, so stay sharp! ⚡
Key Correlation Insight: SPX500 often moves in tandem with NASDAQ:NDX due to shared tech giants (think Apple, Microsoft). If NASDAQ:NDX is rallying, it’s a tailwind for our trade. Conversely, a rising TVC:DXY or TVC:VIX could signal caution.
📝 Thief Note
Dear Ladies & Gentlemen (Thief OG’s):
This map is my personal swing/day trade playbook — not a fixed recommendation. Layer entries, cut losers fast, and loot when you can. Market moves are wild; manage risk like a true OG.
✨ “If you find value in my analysis, a 👍 and 🚀 boost is much appreciated — it helps me share more setups with the community!”
⚠️ Disclaimer: This is a Thief-style trading strategy shared just for fun & educational vibes. Not financial advice. DYOR & trade responsibly.